In my previous utilities post, I talked about revenues and expenses in our utilities, and readers of our financial spreadsheets would see that we make more money in revenues than we spend operating the utility – we make a “profit” every year. So what happens to that money? And if we make a profit already, why are rates going up?
I feel I have to caveat a bunch of this stuff, probably should have in the last post as well – I’m not a finance professional, or even a decent bookkeeper. I need to simplify what are sometimes pretty complex finance rules and practices to understand them myself, never mind try to explain them. So everything here needs to be read in that context – I may get some of this a little wrong in a way that causes a Chartered Accountant to chuckle, but hey, at least it is them laughing at me for a change instead of the other way around. This is also why I am tempted to put scare quotes around a bunch of terms like “profits”, because I realize I am using the terms colloquially, not strictly. So maybe assume any word below that is not used in a way that strictly fits the definition as having scare quotes.
The short answer to that question is that all of the profit from utilities is re-invested into the utilities through their respective capital budget. Looking at the 2019 Water budget that looks like this:
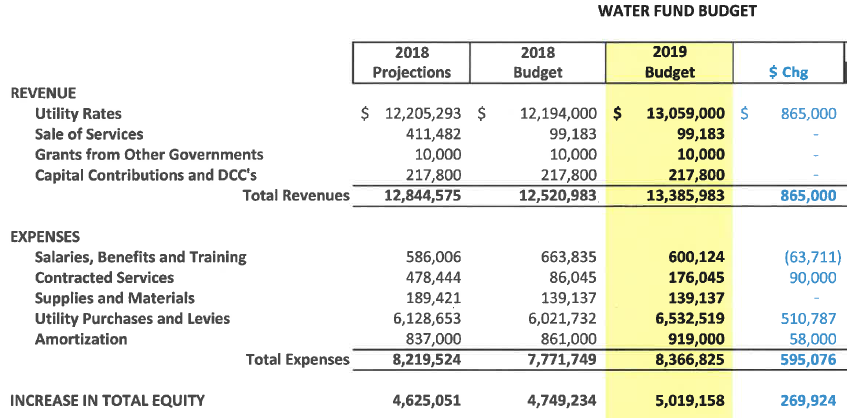
One would be tempted to interpret this as:
Our Revenues are projected to be: $13.4 Million
Our Expenses are projected to be: $ 8.4 Million
So the “profit” is $ 5.0 Million.
However, this is a simplification of our actual 2019 budget, because it only considers our operating budget, not the way we support our reserves and capital costs. This is why the numbers you see here will be a little different than the ones in my previous post – I am going to try to meld together our operational and capital budgets in a way that makes sense. A better way to look at these spreadsheets for people not that into spreadsheets is a flow diagram:
On the left are all of our “inputs”, and the right are out “outputs”, and all of the vertical bars are to scale (numbers are thousands of dollars). You can see most of the income of the utility is in Rates (about $13M of $14M). Of that money, about $6.5M goes to Metro Vancouver to pay for water, about $2M goes to salaries and other operational costs, and about $5.4M ultimately contributes to Capital costs. Most of that Capital spending is on paying for infrastructure repairs and replacements (actual pipes in the ground, valves, pumps, and such), though some goes to equipment (trucks, wrenches, computers) used to keep the infrastructure operating.
Keen eyes will note that the Reserves bar has a gap at the bottom left – we are budgeting to take about $280K more out of reserves in 2019 than we put in. Not shown on this diagram is the ~$4.3 Million we have stored in our reserves at the end of 2018, and how that will be reduced to ~$4.0 Million by the end of 2019. I will talk more about that later.
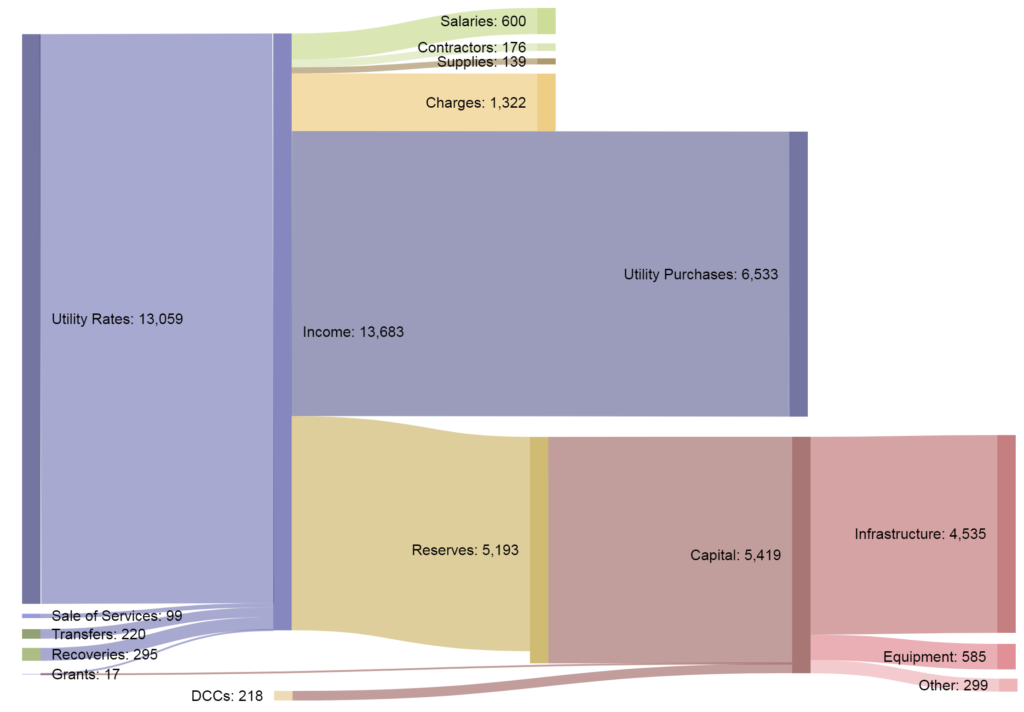
I created a similar flow diagram for the 2019 Sewers budget: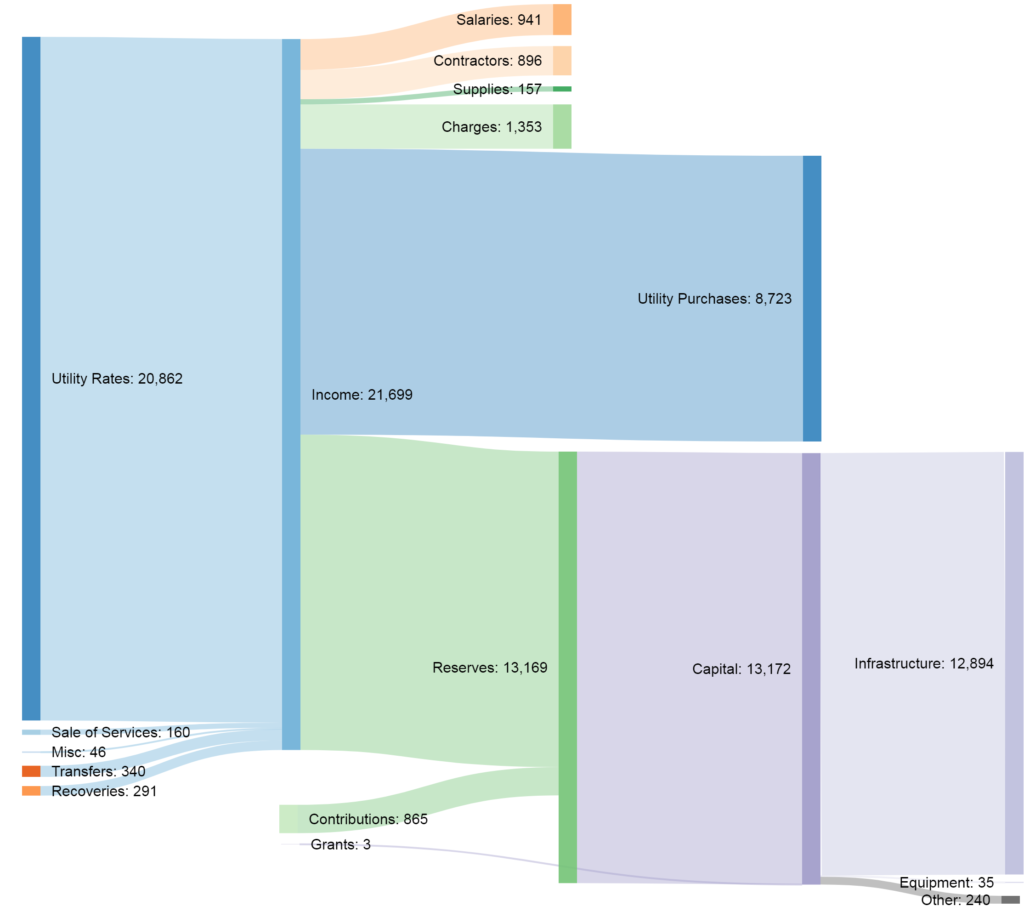 Immediately, you will notice we are spending much more money (proportionally) on infrastructure here than in the water utility. This is largely due to the ongoing sewer separation work that New Westminster has to deal with. You can see it is almost all spent on actual infrastructure ($13 Million!). You will note also that the gap between what we are putting into reserves and taking out is large – about $2.7 Million in 2019. We are also expected to receive another $865K in grants to help pay close that gap. Again, more on this later.
The Solid Waste budget looks a little different: Two things stand out here: the capital budget is much smaller (it is all equipment), and both salaries and Charges is much bigger. This has to do with the nature of the work, collecting garbage requires people, and I suspect the largest “charges” expense is fuel to keep the garbage trucks rolling.
So that is where we are in 2019, but what will change as we increase rates every year?
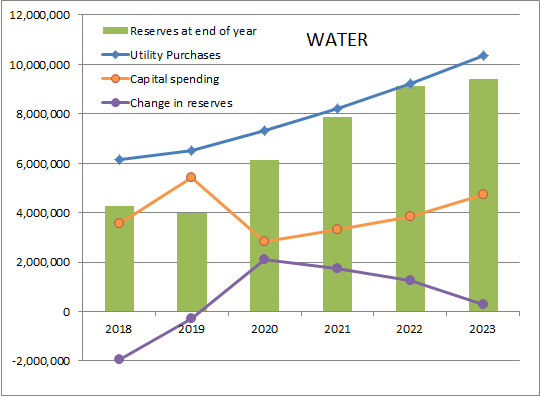 This graph shows how the main Water Utility cost drivers are going to change over the 5-year plan. The rates we pay to Metro for water going up steadily, capital spending increasing at a lower rate, and the trend for our reserves is moving from a small annual loss (remember the gap in the flow chart above) to an increase, then trending back to even. You can see by the green bars that our reserves are currently just over $4 Million, with the goal of them settling in at just under $10 million.
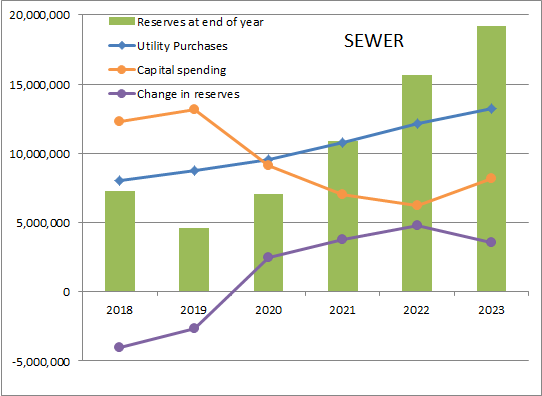 The same graph for the Sewer Utility shows Metro rates steadily increasing, capital spending going down, and our reserve contributions again going from negative to a more sustainable level.
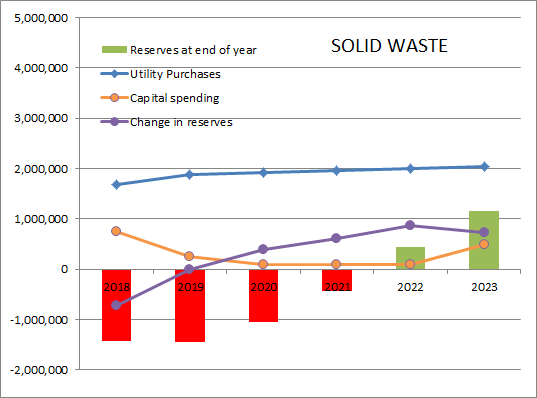 Finally, our Solid Waste accounts show Metro rates only increasing moderately, and our capital spending going down for a few years while the trend for reserves will hopefully go from a deficit position to a small positive reserve.
In summary, the current plan will get our utility reserves back into a place where they can support the long-term financial sustainability of the utilities, and constrain our local capital spending a bit to buffer this. The part we have less control over is the Metro Rates, and this topic is something that is making waves across the region. I’ll write more about this in a future blog post.