Paving a stretch of road in the City shouldn’t be news-worthy, the City spends something like $4 million a year on pavement management, and there are lots of roads that have seen recent paving, but the stretch of Sixth Ave in the West End has been such a bouncy boulevard of broken seams for a while now that people have been asking me why this key road in the City is so bad.
Now that we have timeline for re-paving, it’s a good time to talk about why it took so long, and why bumpy roads are sometimes running on top of a good news story. The West End has been the location of a lot of infrastructure upgrades over the last couple of years, and some of it is coming to an end.
The big project is the West End Sewer Separation and Watermain Replacement project. The main drive behind this project is replacement of the City’s old combined-flow sewer systems in the area with separate sanitary sewers (wastewater from homes that goes to the sewer treatment plant) and storm sewers (rain run-off from roads that goes to the river). This includes 8.4 km of new sewers, along with 24 rain gardens designed to decrease peak flow runoff. This will result in less storm water going unnecessarily to the water treatment plant for expensive treatment, and less chance of combined sewer overflows in to the Fraser River during storm events. There are also some older water mains in the area that need to be replaced and upgraded, , and it only makes sense to coordinate that work at the same time if you are tearing up the road anyway.
The timing of this project was also influenced by the significant support we received from senior governments to make it happen. The total project cost is $14.3 Million, of which $3.8 Million will be paid off over time by water and sewer utility users. The rest was paid by infrastructure grants from senior government: $5.7 Million from the Federal Government and $4.8 Million from the provincial government.
At the same time, this project overlapped with two major Metro Vancouver projects – the Annacis Island Water Main and the Central Park Water Main, and although only one of these crosses Sixth Ave specifically, the overlap with the bigger West End project was such that timing needed to be coordinated to manage traffic flows, cross-cutting infrastructure, and some excavation works.
Finally, because of new federal requirements, these projects required archaeological assessment work and the development of new chance find protocols for the City. This is a new area of work for the City, but an important step in reconciliation and meeting our UNDRIP commitments. This requires (you guessed it) digging of various test holes to identify where the native soils and underlying non-organic sediments interface, and identification of potential hot spots for archaeologic findings.
Overall, this was about a year and a half of work, and there were many occasions to break pavement during these works: various trenches for sewer or water lines or relocation some existing infrastructure, along with installing access chambers, valves, flow monitors, and tie-ins and the occasional archeological test pit. At some spots poor quality soils needed to be removed and replaced with competent backfill to support the sewer works or roadway above. Over that year and a half, there is really little point in spending a lot of money re-grading the road base and repaving when there are so many more excavations coming. Those temporary backfills begin to pile up, and the road becomes the bumpy patchwork quilt that is Sixth Ave. With the bulk of digging work now completed, the pave is about to begin.
There are a couple of spots that will still need one more excavation, likely in the spring, for good technical reasons. So that means a couple of the intersections are not going to be re-paved this time around, but will see their permanent paving next year. But for most of Sixth Ave from 12th to 20th, a smoother ride is coming soon. Sorry it took so long.
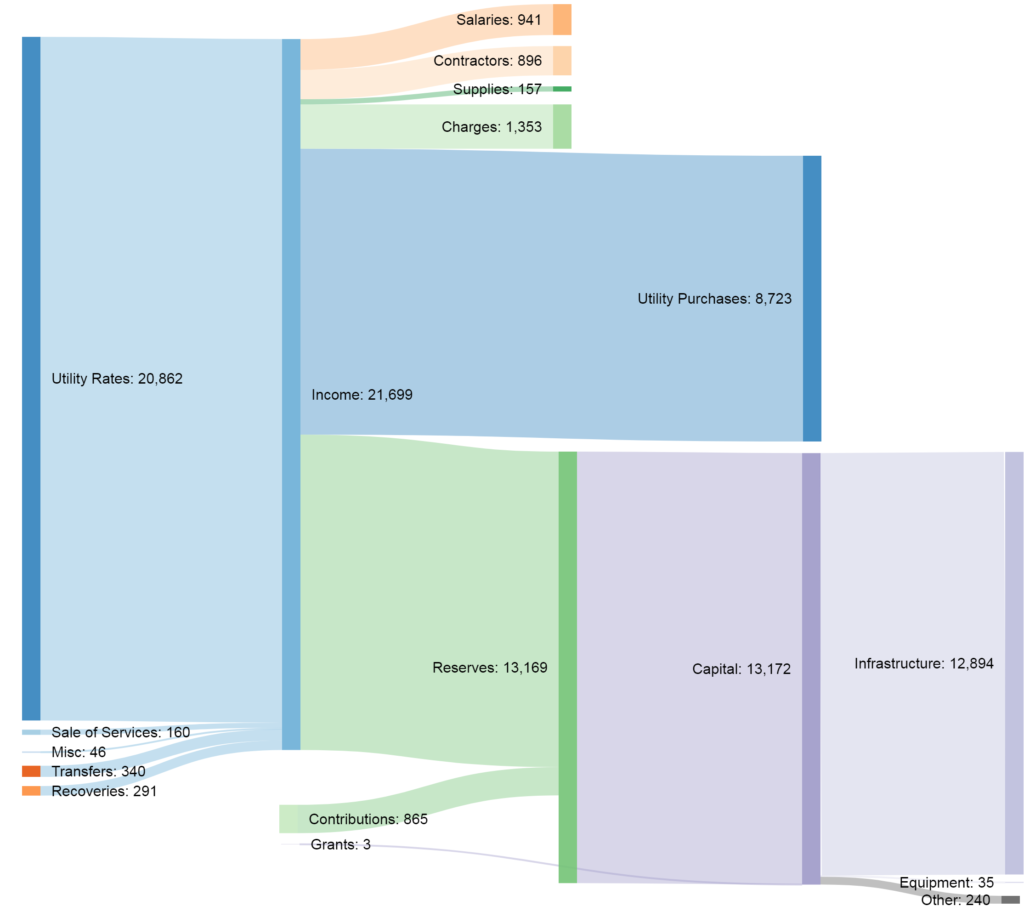 Immediately, you will notice we are spending much more money (proportionally) on infrastructure here than in the water utility. This is largely due to the ongoing sewer separation work that New Westminster has to deal with. You can see it is almost all spent on actual infrastructure ($13 Million!). You will note also that the gap between what we are putting into reserves and taking out is large – about $2.7 Million in 2019. We are also expected to receive another $865K in grants to help pay close that gap. Again, more on this later.
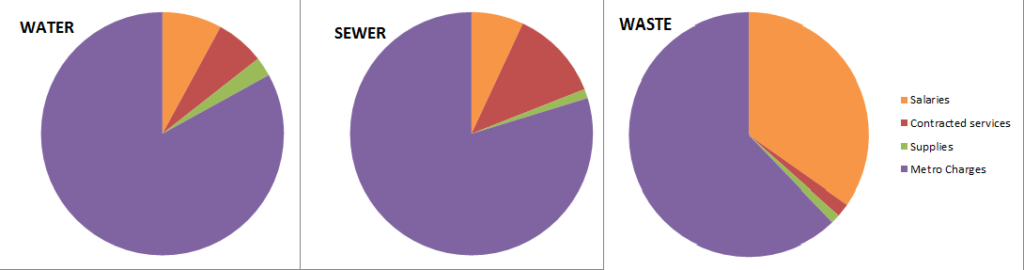
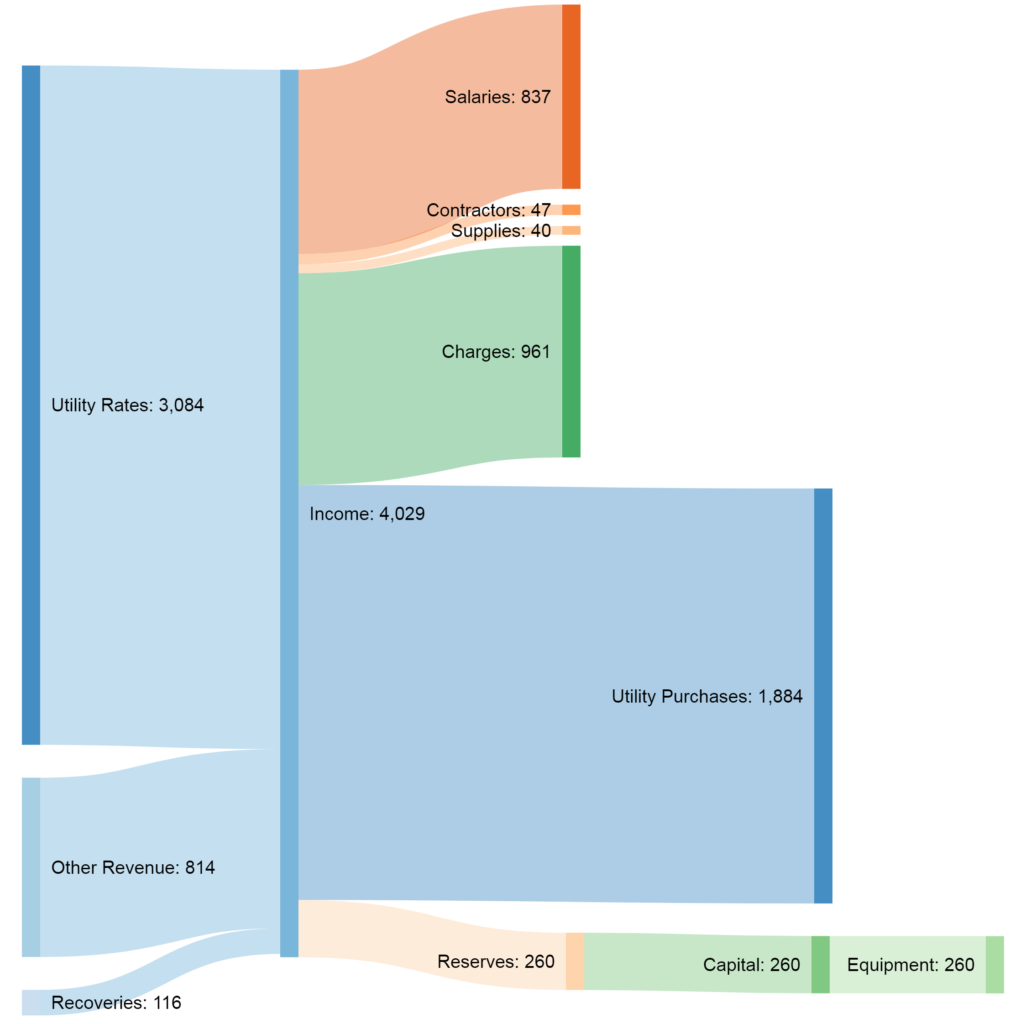 Two things stand out here: the capital budget is much smaller (it is all equipment), and both salaries and Charges is much bigger. This has to do with the nature of the work, collecting garbage requires people, and I suspect the largest “charges” expense is fuel to keep the garbage trucks rolling.
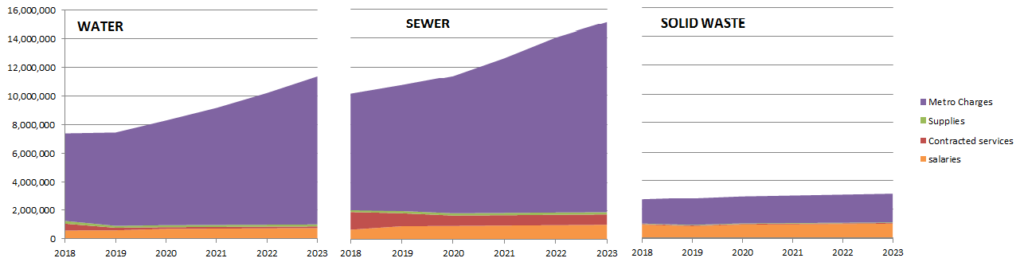
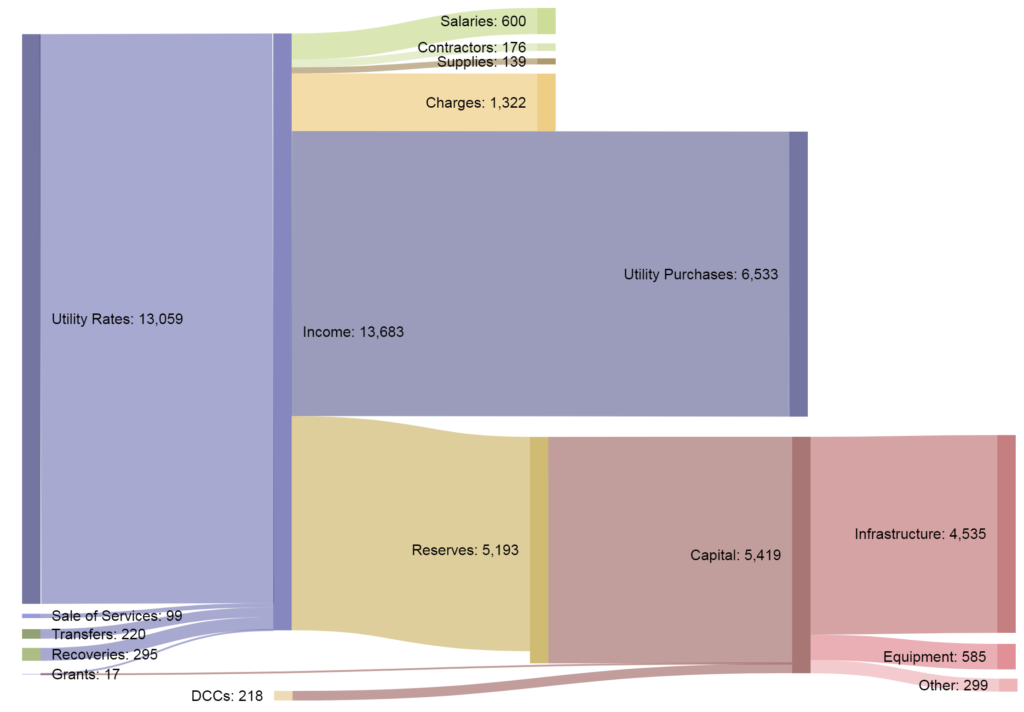
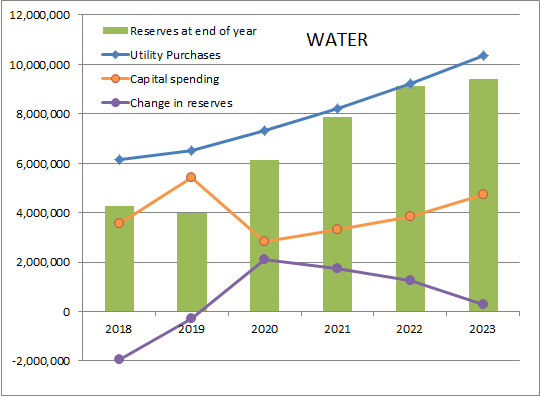 This graph shows how the main Water Utility cost drivers are going to change over the 5-year plan. The rates we pay to Metro for water going up steadily, capital spending increasing at a lower rate, and the trend for our reserves is moving from a small annual loss (remember the gap in the flow chart above) to an increase, then trending back to even. You can see by the green bars that our reserves are currently just over $4 Million, with the goal of them settling in at just under $10 million.
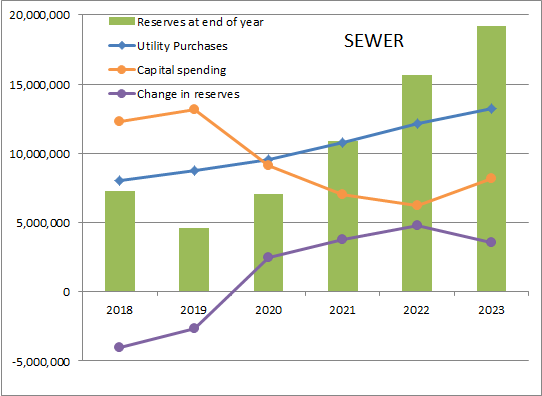 The same graph for the Sewer Utility shows Metro rates steadily increasing, capital spending going down, and our reserve contributions again going from negative to a more sustainable level.
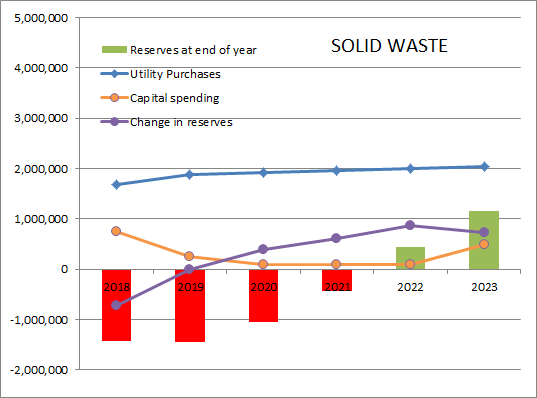 Finally, our Solid Waste accounts show Metro rates only increasing moderately, and our capital spending going down for a few years while the trend for reserves will hopefully go from a deficit position to a small positive reserve.