The conversation about property taxes is always loudest not at tax time, but when the annual tax rates are announced. Early in the new year, every City Council in BC gets to the part of the annual budgeting process where tax increases enter the conversation.
Most of the rest of the year, Council talks about things they want to do. People come to Council and ask the City to do things. Any reduction in the base level of service is treated as an affront to all that is good. Reluctance to take on new tasks is seen as not supporting the incredible community benefits those tasks will support. Ten months of the year Council is asked to do more; two months of the year, we are told to spend less. That is not a complaint, it is an observation of how democratic government works. It’s the job I applied for.
As a result, discussion of taxes is rarely separated from discussion of ever increasing taxes. It does little to tell people that federal and provincial taxes have been steadily going down in Canada and BC for several decades as more tasks are downloaded to local governments. Property taxes are going up faster than inflation, and some people don’t like it.
Following on my last post, and in my continued quest to compare us to our cohort, I got to digging into the data again. We can again compare the New Westminster experience to the rest of Greater Vancouver through the BC Government stats on property taxes that are available as far back as 2005 here in “Schedule 707”. I will continue to argue (until someone gives me a good reason to think otherwise) that taxes collected per capita is the best comparator of taxes paid across the region. So how does New West compare to the other 20 Greater Vancouver Municipalities in tax per capita of the last 15 years? It’s a bit messy, but here we are: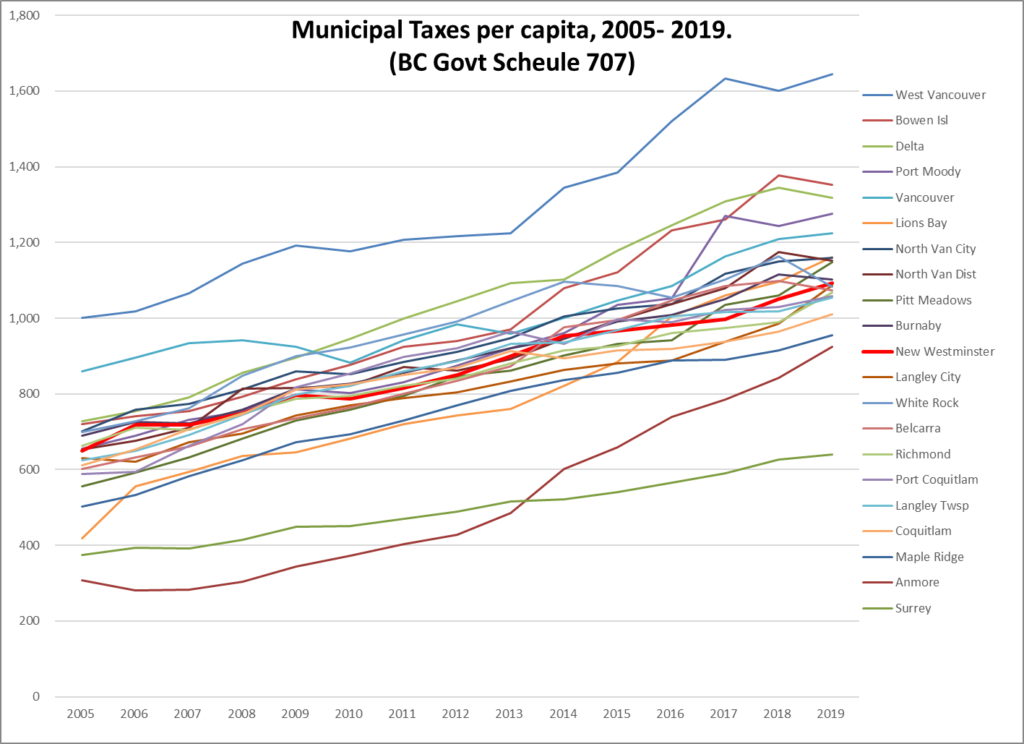
There are two outliers: West Van has always been highest, Surrey has been lowest. New West is somewhere in the middle, increasing slightly less (by my eye) than average over the decade and a half. The big tends if I try to parse them: Delta and Port Moody rising faster than most (likely related to higher industrial land use and resultant industrial tax “windfalls”); the small communities (Anmore, Bowen, Lions Bay, Belcarra) all seeing recent significant rises since ~2013 (I would suggest they are coming to grips with infrastructure renewal costs they cannot offset with growth); Vancouver bucking the trend a bit, and the rest of us pretty tightly clustered together. If there are reasons for municipal tax increases, they don’t seem to track with politically left or right councils, rich or poor cities, or any imagined east-west or north-south divide.
Using the same BC Government Schedule 707 tables, you can look at how each city has changed in the 15 years between 2005 and 2019. There are three related growth numbers I think are fun to compare: population, value of residential land per capita, and the residential taxes collected per capita: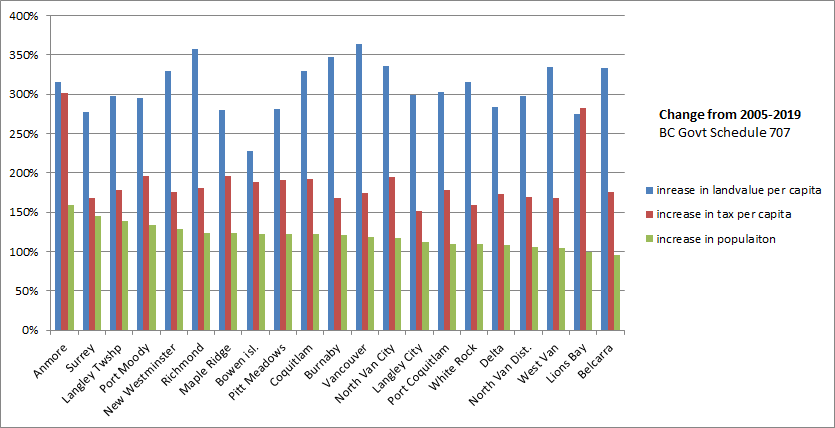
For the fun of it, I sorted this data by the rate of population growth. Despite what I said just two paragraphs ago, you can see Anmore was the surprisingly-fastest growing municipality over that 15 years increasing by 57%, even faster than Surrey. New West population rose 29% over that time (from just under 60,000 to just under 77,000), which makes us one of the faster growing communities. Lions Bay and Belcarra both lost population over this time. This chart, however, doesn’t show any clear trend relating the rate of growth to the rate of property value increases or tax increases.
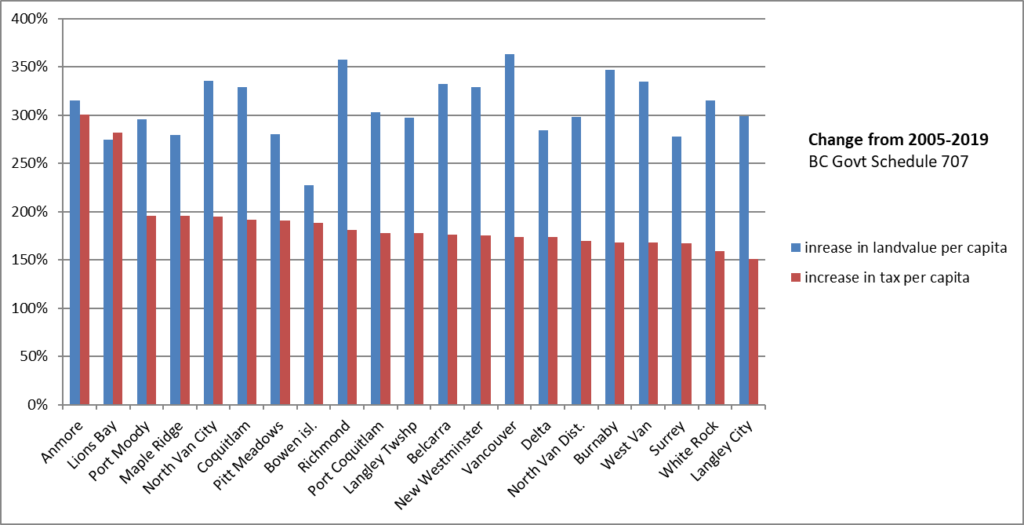
This second view is the same data, but sorted by the increase in residential property taxes per capita. New Westminster is slightly below average in increase, as the per capita tax rate has gone up 76% over 15 years, compared to 78% for the average municipality (a tie between Langley Township and Port Coquitlam). New West residential land values have gone up quite a bit more than the average, though. In 2005, there was $84,000 worth of residential property per person, in 2019 that number is $276,000 – more than a tripling in value.
Just for the fun of it, I did the math to create a totally meaningless idea. If there was a (statistically-unlikely) person in New Westminster who owned a proportionate value of land for those 15 years, they would have paid about $7,700 in property taxes over that time, and earned about $192,000 in increased land value. Of course this is only property taxes to the municipality, not to the province (School taxes) to regional government (GVRD taxes), and doesn’t include the fee-for service money the City collects for utilities. Still, I think it argues against the sometimes-proffered idea that municipal taxes have been a significant driver of housing affordability challenges in the region over the last decade and a half.