It’s been a while since I saw this kind of comparison, but it is circulating on local social media again, seeming to point back at some politicking by a certain group who obviously know the truth, but have little interest in honest discussion, preferring to ask leading questions instead of seeking seeking answers when they have just as much access to all of the data as I do. Here is the graphic: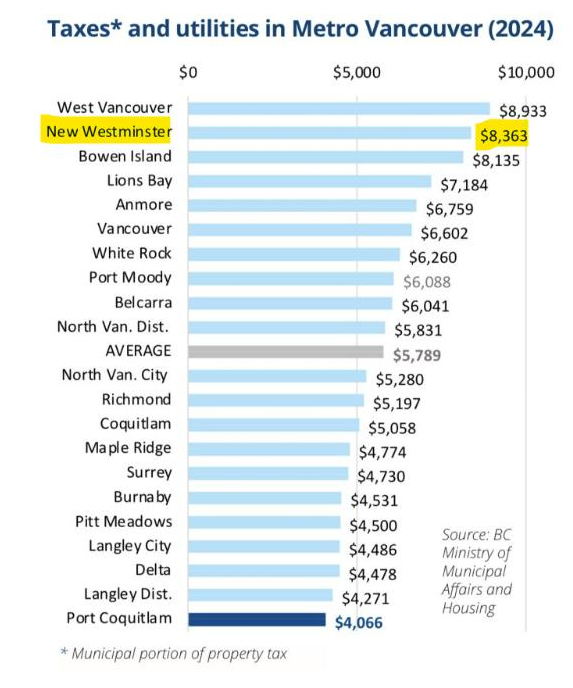
There are two problems with this comparison, which was generated by the City of Port Coquitlam for their own political reasons.
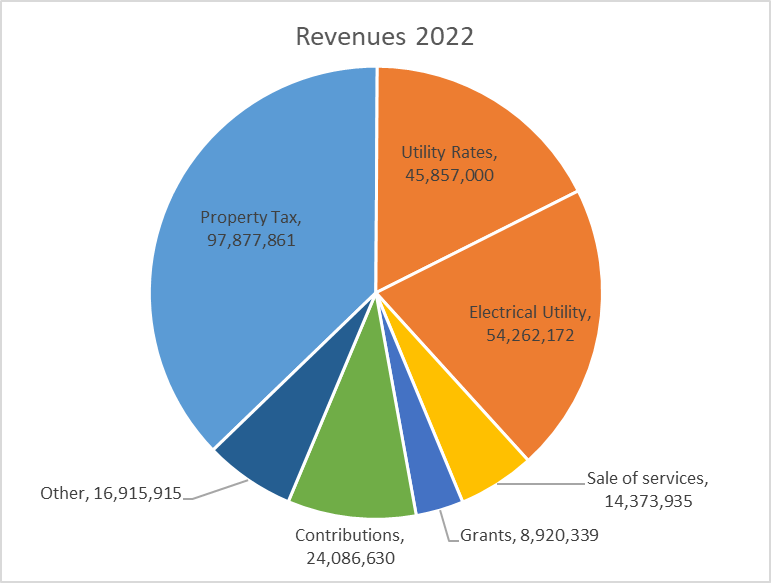
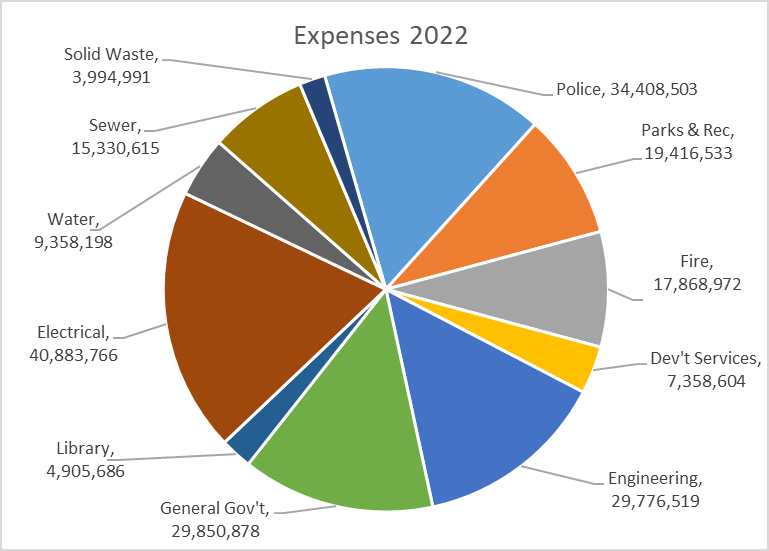
One is that the numbers include electrical utility charges collected by New Westminster because we own our utility, and does not include household or business electrical utility costs for any other municipality (because they buy their power from BC Hydro). I call this zombie data because every time this bad comparison rears its head I knock it back with the facts, but it gets back up and starts grunting again. Like back in 2018 when the Fraser Institute did the same lazy comparison, somehow claiming we had the second highest taxes while the very same report showed New Westminster having the 12th highest taxes of 17 municipalities in the Lower Mainland.
Then the story resurfaced three years later with another FI news release where they compared revenue and spending between cities. The fun part this time was digging into the data that the FI used and (after removing electrical revenues and spending) seeing that New West’s spending (the services we deliver to community) are higher than the regional average, but our revenue (the money residents and businesses pay for those services) was lower than the regional average. You would think the folks at FI would appreciate New West delivering more for lower costs. The FI also had a chart showing New Westminster spending increases for the decade were among the lowest the region. So thats good news?
Follow those links to see the data, with links to the sources! As we all learned in math class: it is important to show your work!
The second problem with the graphic above is that the chart is the “tax on a representative house”, not tax on the average or median household. That is the average single family detached house, which in New Westminster is estimated (in 2025) to be about $1.6M. But in New Westminster, we have one of the highest proportions of renter households (45%) in the region, and the vast majority of New Westminster households are in multi-family. This means the average residence is closer to a $700,000 condo that would pay half this amount of tax and much less in utilities. Taxes on a “representative house” does not reflect the typical tax or utility bill here.
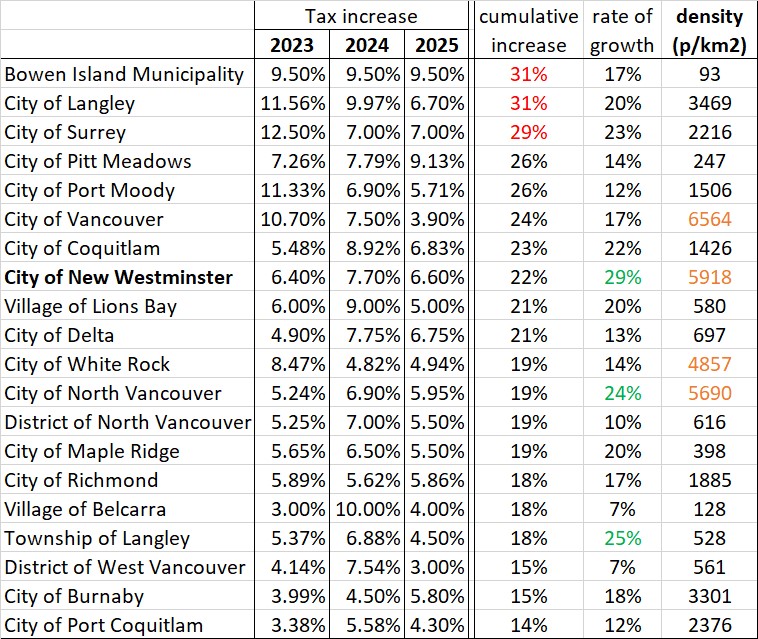
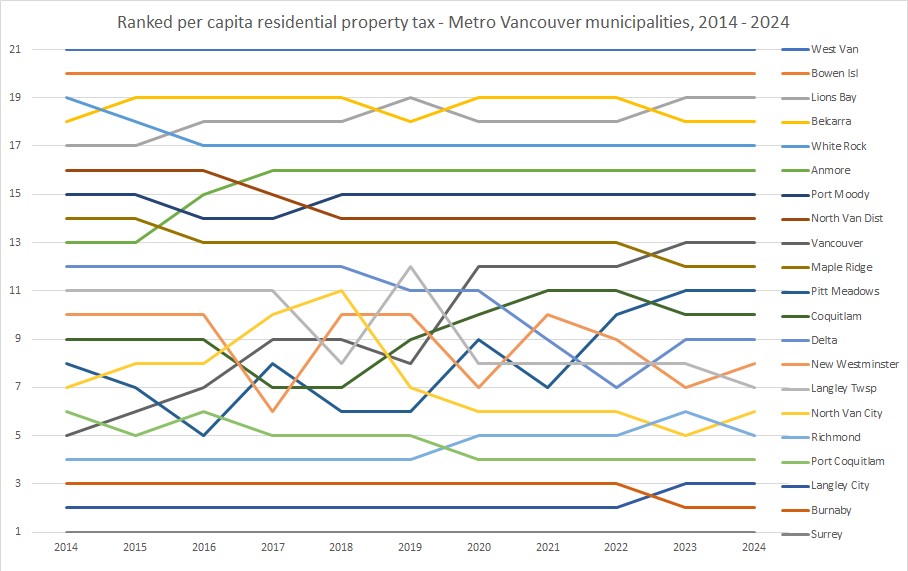
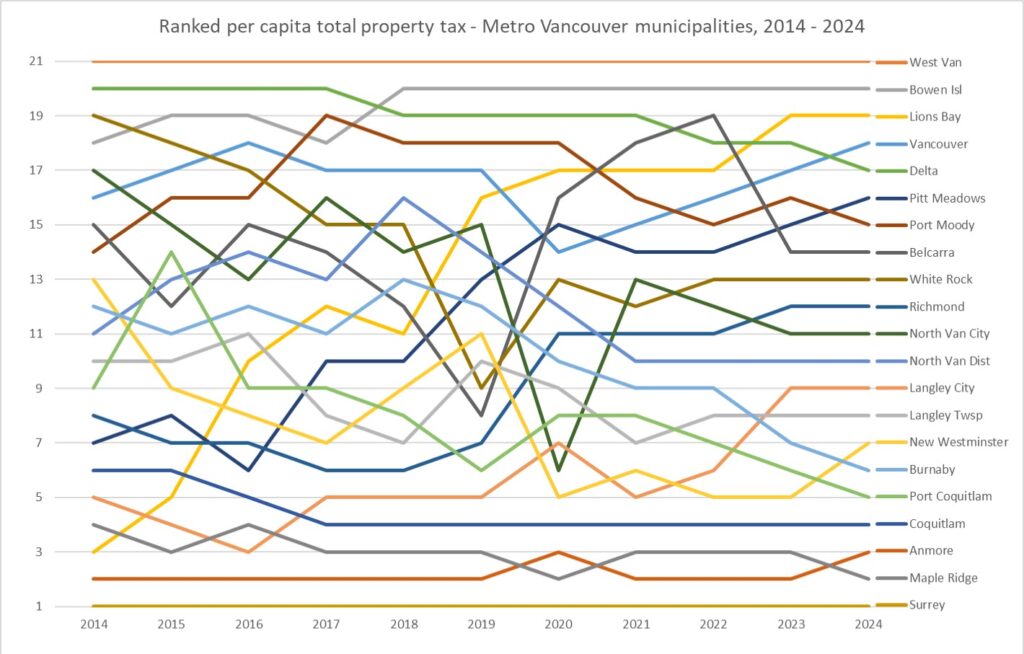
The numbers on this chart come from some massaging of Provincial government stats reported out as “Schedule 704” which you can read yourself here. If you don’t want to click through an download the spereadsheet, I have extracted the part of the table that is only Metro Vancouver municipalities (as our tax regime is different here than the rest of the province, due to TransLink and the fact we don’t pay Hospital tax as they do elsewhere). I also used the 2004 table, not the more recent 2025 one, because the graphic above uses this 2024 data:
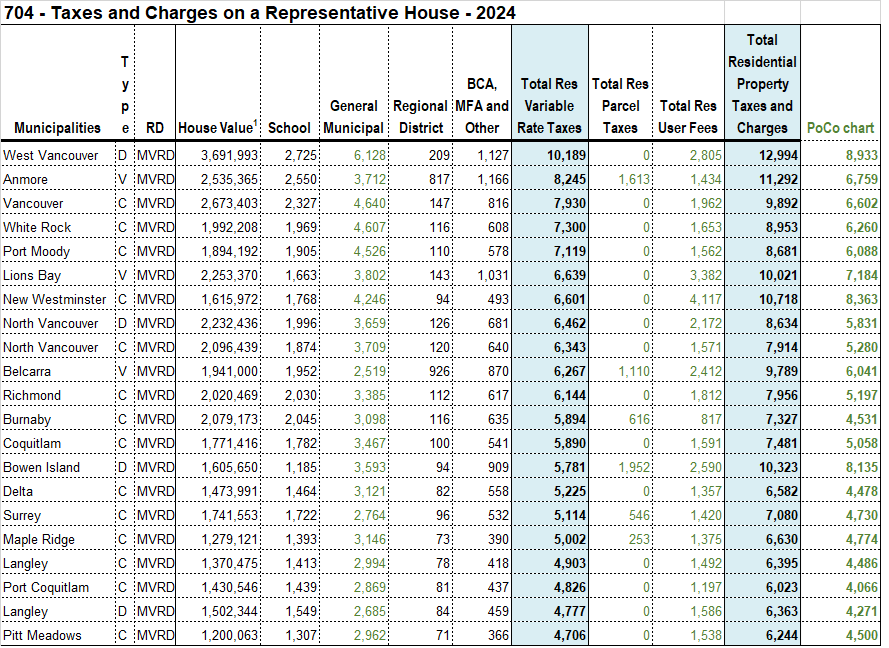
I highlighted in green the numbers that PoCo used in that chart above, and added a column summing these up to show how PoCo came to their conclusion. Naturally, they chose the comparison most generous for their purposes, not including all the taxes and fees people pay, after all, PoCo is not the lowest taxed city even in this flawed comparison.
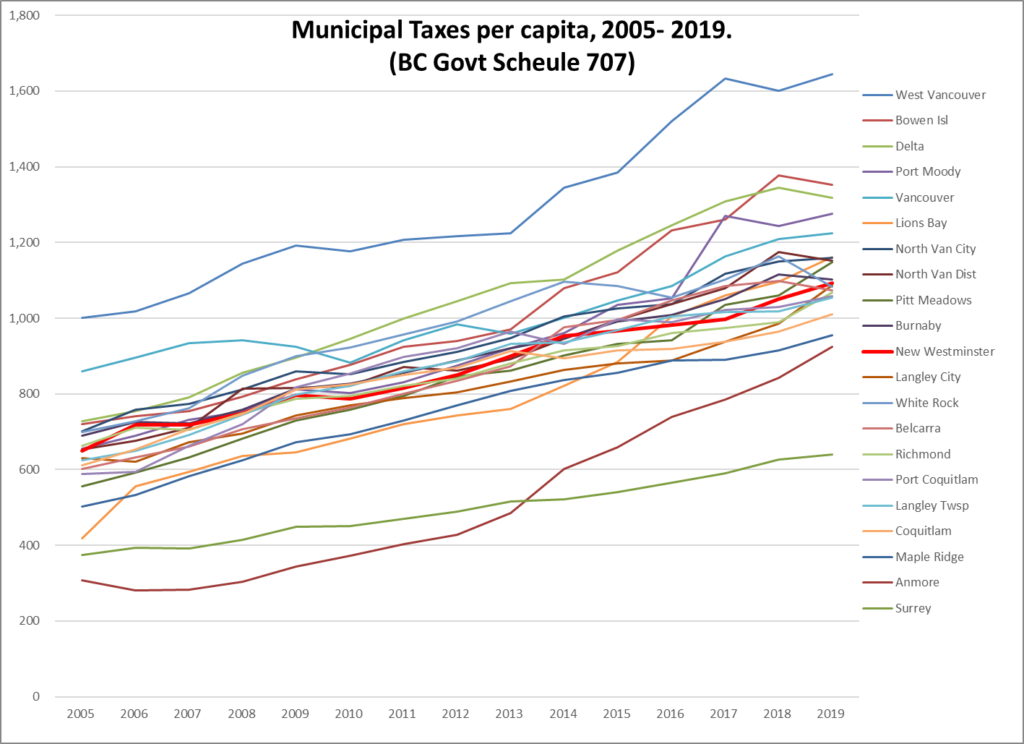
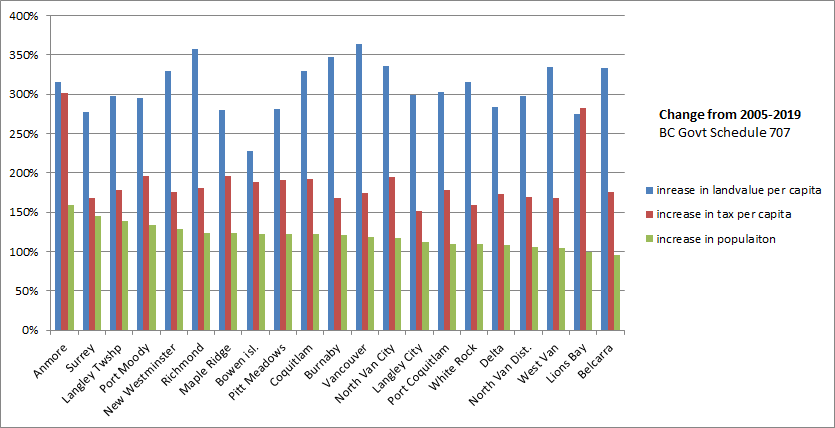
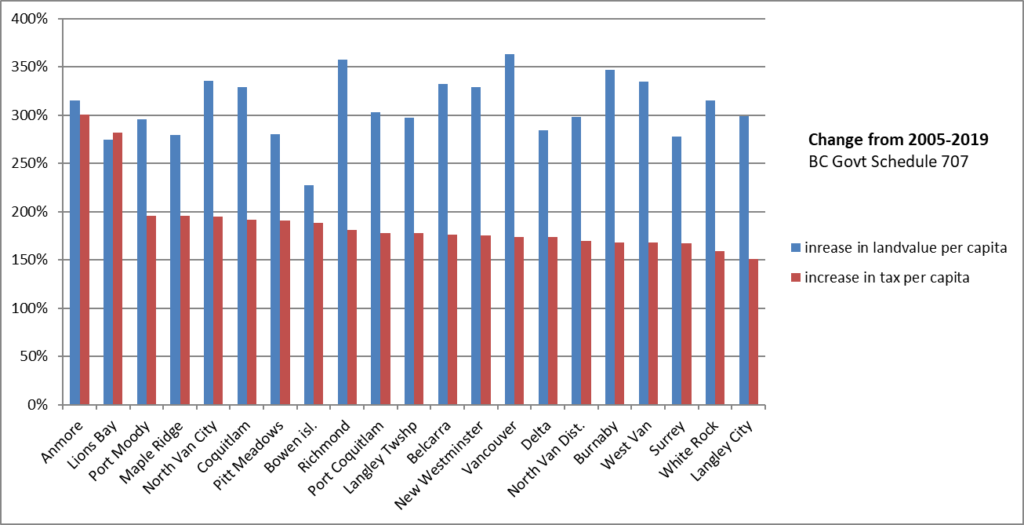
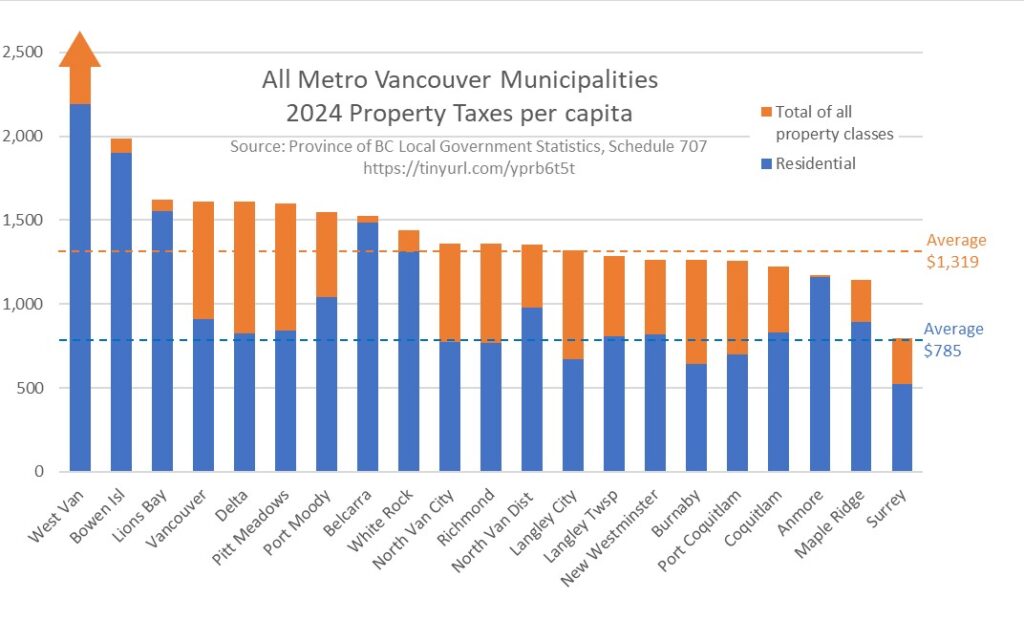
In my mind (and you may disagree) the more fair comparison is the taxes per capita, because ultimately people pay taxes not houses, and people receive the services that the City pays for with its taxes. I explained this a bit more here (again, older numbers, but comparison still fits), with an update with 2024 numbers displayed in a different way here.
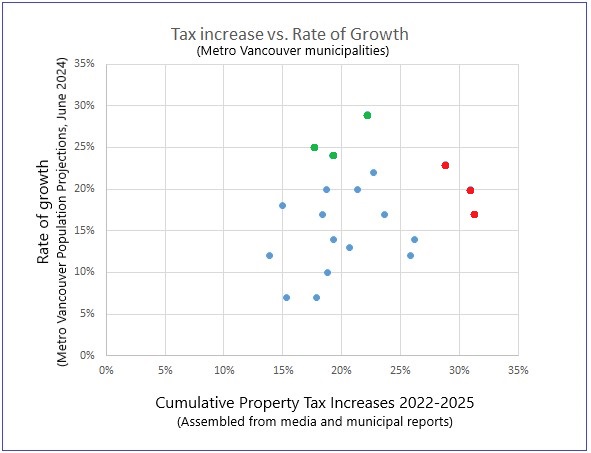
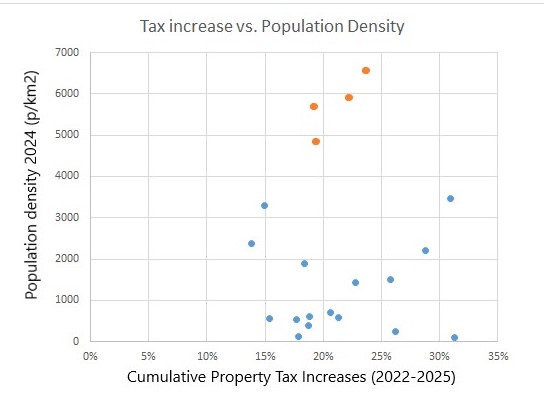
In short, and I know there is a lot here (remember Brandolini’s Law), most apples-to-apples comparisons show New West is about average of the region for property taxes people pay both per capita and per household, and over the last few years, our annual increases have been slightly below the regional trend. Spread the news.
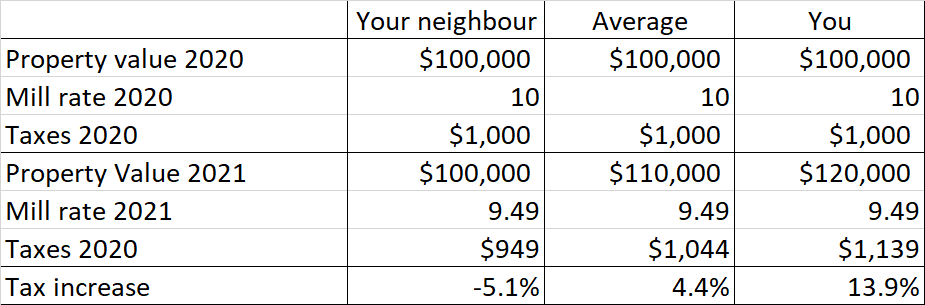
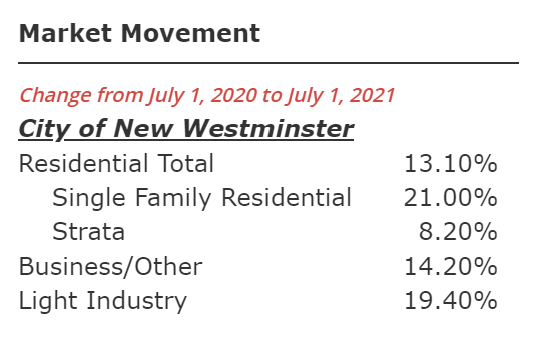 All residential properties went up 13.1 %, but Single Family Detached houses went up more than this (21%) and Condos went us much less (8.2%).Since tax increases are based on the average value, this means taxes will be going up more for most SFD, and less for most Condos. Indeed, at the current proposed rate, the average Condo may not see any increase at all.