For those who were paying attention, the City of New Westminster’s new 5-year Financial Plan just went through public hearing, and passed three readings at Council. After months of work, several reviews by Council, and a not-terribly-exciting public engagement process, the Bylaw that supports the Plan will likely be adopted by Council this Monday.
But we really haven’t talked about it as a community. When you measure column inches in the local paper, hours of council delegation time and discussion, or conversation at coffee shops and pubs, Parkades and Lancers have by far outstripped this. Which is probably not good, as this is arguably the most important thing Council ever does – scheduling the spending of your money.
We, as a City, need to have a better conversation about this, and I hope the Mayor’s Public Engagement Taskforce can figure out how to make this issue front and centre in the City’s conversation for the next budget cycle.
It’s not like people in New Westminster don’t talk about taxes. It comes up every local election, and there will be a few letters to the editor complaining about the increase approved this time around. There was even a Facebook page that *mysteriously* popped up during the last election all about the untenable tax situation in New West. The general opinion is that New Westminster is either one of the highest-taxed communities in the Lower Mainland, or the highest. This spectrum of opinions is only partially true.
A few years ago (long before Council was a glimmer in my eye) I wrote a series of blog posts on taxes in the City compared to the rest of the region. I wanted to understand where we stand and wanted to cut through the rhetoric. I talked about what a mil rate really is, I expanded by talking about how that compares to actual taxes you pay based on typical house values, and for the fun of it, threw utilities into the mix. My conclusion at the time was that we were not the highest-taxed community in Metro Vancouver, but somewhere in the middle. As a general rule, people north and west of us paid more, people south and east paid less.
Now I have a new role, and although I do not agree with the opinion that taxes are “out of control” (as people continue to ask for the services that taxes provide), I do think I need to be more cognizant of how the tax system in the City relates to other municipalities with whom we compete for businesses and residents (with taxes being only one of the many factors that influence location choices for both of those).
So I started to gather data on taxes from various Cities’ 5-year Financial Plans. However, if you start to search through them, you quickly realize the varying ways financial statements are presented in the published plans. For fun, compare recent 5-year plans of Burnaby and Port Moody.
Fortunately, local governments are required to make disclosures to the provincial government every year, and through that process, a standardized set to statistics are collected. You can read them here. I’m not saying they are the perfect Stats to evaluate whether we get full value for our taxes, but it does give us a level playing field through which to compare New Westminster to our neighboring jurisdictions. And comparison, I will do.
This first graph below shows what a typical household should have paid in all property taxes to their municipality in 2014, and breaks it up by different categories. The number on the top of each column is the assessed home value deemed “typical” for that community by the province, and the value used to calculate the tax amounts based on mil rates.
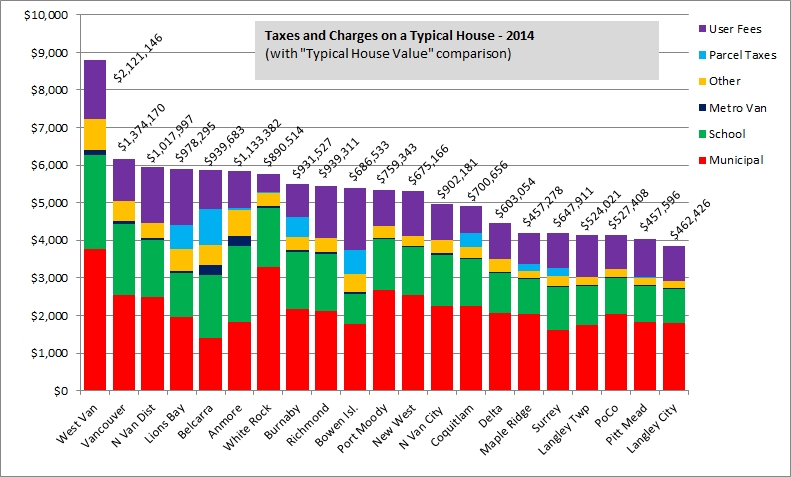
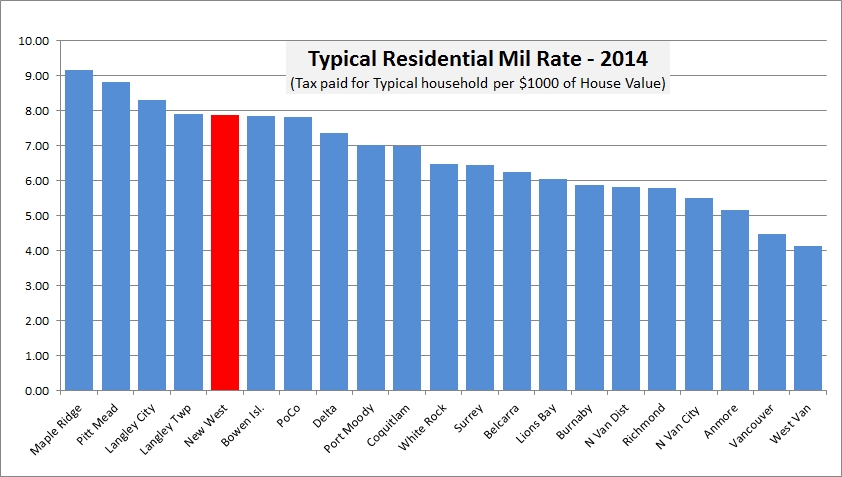
By this analysis (and this is the province’s data, not mine), the typical New Westminster residential property tax bill is the 12th highest of the 21 municipalities in Metro Vancouver. Obviously, a huge driver of this placement is that New Westminster’s “typical” $675,000 home value is below average (14th of 21) and our Mil rate is higher than typical (5th of 21, but in a virtual tie with those that are 4th through 7th):
Recognize, these are averaged numbers, the Mil rate multiplied by the “typical” value. What about what people actually pay? You can calculate a “True Mil Rate” paid in a City by taking all of the Property Taxes collected by the City (in New Westminster in 2014 that was a bit over $65 Million) and divide it by the assessed property value of all taxable property in the City (in New Westminster, that number is just north of $12 Billion), then divide by 1,000. That makes our “True Mil Rate” about 5.32, which is the fourth highest in the region:
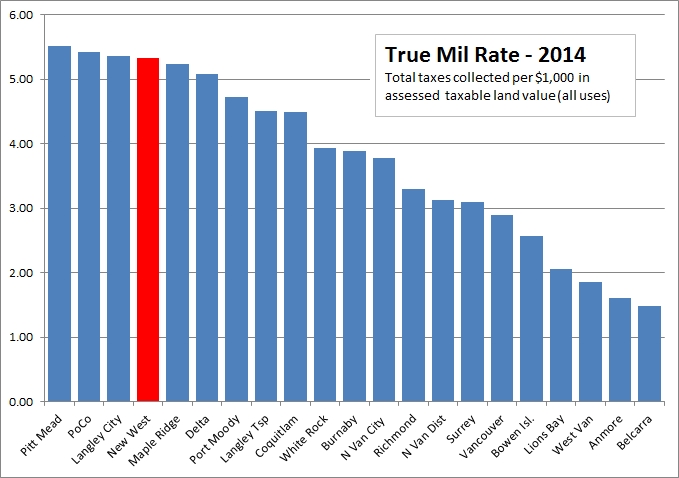
Note that municipalities with low land values cluster towards the left side of the graph, and higher-land-value places cluster towards the right, so this graph more displays relative land value than it does level of service provided or efficiency of the operation of local government.
Up to now, we have only been looking at taxes as compared to land value. Land doesn’t pay tax, people do. So it might be more meaningful to look at how much tax we pay per resident in the City. Lucky, the same provincial data provides population estimates by municipality projected from the 2011 census to 2014, so that is also an easy comparison to make. Here, again, New Westminster is up in the top quarter, finishing 5th of 21 municipalities.
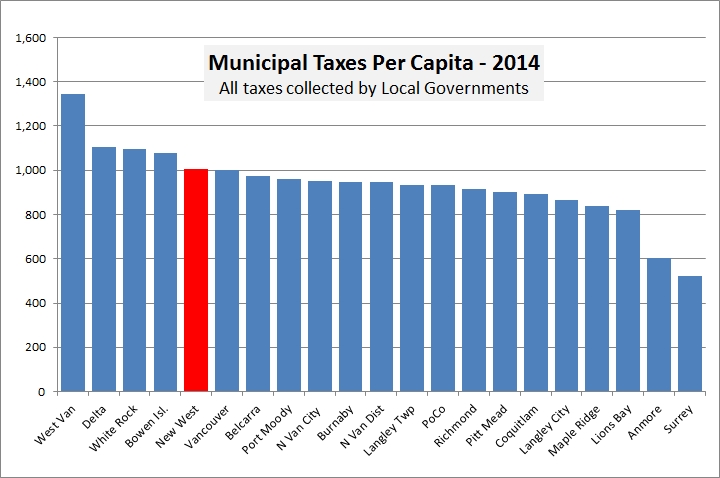
However, the comparison here is (yet again) not fair, because all taxes are not paid by residents. Businesses and industry also pay property taxes. The Province helpfully divides out local government tax revenue by land use, and if we limit the comparison of residential property taxes paid per resident in their municipality, we see that New Westminster falls back down to the middle – coincidentally 12th place among 21 municipalities:
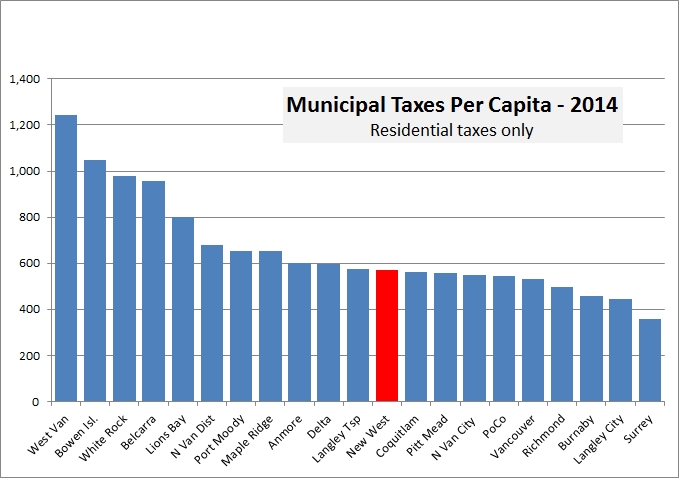
I say coincidentally because although New West finishes 12th in the first and last graph here, none of the other 21 municipalities fall in the same location on both graphs. There are many ways to look at the numbers, but by various apropos analysis, New Westminster residential property taxes are pretty much in the middle regionally. Our $572 per person in 2014 puts New Westminster well below the $660 regional average, and essentially equal to the regional median of $573 represented by Langley Township.
So why do some graphs show New West so high? That has to do with how we use our land in New West, and how we tax residents, businesses and industry differently. To see more analysis of that, you will have to stay tuned for Part 2, coming soon.
I’m guessing that most people who love wine pay more than $572 per year for their enjoyment. When I see what $572 buys me in New Westminster – I mean the things that I use like the roads, utilities, the gardens, sewers – I consider that I get a bargain. And when are we going to start the conversation that paying taxes is not such a horrible thing? If done properly amongst all levels of government, it should be a low cost way to get great service and needed programs for all of us.