It must be an election year.
The right-wing public-services-defunders the Fraser Institute are putting out the same flawed anti-government “comparison report” that they put out last election. And the election before. There is nothing new here, and instead of writing a new post, I should just provide those links to the previous posts from 4 and 8 years ago about their factual challenges, and leave it at that.
What’s different this year is that a local right-wing public-service-defunding political party is breathlessly aping the latest Fraser Institute report, and goes a step further by cherry picking the parts that make New Westminster look like spendthrifts (without acknowledging the flaw in the comparison, of which they are fully aware) and blithely ignoring the parts of the exact same report that show New Westminster’s spending increases over the last few years being among the lowest in the Lower Mainland.
So here I am cleaning up the same bullshit, third election in a row.
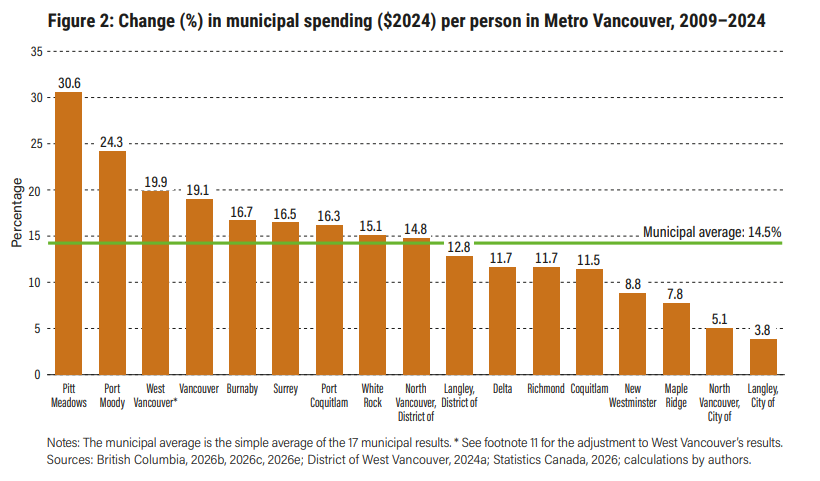
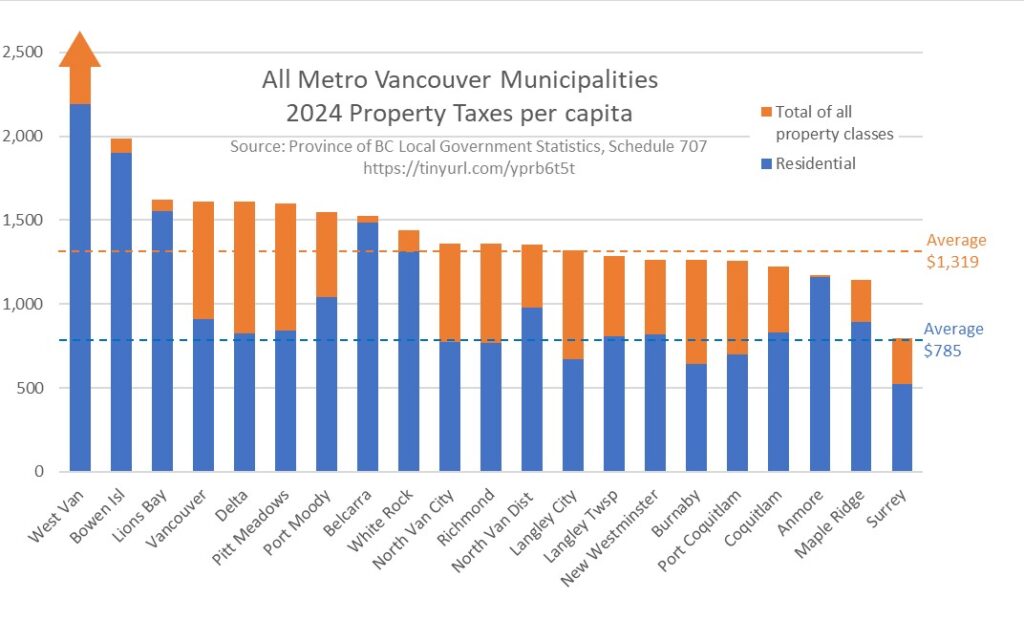
At the centre of the report are two charts. Here’s the first one:
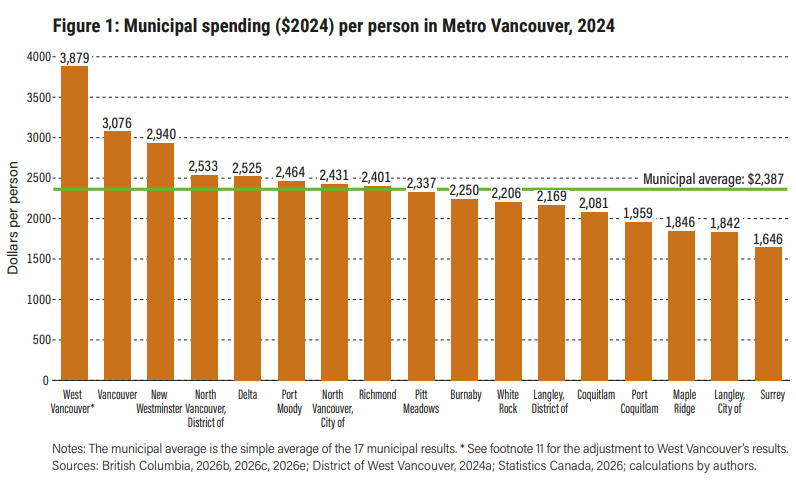
It shows new Westminster “spending” among the highest per capita in the region. Because it’s the Fraser Institute, they don’t actually show their math at how they got to this number, so I followed the links to their sources (Government of BC tables you can see here) and tried to reproduce their math. Turned out this was easy because I assumed they did the single laziest thing that a person with zero training in economics would do, (take the “Total Expenses” number from Column R of Schedule 402, and divide by the 2024 population estimates) and surprise, I got the same numbers as the Fraser Institute. Good work, guys.
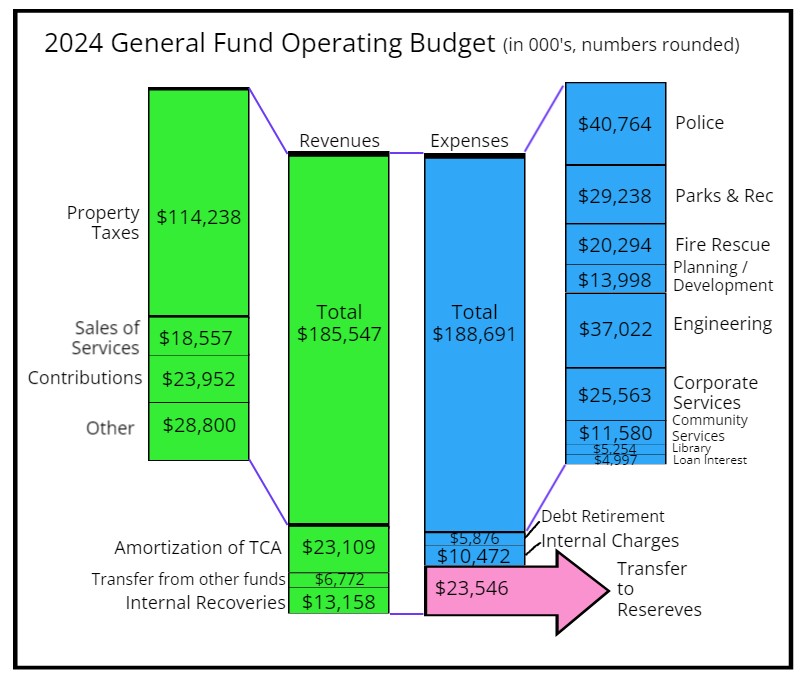
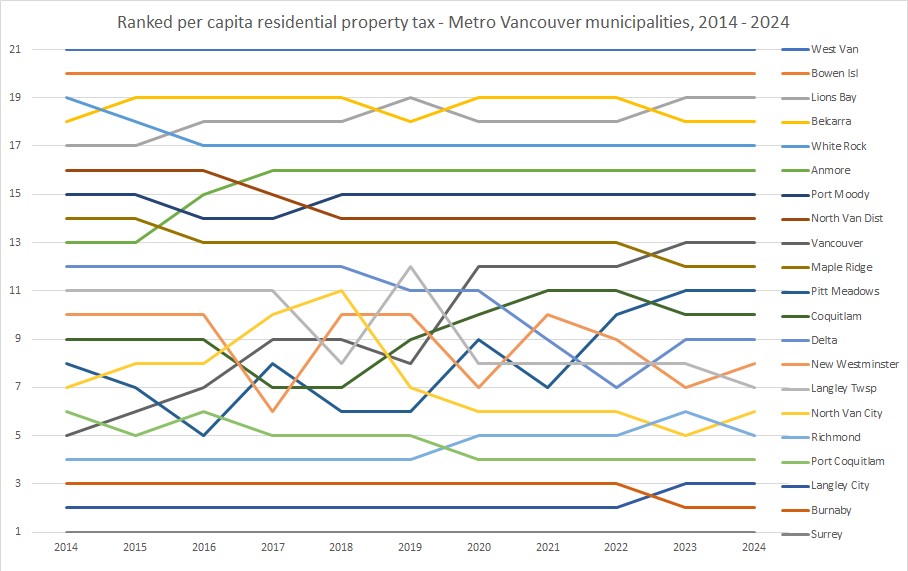
Except for West Vancouver, where the number I got was much higher ($4,393). The Fraser Institute explain this by mentioning that West Van operates the Blue Bus, a transit service West Van operates for TransLink, they reason it is only fair to remove it and make the comparison “apples to apples”. What the FI fail to mention is that New Westminster operates an electrical utility, unlike any other City on the list, and it would also be fair to remove that number. (Yes, I let FI know about this back in 2018, and they did it again in 2022, and now a third time. These guys are persistent in their laziness!). If one removes the $49 Million in annual “spending” by our electrical utility, New Westminster’s “spending” per capita starts to look very average:
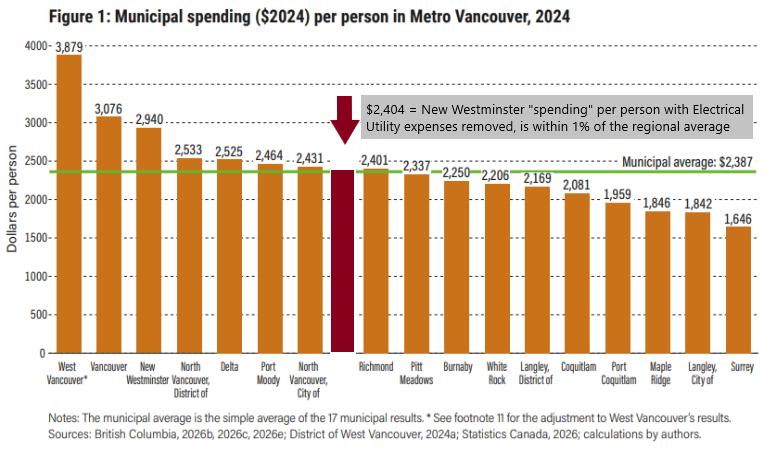
But “New Westminster Spending about average” isn’t a headline for flame post on Facebook, is it?
(I have a bunch of other problems with this chart, but they all fall under *too much detail* so I’ll stick them in a footnote below)
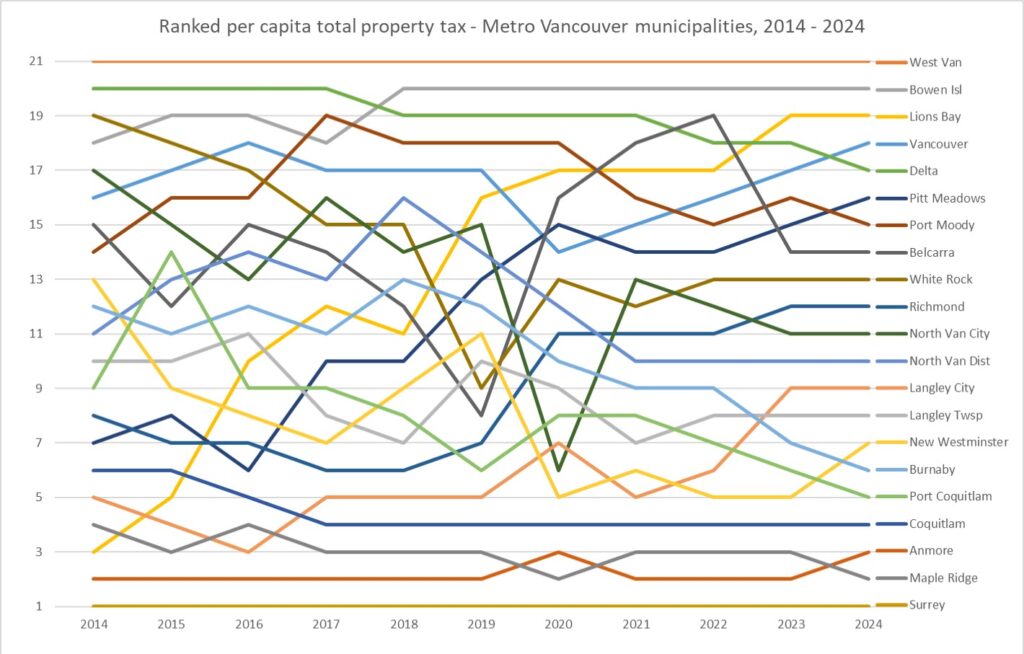
The report includes a second chart that our right-wing public-service-defunding friends over on Facebook didn’t call attention to, because it didn’t fit their narrative, and it is this one:
Yes, even by Fraser Institute’s flawed methodology, New Westminster’s increases in spending are among the lowest in the region over the last few years.
They make the same simple mistakes with their Revenue charts (exempting West Vancouver’s Blue Bus revenue, but not New Westminster Electrical Utility revenue) and, just like 4 years ago, when an apples-to-apples comparison is done, New Westminster’s revenues are still below the regional average and our revenue increases over the period are much below the regional average.
So in summary, the Fraser Institute are still bad at data, don’t understand (or care to understand) basic economics, and should be furiously avoided, not uncritically posted on your Facebook page, unless your goal is to launch an uninformed flame war as part of your right-wing public-services-defunding strategy.
FOOTNOTE:
Other problems: By pulling the simplest single column from the Government statistics, they introduce a bunch of flawed ideas that would shame a first year economics student. The number they chose includes amortization of capital assets, asset retirement obligation accretion, and loss on deprecation of assets. These are not “spending”, these are accounting items that help rectify capital budgets, and these numbers may shift dramatically year-by-year because of a large asset (such as a new pool) being brought into operation, or being retired from operation, and aren’t reflective of long-term trends.
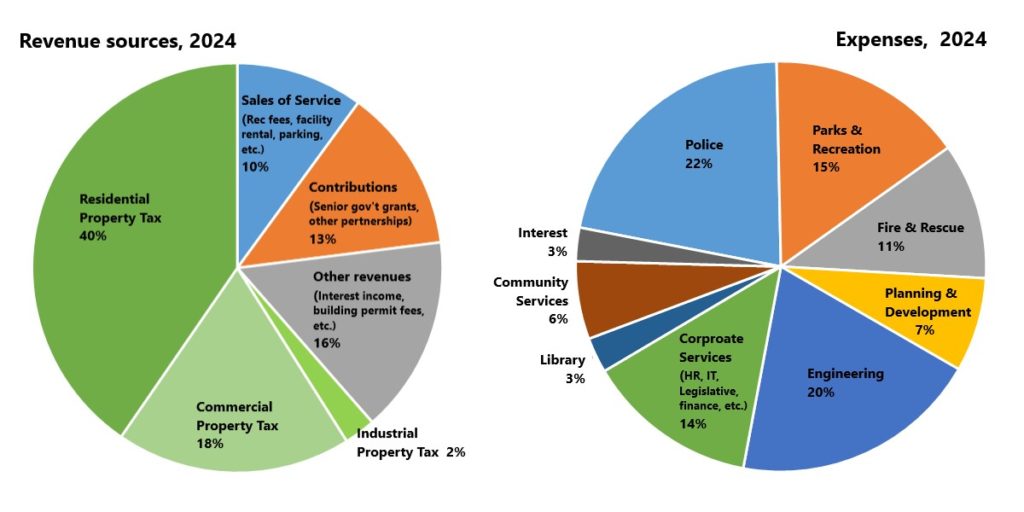
Both “spending” and “revenue” are not put in to the context of where the money comes from. If a City receives a significant grant to operate a service (New Westminster’ $11 Million Housing Accelerator Fund grant, the $2 Million we received to run the Crisis Response Pilot Project, etc.) it is lumped in with everything else, despite it actually being local services provided to benefit New Westminster residents without costing local taxpayers money. Why do they want to shame cities for receiving senior government grants to provide local services?
Both “spending” and “revenue” lump fee for service and other non-tax revenue in as well. If the city decides to take a stronger enforcement position on traffic laws, and draws more revenue, both the cost and the revenue draw counts. If there is a building boom, then we receive more permit fees, and that pays for the staff to manage that permitting, but both show up here as harmful spending. If we open a new pool that doubles the number of resident swims per year (as New Westminster did) those pool fees and the operations they help offset are seen as harmful “spending” and “revenue, not as essential public services being delivered. If New Westminster was to attract a new business that employs 100 people and uses a lot of electricity, that would benefit New Westminster residents (jobs, higher electrical utility dividends) but would add to both the “spending” and the “revenue” seen here. Why do they want to shame local governments for collecting fees for local services?
The questions are rhetorical, as the answer is always that they are right-wing public-services-defunding Koch-brothers-funded misinformation agents. See this. And this. And this. And this. We could go on all day…
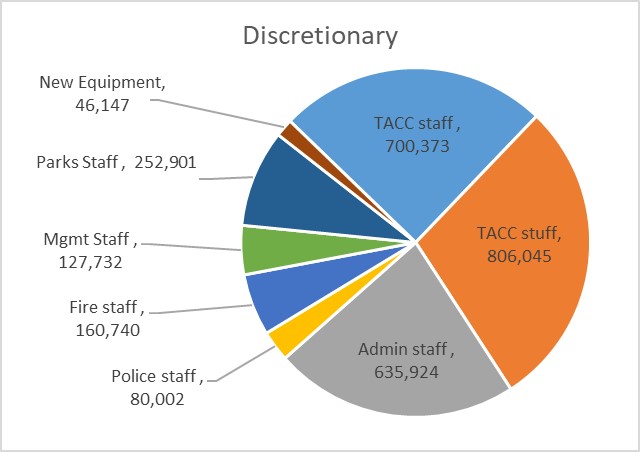
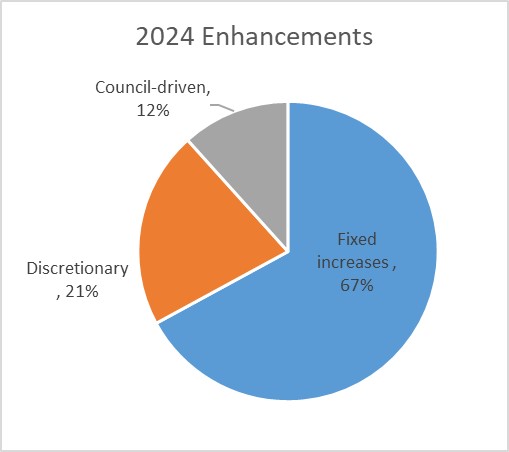 First off, two-thirds of this increase is fixed cost increases, increased costs to deliver the same services we provided in the previous year and things that we are legally or contractually obligated to pay for. About 21% are “discretionary” increases recommended by staff, things we are not legally committed to, but are required to keep service commitments we made to the community. The last 12% are things Council has directed to staff that we want to see happen in the upcoming year. Each of those three can be broken down further:
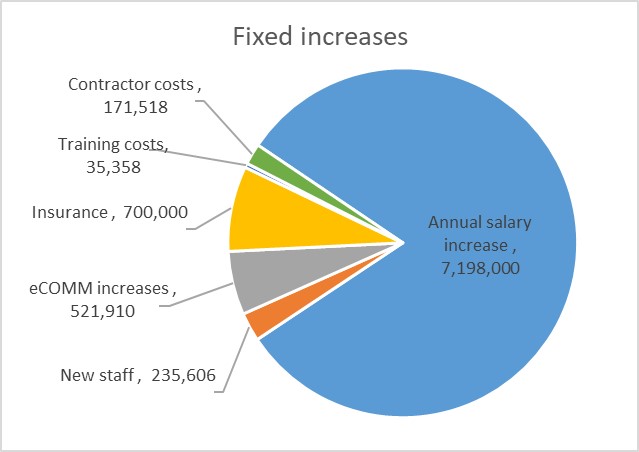
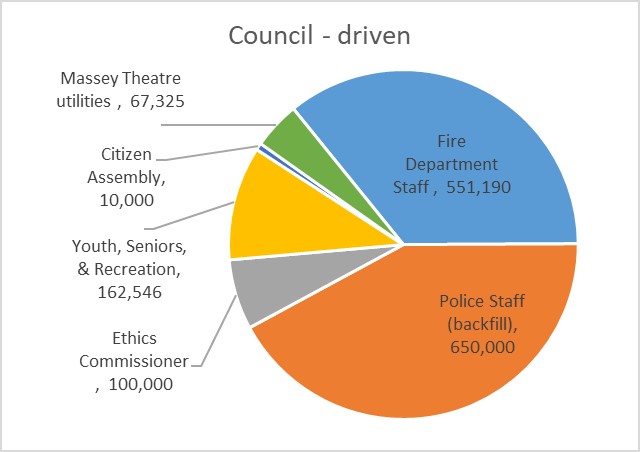 The Council-driven increases are things Council directed to be added to the base budget, mostly in that December workshop. Most of this is in Public Safety, with increased Fire Department staff and new staff for front-line Police to address backfill (that is, we are not increasing the compliment of sworn officers, we are hiring more to provide better coverage for vacancies, sick and parental leave, etc.). Our new Code of Conduct requires budget for an Ethics commissioner, we are augmenting some staff positions to support youth and seniors programming, and the Massey Theatre utility costs are higher than anticipated.
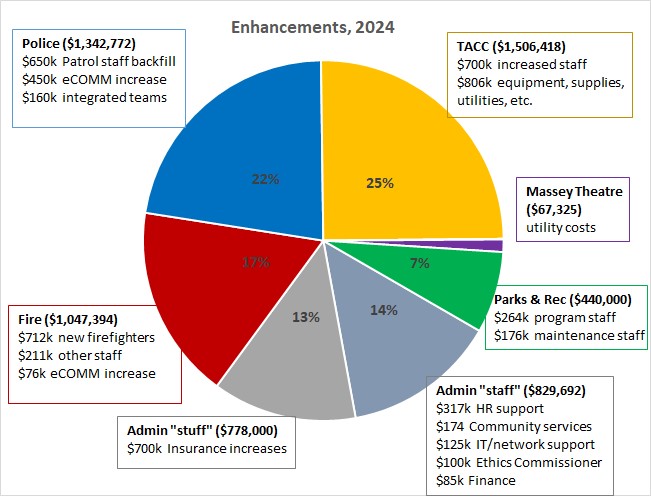
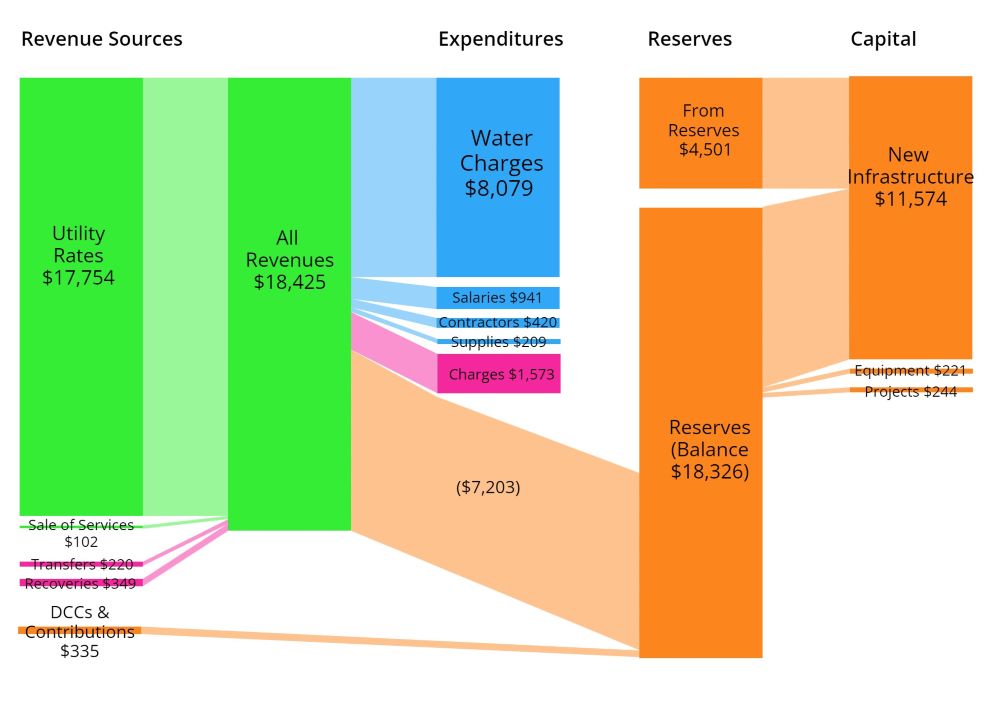 Again, our main source of revenue is utility rates, and the DCC/contribution part is much smaller in water this year. That has mostly to do with the timing of capital projects and our success at getting senior government grants for sewer work more than water work. Of the $18.5 million we take in, about 44% goes directly to Metro Vancouver to pay for the water. We spend less than 10% of our budget on operations, though with internal charges (the money other city departments charge the water utility for services), this cost is a bit higher than in sewers.
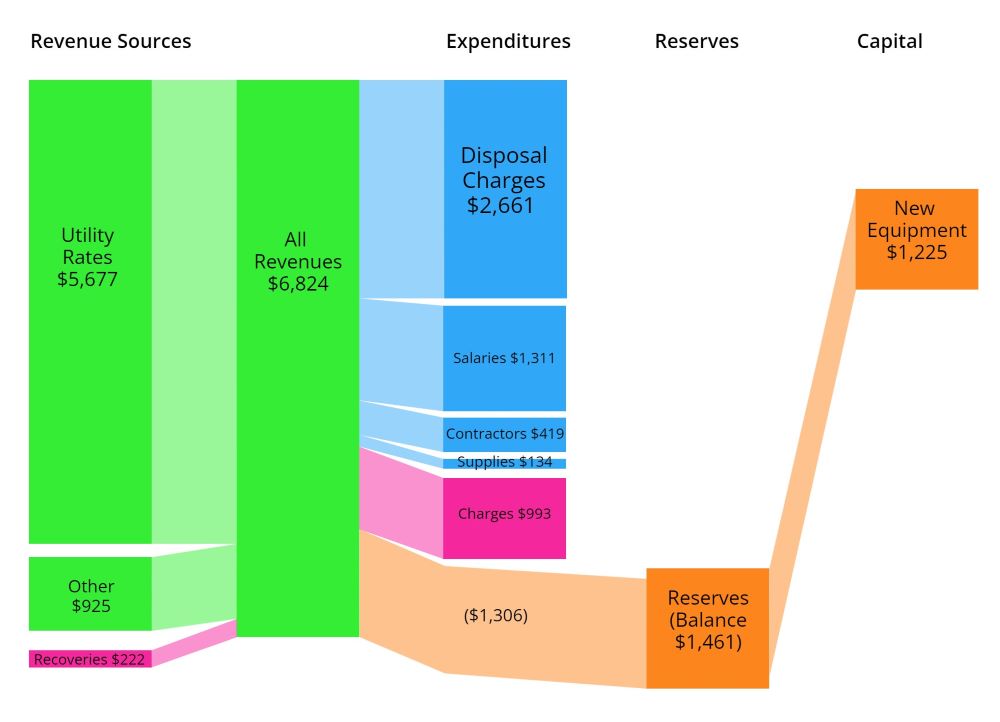 Garbage and recycling are bit different than the other utilities, as the level of service provided to different parts of the community (house vs. strata, home vs. business, etc.) varies quite a bit, and although disposal charges handed down (mostly from Metro Vancouver) for taking in our waste still eat up almost 40% of all of our revenues, there is a much larger operational cost to solid waste. We need staff to drive those trucks and fuel for the trucks, because you can’t put your trash in a pipeline.
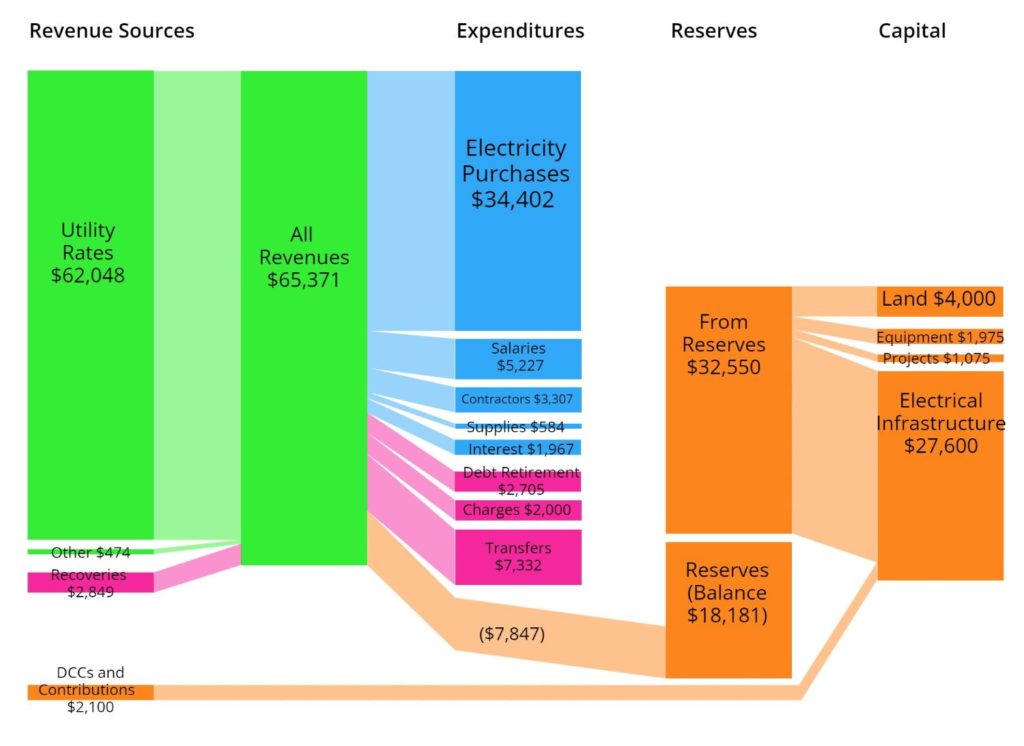 Our Electrical Utility has a few unique aspects, but it functions like the other utilities we have. The electricity we purchase at wholesale from BC Hydro costs us just over half of our overall revenues, and the cost of day-to-day running of the utility costs about another 17% (or a little over $11 million). This leaves us with about a third of income that goes into our Capital Reserves or directly to the City as transfers. The transfer number here is large because it includes the dividend the City takes every year from electrical utility operational surplus and puts it in the general operational fund. This amounts to about $6 million that the City uses to offset property taxes in providing services that we otherwise wouldn’t be able to deliver.