Monday’s meeting featured a Public Hearing. Two actually. This is something the City doesn’t do as much anymore since the Province changed the rules and limited our ability to hold them for routine rezoning applications. These OCP and Zoning changes were not routine, however, but represented a big step forward in housing variety and affordability in the City. So Public Hearing we go.
The full Public Hearing Reports are here, and there is much more info available here about the 18 month process that got us here, which doesn’t all fit in the Agenda. In this report I will try as best I can to stick the facts, and save most of the (good and bad) politics of the meeting for my Newsletter (Subscribe here if you want to read that stuff).
Public Hearing 1: Integration of Provincial Housing Legislation
Our First Public Hearing addressed three separate Bylaws:
Official Community Plan Bylaw No. 7925, 2017, Amendment Bylaw (Provincial Housing Legislation Integration) No. 8522, 2025
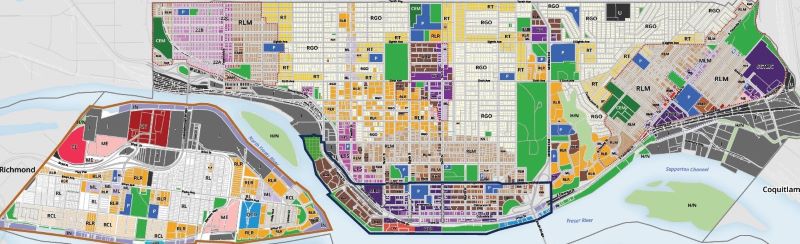
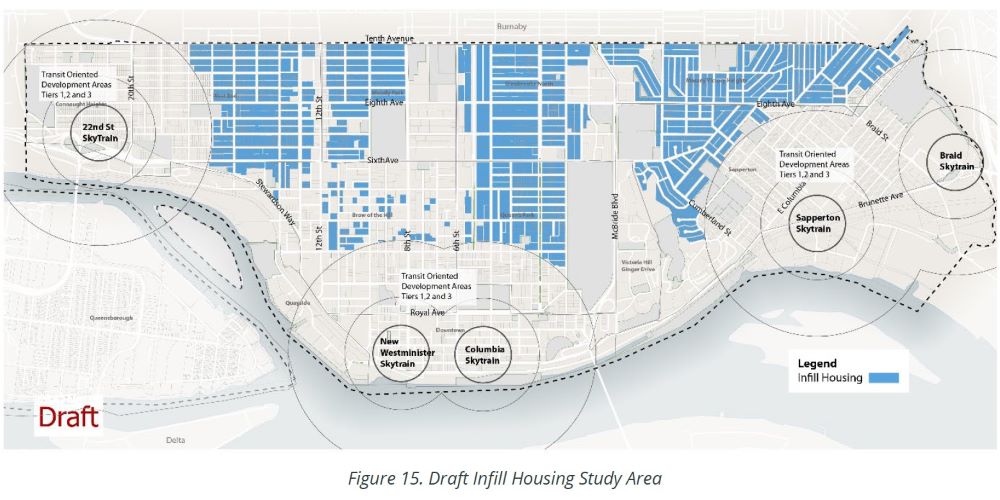
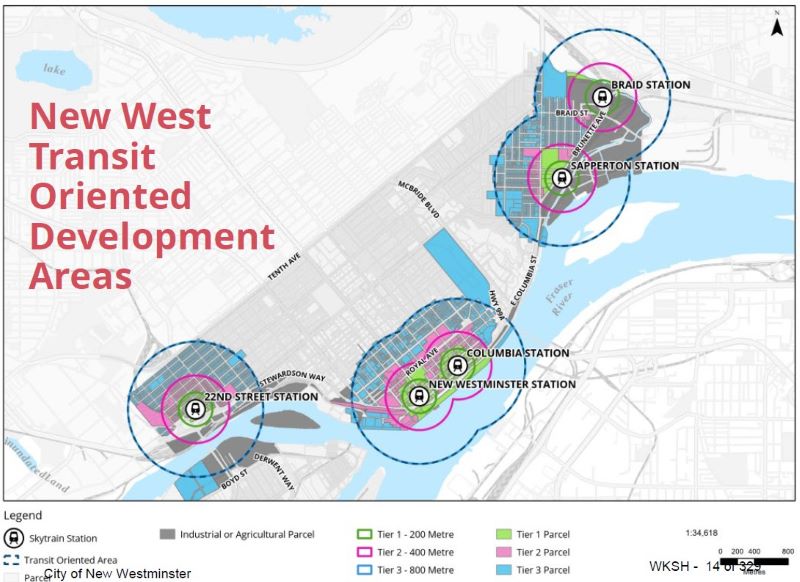
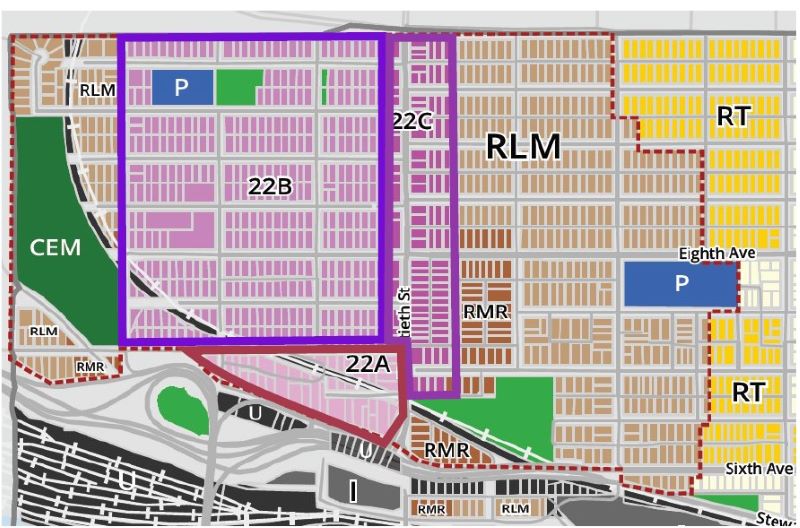
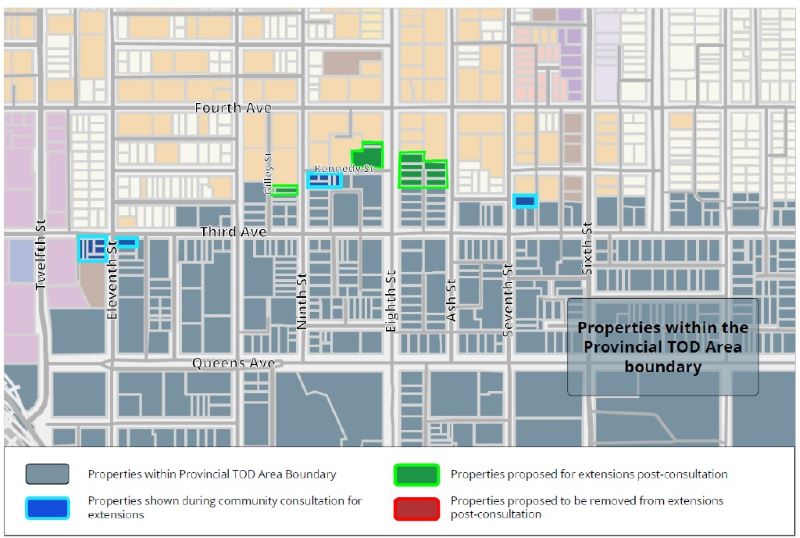
This change to the Official Community Plan related to Transit Oriented Development (TOD) that creates new “Land Use Designations” within the 200m, 400m and 800m buffers around SkyTrain Stations that meet the requirements of the Province’s “Bill 47” (which I wrote about here when it came out). There is quite a bit of detail in here about how we integrated these into our existing Official Community Plan, and I am comfortable in saying this is a made in New West approach and not the one size fits all approach that some other communities have been bemoaning. The most obvious example being that this does not apply to the TOD areas around 22nd Street Skytrain station, as that area is already going through an OCP update process, and will require extra technical work to address infrastructure, transportation, community needs and consultation before we can confidently move forward. Another example is how this OCP designation interacts with the Queens Park Heritage Conservation Area, where protected heritage homes are still protected and design guidelines for non-protected properties still apply, though we are not legally permitted to restrict density if builders can find a creative way to thread that needle.
Another change included here is to assure that the OCP accommodates the need for new housing outlined in the City’s Interim Housing Needs Report. This is really just a text adjustment, as the OCP (with changes required by legislation) already provides for sufficient homes to be built in the decade ahead, we just need the OCP to spell out that math clearly.
Zoning Bylaw No. 6680, 2001, Amendment Bylaw (Non-Profit Housing Development, Phase 2) No. 8528, 2025
This change to our Zoning Bylaw would pre-zone all areas in TOD Tiers 2 and 3 (areas already designated for 8- to 12-storey buildings) to allow non-profit affordable housing of up to six stores. This is a big step to assist non-profit housing providers in getting senior government funding approved for non-market housing, as the zoning step is often a barrier to funding commitments. There will be design guidelines, Development Permits, and other authorizations required, but this could significantly accelerate the approval of new truly affordable housing in the City.
Zoning Bylaw No. 6680, 2001, Amendment Bylaw (Land Use Designation Alignments) No. 8530, 2025
Finally, there are some administrative changes to the zoning bylaw required to update the language, to assure a few slightly complicated sites are aligned with the goals of the changes above, and to allow “Public School” in the majority of residential and mixed use lands, simplifying the School Board’s process for acquiring lands and approval of new schools.
We had about 50 pieces of correspondence on this item, about equally split between supportive and opposed, and we had about 20 delegates at Council speaking to it, a small majority of them speaking in favour. Concerns raised were mostly concerns around increased population density and its impact on infrastructure planning, while supporters generally spoke of increasing housing variety, the need to address a chronic regional housing shortage, and the need to streamline affordable housing.
Public Hearing 2: Implementation of Townhouse and Affordable Housing Accelerator Fund Initiatives
Our Second Public Hearing addressed the following two Bylaws:
Official Community Plan Bylaw No. 7925, 2017, Amendment Bylaw (Townhouse Accelerator Initiative) No. 8547, 2025
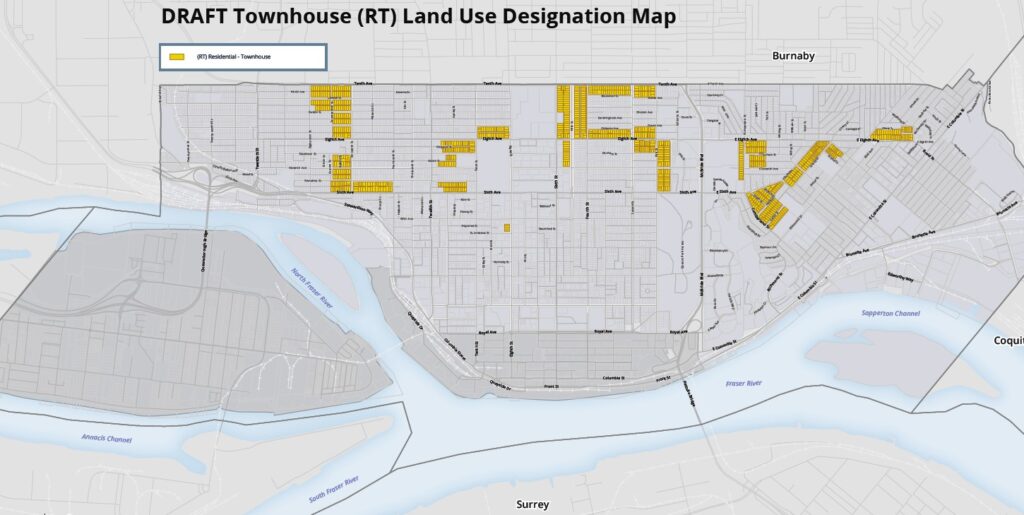
This change to the Official Community Plan would designate Townhouse as an additional land use for about 900 properties in the City that are currently designated Single Family. These properties are mostly the “edges” around the TOD areas above, and some other areas where it made sense from a planning and utility servicing perspective 9modified as a result of some public consultaiton). This is previous to adoption (in an upcoming meeting) of our Small Site Multi-Unity Housing (SSMUH) policy to support the Province’s multiplex rules from Bill 44. In short, the decision was to either designate these sites Townhouse, or to wait and designate them SSMUH at the Province’s June deadline.
This Bylaw also designated non-profit affordable housing projects of up to six storeys as an approvable land use within these Townhouse areas. Unlike the Bylaw above, this is not pre-zoning for affordable housing, these sites will still need rezoning, but it does indicate that Council would consider such a rezoning if a non-profit housing provider could make a project work on these sites.
Zoning Amendment Bylaw No. 6680, 2001, Amendment Bylaw (Townhouse Zoning Update) No. 8524, 2025
This amendment to our Zoning Bylaw would pre-zone approximately 570 of the 900 Townhouse properties above for Townhouse development. This will speed up the approval process if people want to build townhouse form on these properties, allowing them to skip to the development permit process, removing some uncertainty and delay from the process. This pre-zoning is not extended to all 900 because some of the properties (based on lot size, availability of a back alley for access, etc.) are not appropriate for development as townhouse without more complicated servicing/design/access work that is best secured through rezoning.
We received about 55 pieces of correspondence on these changes, with a moderate majority opposed and we had about 27 delegates at Council speaking to it, a small majority of them speaking in opposition. Concerns raised were similarly around increased population density and its impact on infrastructure planning, though there were a number of people whose properties were directly impacted or adjacent who didn’t want townhouses near their homes for aesthetic or character of the neighbourhood reasons. The supporters mostly spoke (again) of increasing housing variety, the need to build “missing middle” housing forms between houses and towers.
In the end, Council in mostly split votes approved third reading for all bylaws. The need to meet Provincial housing requirements, and the interest in both housing variety and speeding up truly affordable housing approvals were cited as reason for support. You are better to listen to the video than read my summary of the reasons expressed by some other members of Council for opposition, but it was basically an anti-housing anti-growth message, peppered with misinformation around our infrastructure planning.
The Public Hearing feedback was indeed mixed, but the public consultation prior to the hearing was more firmly in support of the direction the Bylaws presented, including allowing infill and townhouses within Tier 2 and Tier 3 TOD areas (73% in support) and in supporting 6 storey affordable housing in the OTD areas (75%) and the Townhouse areas (63%).
To put some of the deliberating of these Bylaws in context, it is important to note that the Provincial Regulations came out in November 2023, and the City received a Federal Housing Accelerator Fund grant in February 2024 to fund our work toward meeting those requirements, and accelerating affordable housing approvals in the City. In response to this Staff developed a work plan to do the TOD and Townhouse work that was approved unanimously by this Council on May 27, 2024, and a work plan to do this Affordable Housing work was approved unanimously by this Council on June 3, 2024. I include the dates, because the motions and unanimous votes are a matter of public record, you can look this up.
On November 4, 2024 Council unanimously endorsed the approach to early and ongoing consultation, which included in the Spring of 2025 on-line consultation with a survey and an on-line Zoom information event, and a series of Community Open Houses that were well attended and outlined preferences and concerns. On October 27, 2025 Council unanimously, and item-by-item, approved the bylaws above to be prepared for readings, and on December 15, 2025 Council unanimously endorsed the detailed plan, and gave first and second readings to the Bylaws.
Everyone on Council is of course free to vote their conscience or change their mind, but I think it is fair for to ask members of Council raising serious objections to these Bylaws at 50 minutes after the 11th hour (literally and figuratively) why they did not take any of those five previous opportunities over the last two years to raise concerns to staff and Council. If they had, staff and the rest of Council could discuss those concerns, understand those concerns, maybe even make changes and seek consensus on solutions to address them. How are staff able to develop policy that meets your concerns if you have never, over 5 meetings and almost two years, raised a hint that you had any concerns? They are not mind readers. In my opinion, sitting on your hands and ignoring staff in multiple meetings over two years when they are asking for input, then telling them they did it all wrong at the end is not just bad leadership, it is disrespectful to the public service, and to the community.
And I’ll stop with the politics now and put the rest of that in the newsletter.
After the Public Hearing Bylaws were approved, we had one more piece of business which was a Bylaw for Adoption:
Development Cost Charges Police Reserve Fund Establishment Bylaw No. 8570, 2025
This Bylaw that establishes a reserve fund for Police infrastructure that will be funded through development cost charges (and is one small part of the answer to the questions “Are we planning for infrastructure growth? How are we going to pay for it?” was adopted unanimously by Counicl.
And with that we were adjourned a few minutes before midnight.