The Fraser Institute are up to their old tricks: shabby data gathering resulting in inaccurate results. I’ve demonstrated this before, and even sent them a letter outlining the big mistake they made last time they did this (not coincidentally four years ago, just before the last municipal election), and they have blithely made the same mistake again. So here I am to correct the record. Again.
The Record shingled this story into my social media feeds, and it speaks to this report prepared by the Fraser Institute. The report attempts to compare “spending per capita” and “revenue per capita” across the 17 largest municipalities in Greater Vancouver. I’ve said before, this is not a competition, but on the face of it, this isn’t the worst way to look at whether residents in various municipalities are getting value for their tax dollar. There are a few problems with over-simplification (I’ll talk about those further down), but as a first pass it is an interesting easy-to digest media byte.
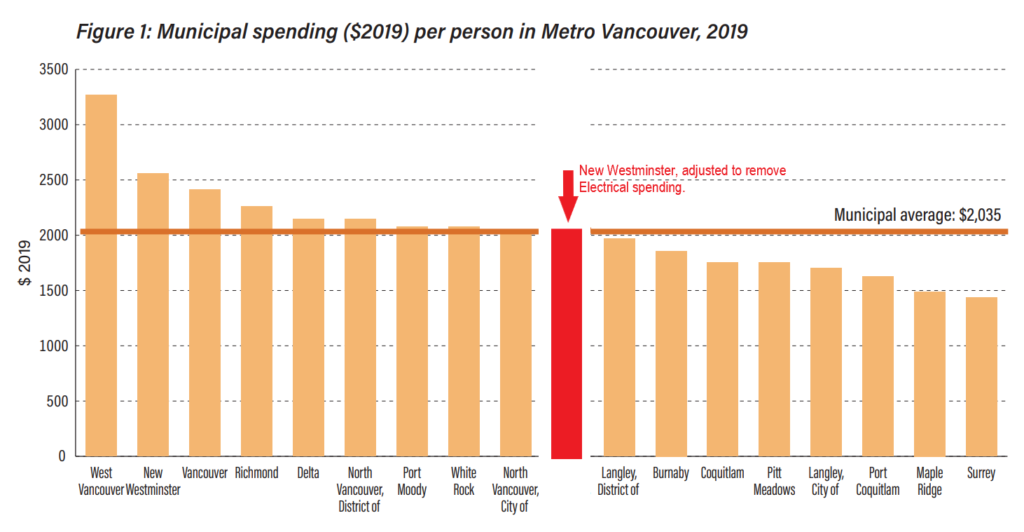
The problem is, New Westminster, unlike any of the other 16 municipalities listed, has an electrical utility, and the data used by the FI rolls that Electrical Utility into the overall revenue and spending amount. Residents of every other city pay for electricity, but it is not included in these comparisons. This is not an insignificant difference. New West Electric pulls almost $50 Million in revenue ($622 per capita), and spends more than $40M ($505 per capita) every year.
So, much like I did last time, we can adjust for this significant factor, and shift the FI charts to reflect an apples-to-apples comparison. You see New West, when fairly compared, does not have the second highest spending in the region, but is tied with North Van City for 8th place, firmly in the middle of the pack:
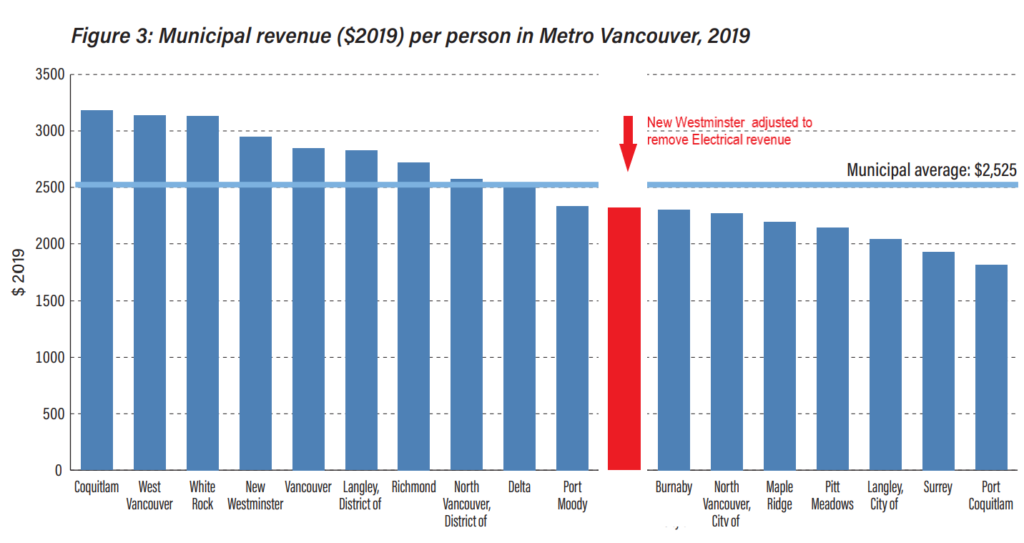
And when fairly compared, New West does not have the second highest per capita revenue in the region, but instead tenth, slightly below the regional average:
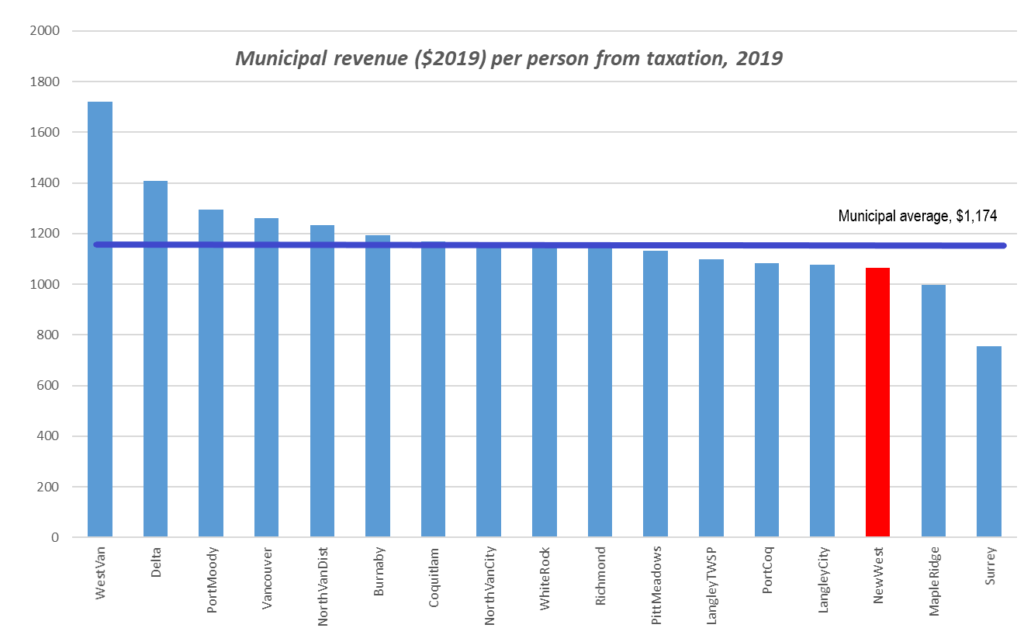
The FI also conflates all revenue sources. This is problematic, because they vary greatly across the region. Municipalities have different fees for services and different ways of managing utilities. Also, as this is a data snapshot for only one year, factors like one-time senior government grants or sale of properties in any given year can really juice the numbers and make apples-to-apples difficult. When fans of FI reports talk about City spending, they are usually worried about taxes, so it is fortunate that the same government database from which the FI draws their numbers breaks down the revenue sources. It is easy to separate out Property Tax revenues from the pile, and compare on a per-capita basis. When you do that, you see New Westminster is one of the (and I totally buried the lede here) lowest-taxed municipalities on a per capita basis in the Lower Mainland:
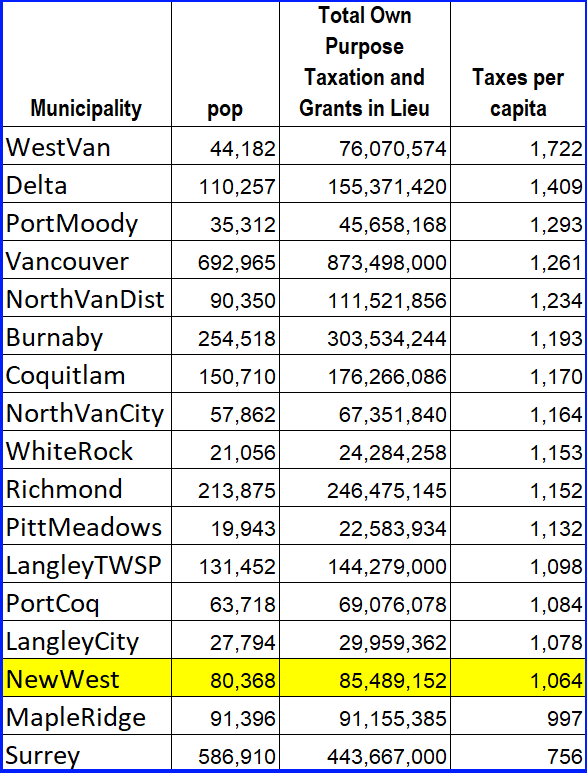
And in case you are interested, here is that data in tabular form:
Now onto the detail part for those still interested.
I find the lack of adjustment for the electrical utility fascinating, not only because I pointed it out to them last time, but also because they do make and adjustment for the West Vancouver Blue bus system – a single-municipality expense and revenue stream. If you compare the FI data to the government database, you find West Van expenses are actually higher (by $417 per capita for spending and $910 per capita for revenue) than the FI report. They make that adjustment for West Van blue bus, but not for New West Electrical. This seems inconsistent.
Looking at the government database also demonstrates the problem with using snapshot data for one year. Line items in spending like “loss on disposition of assets” sound technocratic, but it is writing off value of assets either destroyed or sold off, and it varies across the region year by year as you might imagine. Add to this annual amortization adjustment, and cities with lots of physical assets (like Vancouver) and those that have invested recently in important infrastructure are disproportionately cast as spendthrifts. On the revenue side, one-time grants for big projects may be counted in this year data, but not reflect overall revenue generation ability. In 2019, Coquitlam sold $60 Million in assets – more than every other municipality combined – but that is not an annual (or sustainable) trend and does not reflect any long-term economic comparison between Coquitlam and any other municipality.
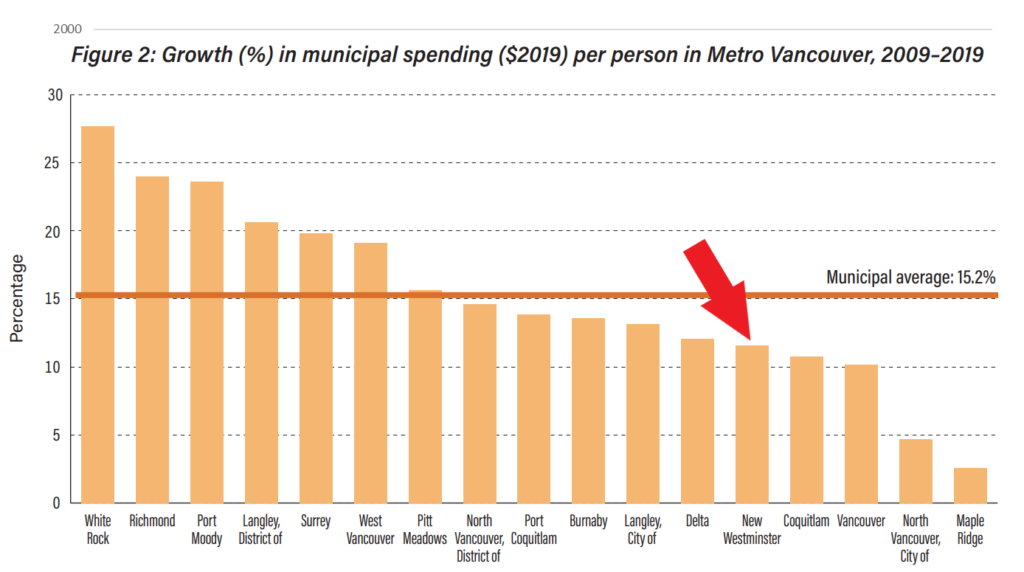
So the comparison is sloppy. And as much as I would like to counter some critics with the table that shows New Westminster spending growth over my time on Council as one of the lowest in the region (and, notably, much lower than the 18% cumulative inflation of the 10 years ), the way the FI presents data is so poorly explained that I don’t even feel good using it to tell a story that makes New West look like the kind of fiscally responsible municipality the FI would allege to support:
I just want the FI to do be fair, and the local and regional media to do a little bit of preliminary analysis before they credulously print their press release. After years of this kind of sloppy work the FI deserve to be treated with more scrutiny.
Really appreciate all the hard work that goes into this article and all the rest. You add a real depth of transparency to residents of new west.