The discussions about municipal budgets are ongoing across the region, As it is budget time, and as the Province has decided to flip $1 Billion to local governments right in the middle of that budget period, which will lead to some interesting conversions in every muncipal hall. Some Councils will see it as a windfall to be spent on new things, some will use it for political cover for questionable decisions, some will prudently invest, others will go full populist. A real Marshmallow Test for local government.
Among the stories, this one popped out to me. PoCo is getting a reputation for artfully blending populism with prudent investment, but the bigger question about balancing reserves is something that every city neeeds to grapple with. The McElroy story caused me to dig deeper into reserve levels across the region, so I can test my preconceived notions about New Westminster’s relative financial health. As always, I want to preface this by saying it is not a competition, as every municipality has its own pressures, its own priorities and its own way to serve their populace. In comparing ourselves to our regional cohort, I want to get a sense of where we are doing better or worse to inform our priority setting while approving a budget.
I am once again leaning on the BC Government Local Government Financial Statistics, which are reported in a more-or-less consistent way every year. This is not my data, but the data provided by law to the Province by local governments every year. When it comes to Financial Assets, Reserves, and Tangible Capital Assets, all data is pulled form Schedules 301, 302, 404, and 503. Got a problem with the numbers? Take it up there.
Every City reports Financial Assets (the money in their savings and chequing accounts) and their financial liabilities (their mortgages and loans). The difference between them is reported as “net financial reserves”, which is the number McElroy was pointing to in that story above. These are the reported numbers for the 17 major Municipalities in Greater Vancouver (sorry, Belcarra) in the most recent reporting year, which is the end of 2021: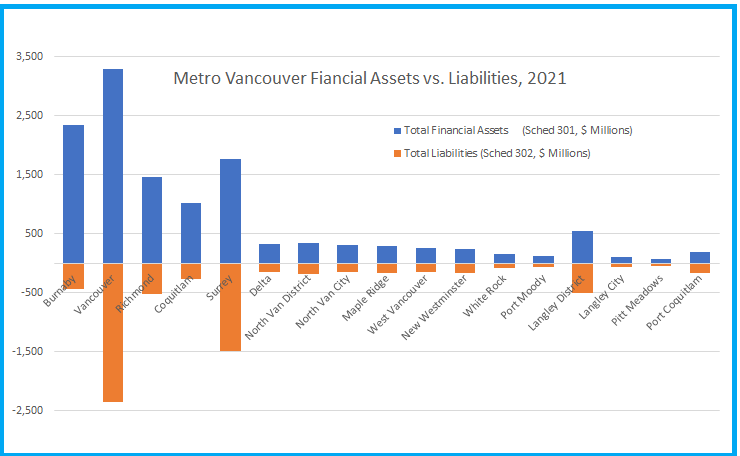
But perhaps a better way to look at it is to subtract the liabilities form the assets, so you can compare the Net Reserves:
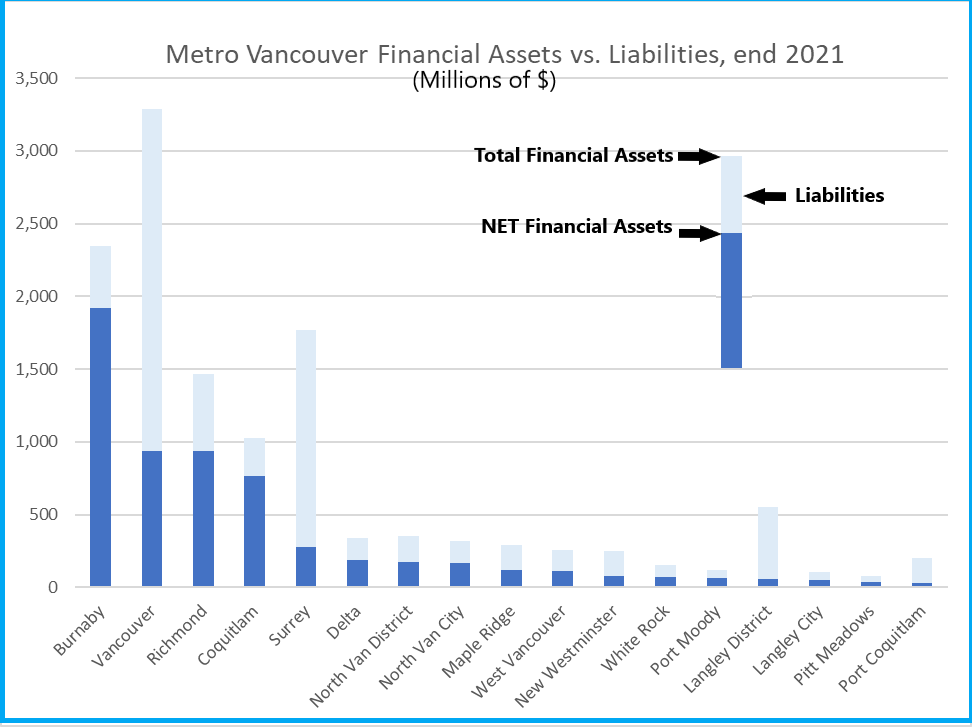
Some things are not surprising: Vancouver has the most money, and the most debt. Burnaby has the highest net neserves, and Richmond and Coquitlam are both doing really well if money-in-the-bank is your preferred measure. Indeed, PoCo has the lowest net, with New West a little below the middle, but there is a trend following population, as you might expect, with smaller Munis over on the right, larger towards the left. So let’s calculate the net reserves per capita using 2021 Census data:
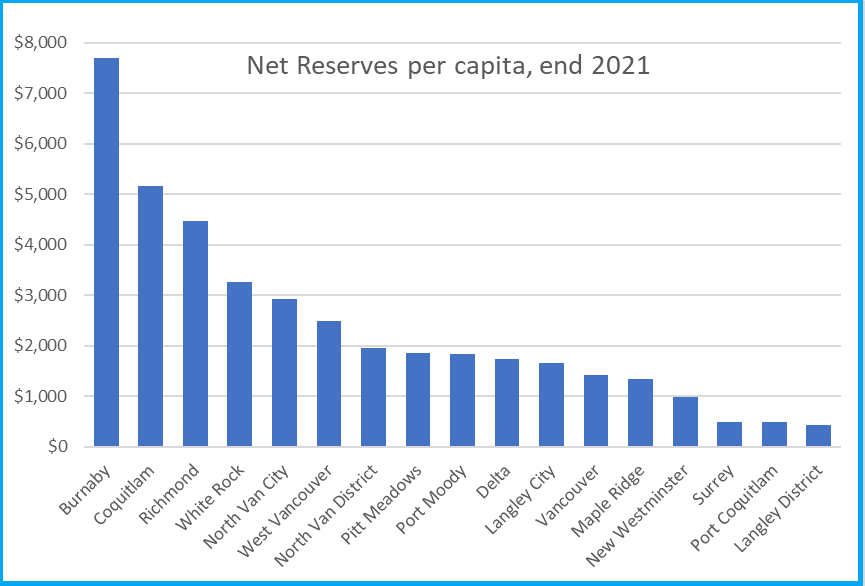
Burnaby still way up there (with $7,700 in net reserves per resident), and New Westminster shifting further over to the right (with $972 per resident). PoCo in this measure is not the lowest, but is pretty closely clustered with Surrey and the Township of Langley at under $500 per resident.
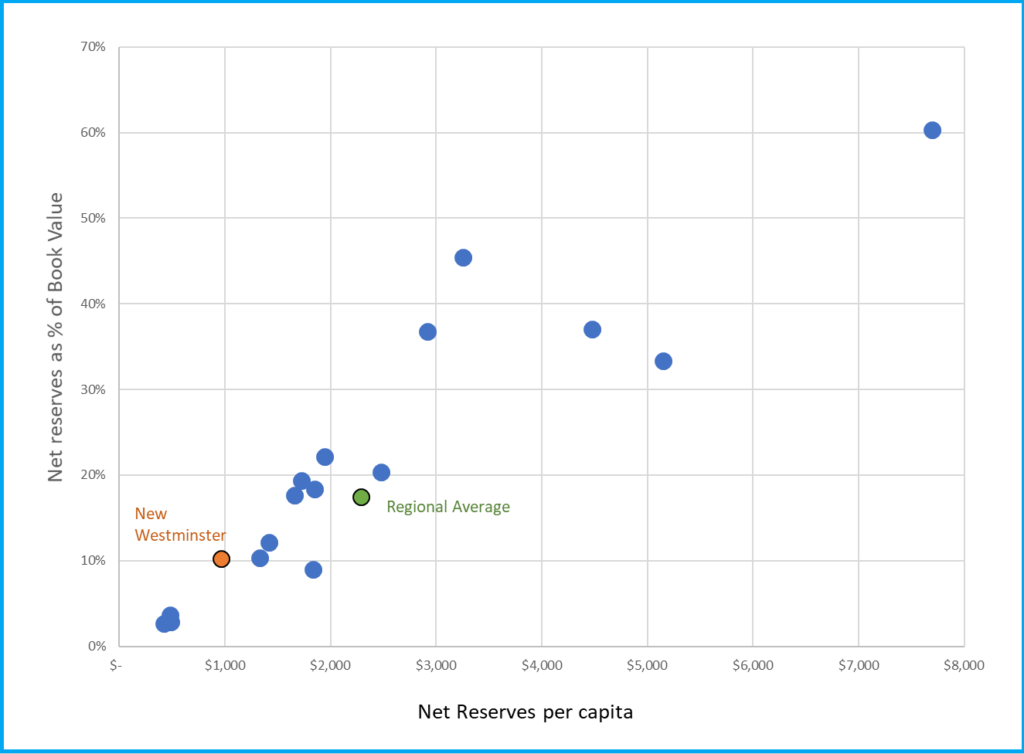
This is interesting, but does not really reflect the purpose of reserves. Part of it is to demonstrate financial health to make it easier to borrow money, but part of it is also to have sufficient cash on hand to address unexpected future costs. Mostly those costs are related to capital replacement, so it is more useful to compare your reserves to the value of your capital assets. This is the value of the roads, buildings, pipes, computers, vehicles and all of the “stuff” your City owns and operates. Schedule 503 provides these numbers as reported by the City every year. This chart shows the reserves as a percentage of the net book value of our tangible capital assets: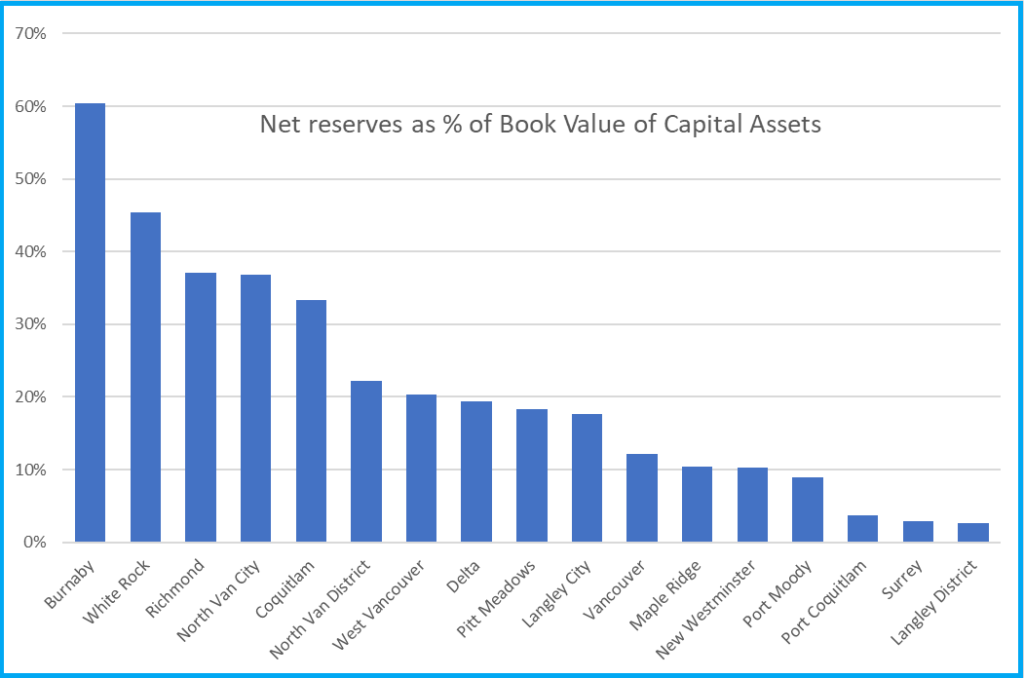
There needs to be a big caveat here. Though a fundamental measure of your reserves vs the value of your capital assets is a measure of financial resiliency (our finance staff have suggested 10% of the asset value is a good minimum benchmark), the denominator of the equation needs to be viewed with a certain skepticism. This is because local governments have not historically been very good at evaluating the true value of their capital assets, and that might take me down the rabbit hole of talking about asset management, which is probably another blog post on its own.
Just to create a sense of comparison, here are the net reserves per capita and relative to tangible capital assets, plotted as a scatter. Somewhere in here is a trend. I added the green dot to show the “average” for the region:
Finally, part of the conversation about reserves is the direction they are moving. Are we building them, or are we depleting them? Luckily the province provides data going back a few years in their Schedules 404. To compare across cities of varying size, I indexed the reserves value based on their 2012 value so we can see the decade-long trend. Problem is, a couple of Municipalities (Vancouver and West Van) had negative reserves in 2012, which makes it hard to compare this way, so I removed them from the data set. Suffice to say, their increase over the last decade has been proportionally much higher than all others (they would be well off the top of this chart). But for the rest of us, you can see most Munis are in building phases, and only one has fewer reseves than a decade ago:
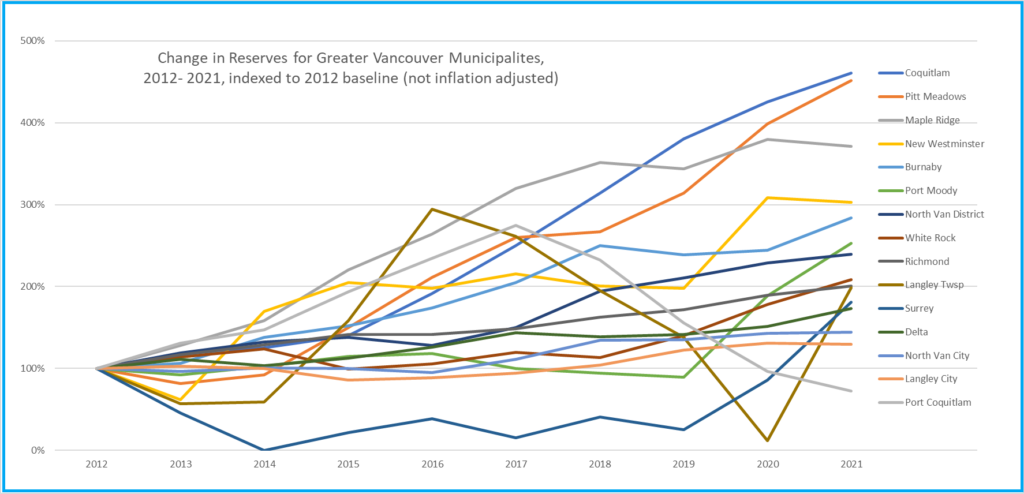
The comparison over a decade is valuable, because reserves serve another function – they are where a City stores some money for big capital investments, like a recreation centre or a new City Hall. And when a City borrows to build a new capital asset, that downward pressure on net reserves is felt for several years. New West has been growing reserves in the last couple of years in recognition that təməsew̓txʷ and it’s $114 Million investment will have this impact on our net.
So, comparatively? New West has lower-than-average reserves by most measures, has been building them, but has a big capital investment that will put downward pressure on these reserves in the years ahead. That should inform some of our thinking about future investments in the City and our ability to make expensive promises.