We are getting into the 2025 budget cycle in New West Council. We have already done some preliminary fee and charges setting work, but the workshops to discuss utility and tax rates for 2024 start in earnest in late November. It has been a while since I wrote a piece on this page directly about property taxes. There are a lot of myths and misunderstandings about how property taxes work, and I have written a tonne over the years (since even before I was and elected person) to address some of these. As mot of you are new, It is worth repeating some, as zombie ideas pervade the talk of taxes in New Westminster.
Maybe the easiest thing to do is link to those various pieces, but with a caveat: There may be some errors in how I understood the system before I was elected, so don’t pull up an 11-year-old blog post and say “the mayor is lying”. We all learn over time, and I’m happy to see examples of where I had something wrong, this stuff is actually more complicated than people think. Also, the numbers have changed since 2012 (check the dates on some of these posts), but the essential mechanism and comparisons haven’t really (more on that later).
Here’s a long bit about how Mill Rates work and why they are a bad way to compare between municipalities: https://www.patrickjohnstone.ca/2013/01/on-assessments-and-mil-rates.html
A couple of years later, I compared tax charges on a “typical house” here: https://www.patrickjohnstone.ca/2013/01/what-is-mil-worth.html
And then added utility charges: https://www.patrickjohnstone.ca/2013/01/what-about-utilities.html
Shortly after I was elected, I wrote this comparison: https://www.patrickjohnstone.ca/2015/04/talking-taxes-pt-1.html
I also compared how regional property taxes have changed over time here: https://www.patrickjohnstone.ca/2016/02/more-taxes-with-colour.html
And there was also a fun conversation about how tax increases relate to property value increases, with a surprising coda at the end: https://www.patrickjohnstone.ca/2020/07/taxes-2020-part-2.html
I do think it is worthwhile doing an update on our regional comparators. I have repeatedly emphasized this isn’t a competition, because a race to the bottom is rarely a good way to get positive governance results for a community. However, if we are anomalous and doing something so different than our cohort, that’s a good sign we need to check on ourselves, because communities have different scales and priorities, but similar challenges. The general feeling in New Westminster that we are a high-tax municipality is a myth that deserves analysis.
Cities report their numbers in different ways in their public reports, and some make it very difficult to find their actual budget spreadsheets. Fortunately, we are all required to report our finances to the Provincial Government in a consistent way, and the province puts those stats out for public review here: https://www2.gov.bc.ca/gov/content/governments/local-governments/facts-framework/statistics/tax-rates-tax-burden and all of the data below is pulled form Schedule 707 spreadsheets. Feel free to check my math!
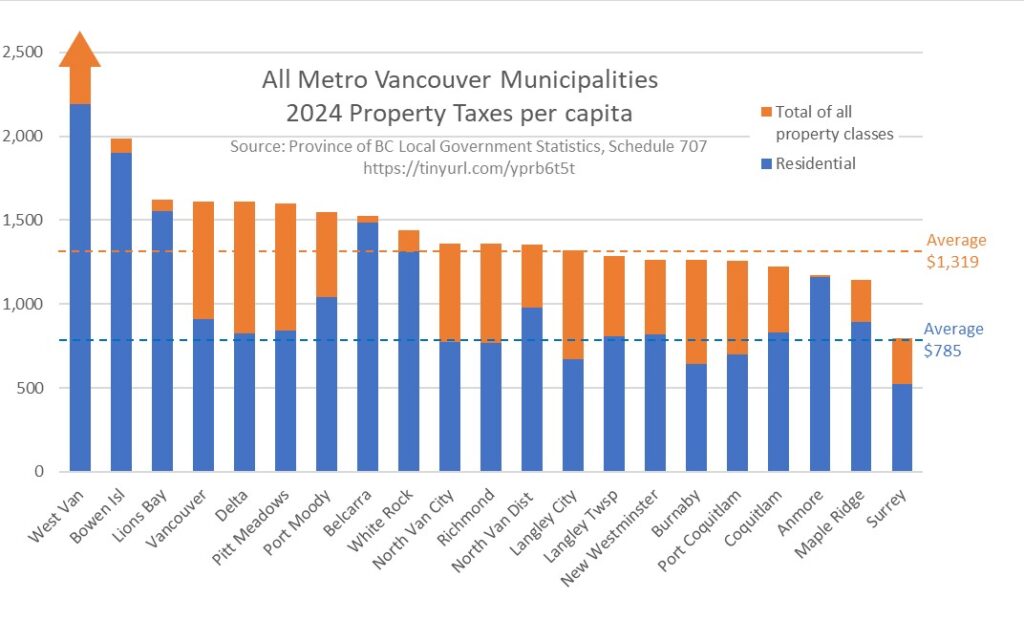
Here is how the property tax burden per resident compares across the 21 municipalities on Metro Vancouver:

You will note that Schedule 707 separates property taxes paid by residents (charged to households) and those paid by other property classes (industrial and commercial, for the most part). The overall tax revenue (from all property types – shown in orange) collected in New Westminster per capita is $1,264 which puts us slightly below the regional average of $1,319 and rans us as the 7th lowest of 21 municipalities. The property tax paid by residential property owners only (shown in blue) is $820 per capita, which puts us a little above the regional average of $785, though we are still the 8th lowest of 21 municipalities.
Overall, we are pretty close to the middle and overall slightly below the middle when it comes to tax burden on our residents.
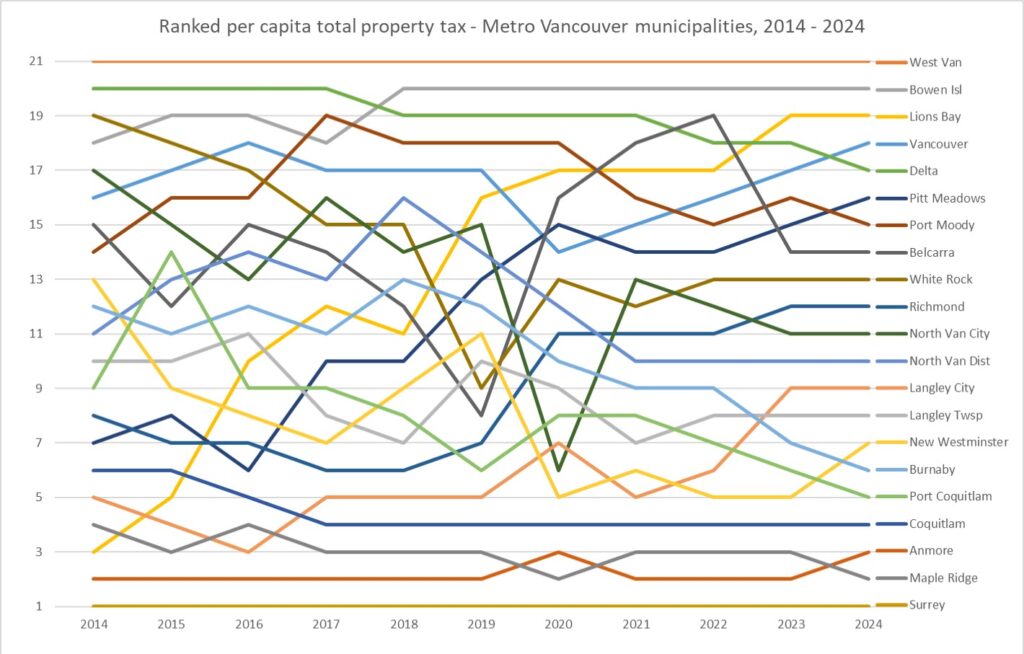
As the province provides these numbers back through time, we can go back as far as 2005 and see New West has always been in about this position relative to our regional cohort, though it varies a bit most years. Graphically, I have drawn this up to show how we have changed since the last “Wayne Wright” budget of 2014 and today, a good 10 year run to spot trends.

Note the y-axis here isn’t the relative tax level, it just ranks every municipality from 1st (Surrey) with the lowest taxes to 21st (West Van) with the highest taxes every year for the last 10 years. New West has gone from the 10th lowest to the 8th lowest over that time, trading places a few times with Delta and Langley Township, while Coquitlam, Pitt Meadows, and Vancouver have passed us going the other way.

When you add all the non-residential taxes to this, it gets a bit messier, as industrial land and residential land change value at different rates and again, cities have different priorities and opportunities when it comes to balancing resident needs and those of businesses. Here, New Westminster goes form 13th lowest to 7th lowest over the last decade. Note Anmore goes from being one of the highest taxed municipalities in the resident-only chart to one of the lowest here – they simply don’t have the business or industrial tax revenue to reduce the burden on taxpayers. And don’t ask me what is happening in Lions Bay.
There are a LOT of factors that play into these comparisons – whether a City is higher growth or lower growth, the timing of when Cities bring in major new operational costs like a new recreation centre, or how the city manages its capital reserves. Some cities have casinos which help reduce tax burden, we have an electrical utility which does the same. So direct comparisons are not easy to make, or even particularly useful, but it is good to have some data to back up discussions about relative tax loads and to spot trends over time. Of course one might argue that all Metro Vancouver property taxes are “too high”, but I encourage you to see how Toronto, Calgary or Seattle compare, and you might be surprised.