This is the second in a series of posts about the 2024 Budget. I wrote recently about the general operating fund, and now am diving in to the utility funds.
The City of New Westminster has four utility funds. The financing of utilities are regulated by the Province and Public Service Accounting Board standards. As such, the money you pay in utility fees for your water, sewer, trash, and electricity are not “taxes” that feed general revenues, but can only be used to finance and run the utility. They must be accounted separately than general operational funds of the City and general taxation.
The Electrical Utility makes us different than other municipalities in the Lower Mainland (though there are municipal electrical utilities in Nelson, Kelowna, and a few other small communities in BC). That utility also has the unique feature that it pays a dividend to the City (it makes a profit), and because it is generally counted along with other utilities in comparisons between New West and other cities, it is also the source of some tired misinformation about our comparative taxes. But I’m tired of beating that drum.
All of our utilities have one thing in common – much of their budget is a result of costs passed down to us by larger entities. Water, sewer, and solid waste utilities pay Metro Vancouver to supply us clean water, treat our dirty water, and manage disposal of our wastes. The balance of the costs are operations of the utility (we need people to run and maintain the systems, test water, process payments, etc.) and capital costs (we need to build and replace pipes and pumps and vehicles). As such, the budgets are easiest to understand through a Lawrence Livermore style flow chart. So I’ll draw some of those, and talk about them.
The way these work is the vertical bars are (approximately) to scale, on the left are our sources of income and on the right are where that money ends up getting spent. Green are revenue sources, blue are operational expenses, pink are transfers internal to the city, and orange is interactions with our Reserves and the things we build through our Capital Budget. Each utility has a reserve, we put “surplus” every year into the reserve, and take money out of reserves to pay for and build things like pipes and pumps and trucks to keep the place running. Note all numbers here are rounded, and in the 000’s, and please recognize this is a bit of a simplification done to try to make the big systems more understandable. (I’d love to hear feedback about how this presentation works for you!)
Sewer Utility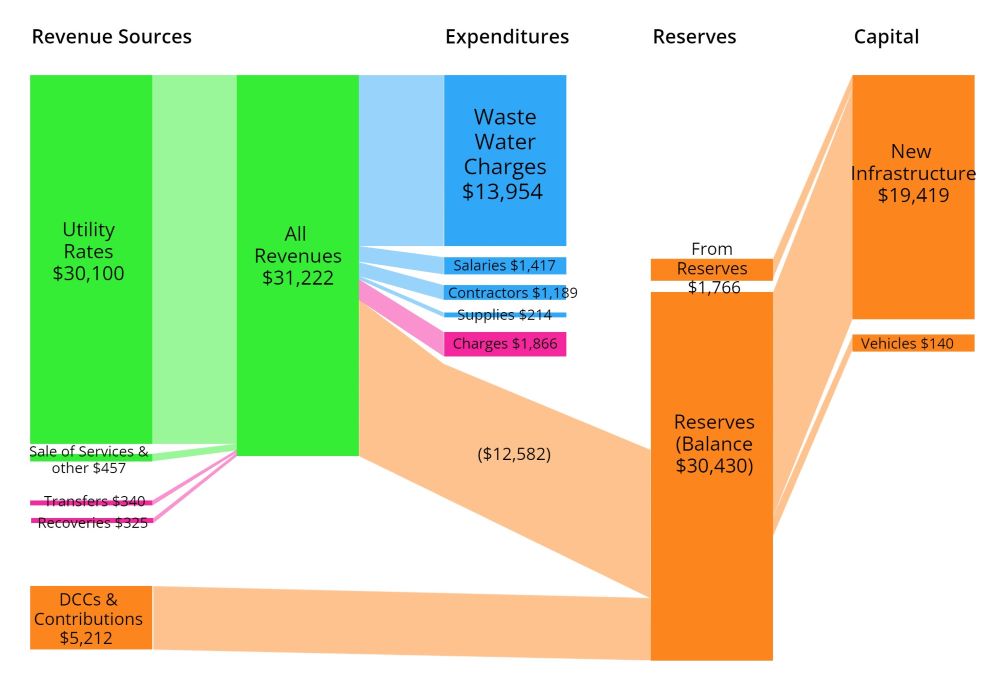
Our main source of revenue is utility rates, though we also take in DCCs and other contributions to support our capital plan. Of the ~$31 million we take in, about 45% goes directly to Metro Vancouver to pay for the treatment of wastewater. This cost has gone up 14% in the last year, and is the primary driver behind our utility rates going up 8% this year. As you can see, the operational cost for us to run the utility (salaries, contractors, supplies) only equal about 10% of our revenues, so there is not a lot of cost savings to be found there.
We are planning for a $12.5 million surplus in 2024, which will all go into our Sewer Reserve, as will the $5.2 million we got from developers and senior government grants to support our capital program, which adds $17.7 million to the reserve. However, we are planning to spend $19.6 million on new infrastructure (pipes and pumps) and vehicles, which means we are planning to draw our reserves down by $1.8m, or about 5%.
Water Utility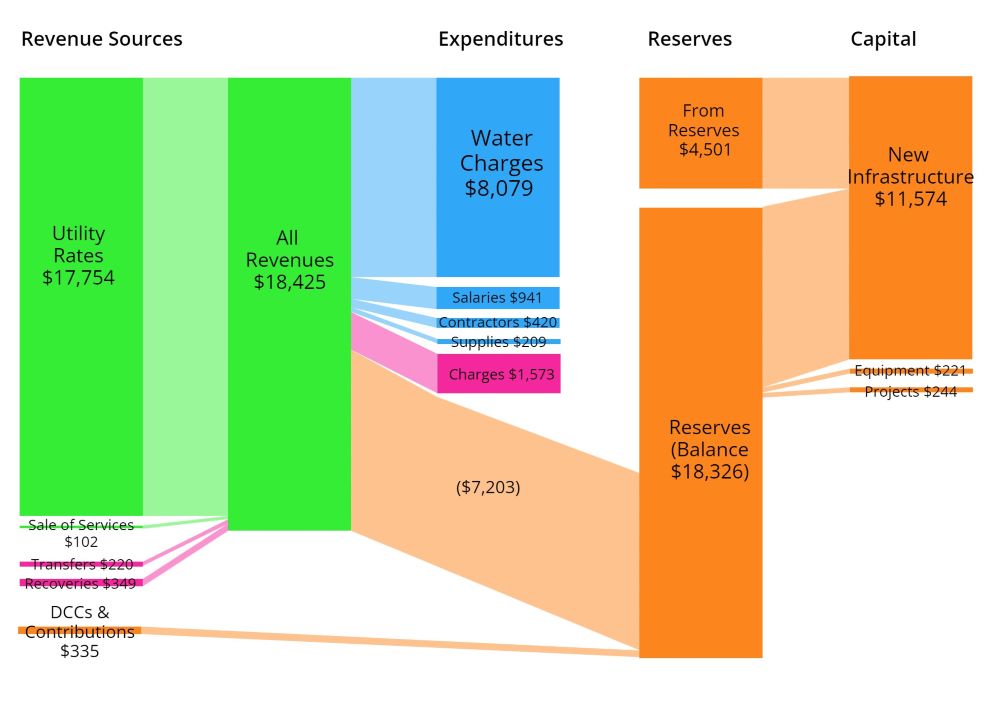 Again, our main source of revenue is utility rates, and the DCC/contribution part is much smaller in water this year. That has mostly to do with the timing of capital projects and our success at getting senior government grants for sewer work more than water work. Of the $18.5 million we take in, about 44% goes directly to Metro Vancouver to pay for the water. We spend less than 10% of our budget on operations, though with internal charges (the money other city departments charge the water utility for services), this cost is a bit higher than in sewers.
Our surplus in 2024 will be about $7.2 million, but we are planning to spend just over $12 million in new infrastructure and capital equipment in the utility in 2024. This means we will be drawing down the reserve by about $4.5 million, which represents about 20% of the reserve value. This is more than ideal, but with major sewer work being advanced by Metro Vancouver in Sapperton and West End, it is a good idea for us to do water upgrades at the same time, so you only have to tear the roads up once. Having a healthy reserve permits us to advance this work without borrowing money. I am asked often what the City is doing to find efficiencies and save money, this is a good example of one thing we are doing in the water utility – spending a bit now to save more money later. Our 5-year plan sees us getting back to 2023 reserve levels in the water utility by 2026 or 2027, so eroding reserves in the short term isn’t a structural budget issue, but a strategy.
Solid Waste 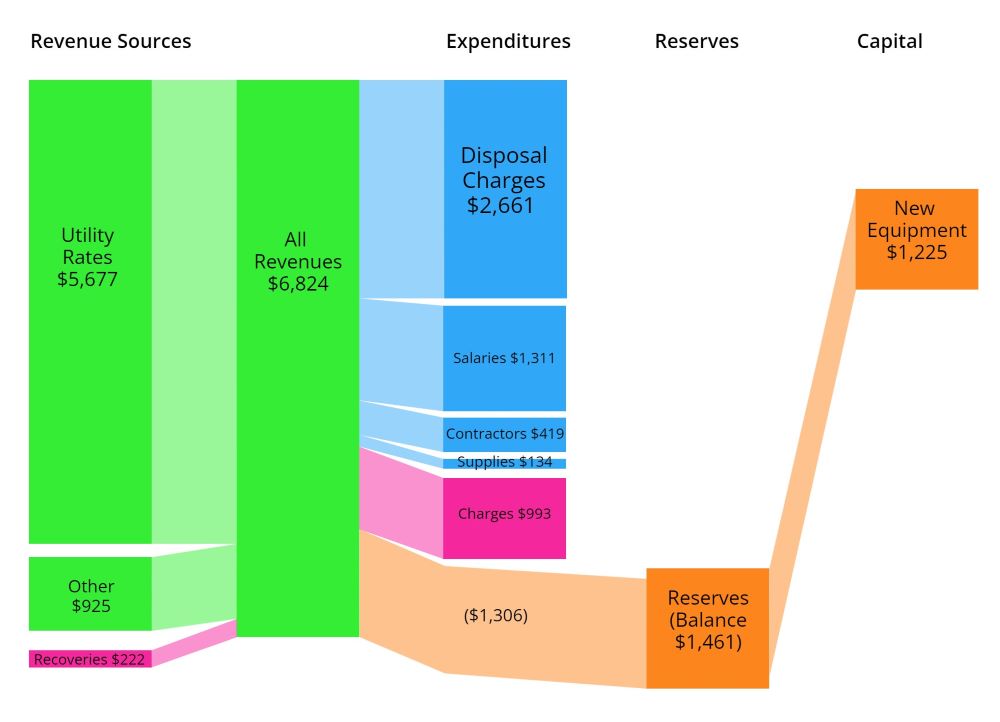 Garbage and recycling are bit different than the other utilities, as the level of service provided to different parts of the community (house vs. strata, home vs. business, etc.) varies quite a bit, and although disposal charges handed down (mostly from Metro Vancouver) for taking in our waste still eat up almost 40% of all of our revenues, there is a much larger operational cost to solid waste. We need staff to drive those trucks and fuel for the trucks, because you can’t put your trash in a pipeline.
We have been running low reserves in the Solid Waste utility for quite some time, and are looking to build them up through this 5-year financial plan. As the “capital” is mostly trucks and bins, there is a shorter lifecycle than the pipes Water and Sewer put in the ground, so our annual Capital spend is perhaps proportionally higher than in the other utilities. However, over all the budget for Solid Waste is much smaller than the other utilities.
Electrical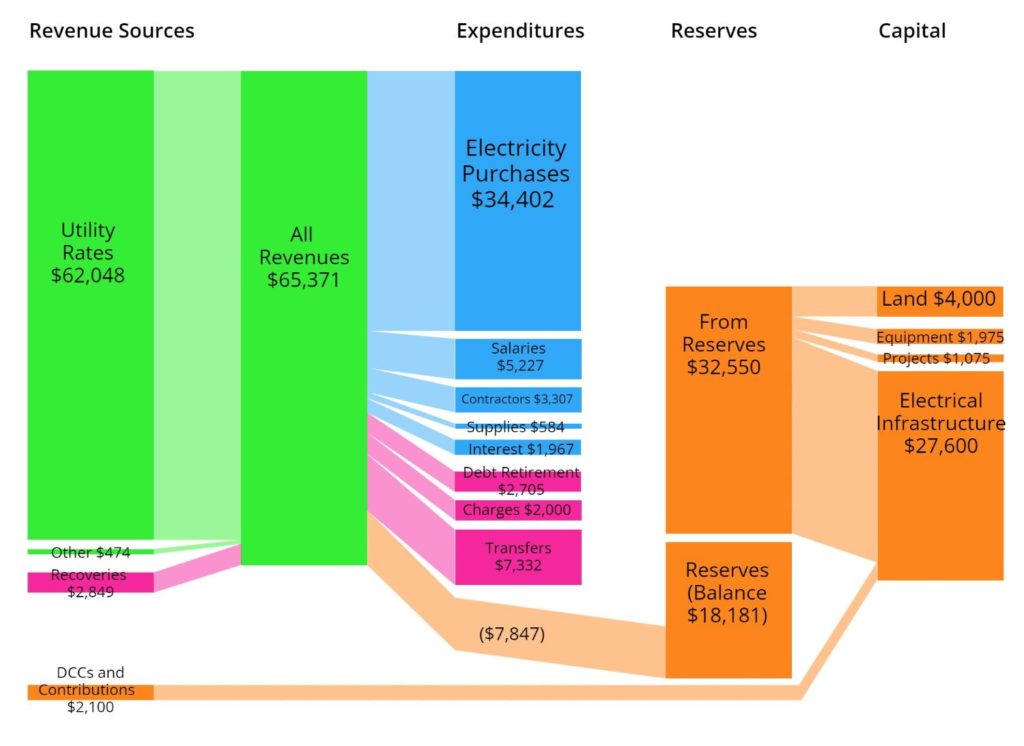 Our Electrical Utility has a few unique aspects, but it functions like the other utilities we have. The electricity we purchase at wholesale from BC Hydro costs us just over half of our overall revenues, and the cost of day-to-day running of the utility costs about another 17% (or a little over $11 million). This leaves us with about a third of income that goes into our Capital Reserves or directly to the City as transfers. The transfer number here is large because it includes the dividend the City takes every year from electrical utility operational surplus and puts it in the general operational fund. This amounts to about $6 million that the City uses to offset property taxes in providing services that we otherwise wouldn’t be able to deliver.
The utility is spending a *lot* right now on a major capital upgrades. We just built a $30 Million substation in Queensborough, and are now rolling out Advanced Metering Infrastructure, which means 60,000+ new digital electrical meters and the hardware and software to integrate them into our IT network. This is a big, generational investment, and as a result we are drawing down reserves that were intentionally built up a bit to help support this work. Our 5-year Capital Plan has us building these reserves back up to the ~$37 million level by 2028, but at the same time, we are budgeting for a cumulative spend of more than $150 million in upgrading our critical electrical grid over the next 5 years. It’s a good time to be selling electricity, but it is also a challenging time to keep up with the demand for more service.
Summary
There is not a lot of change in these budgets compared to recent years, except maybe some increased capital expenditure. The annual increases are essentially the same as the last 5 or so years (sewer increase a bit higher this year, solid waste and water increases a bit smaller, both way lower than Port Coquitlam’s increases this year, but its not a competition!), and the budget drivers really don’t change – Metro Rates are going up to support their aggressive capital investments, and we pass that on. Compared to the region, our water and solid waste rates are about average (though it is hard to do apples-to-apples comparisons because all cities provide different services and rate schedules). Our sewer rates are still at the higher end regionally, because we still have a lot of older combined flow sewers. This has the double whammy of us sending more water to the plant than we should, and requiring higher capital investment to replace and upgrade those systems. Fortunately, we have been pretty successful at getting senior government grants to help offset some of those costs.
Which brings us into the discussion about the Capital Budget, which I will dive into next post.