Budget 2020!

This week in Council we are going to be talking about the Budget, and are asking people to once again provide us some feedback on budget issues. Providing this feedback is difficult for many people, or it is hard to understand how your feedback will be incorporated, because municipal finance is a little bit arcane. So I thought before the meeting, with the reports and tables on line here, I would give you a bit of a run-down of how the budget process works.

We have already had some lengthy discussions about the capital budget. This is the budget we use to pay for things like buildings and vehicles and computers. These are (mostly) one-time items, though most need periodic replacement, and (mostly) tangible objects, though we can use capital funds to fund planning for tangible objects, like hiring a consultant to develop an Urban Forest Strategy that will result in capital expenses to buy and maintain trees.

The City is required to balance its budget over a five-year financial plan, so when we talk about “Budget2020”, we are talking about an excerpt of the overall 2020-2024 Financial Plan. Following from this, our 2020 Capital Budget is part of a 5-year Capital Plan, which makes sense because most large infrastructure works cannot be planned, financed, completed and paid for in a single year.

Our draft budget has a 5-year capital plan to spend ~$468 Million on new buildings, infrastructure and equipment, with a some of that representing a few major projects: The ~$100M Canada Games Pool, $54M for a district energy utility, a ~$40M electrical substation in Queensborough, ~$17M to fix up the Massey Theatre, $20M in road paving, etc. This includes the Utility capital investments ($123M for Electrical, $50M for Sewer, $25M for water, and $1.6M for solid waste). In 2020, we are budgeting to spend ~$140 Million of that total.

The City has three options to pay for any capital expenditure: reserves, debt or revenue. Reserves are the monies we have in the bank, some to assure financial solvency, some earmarked specifically for projects, like the money we have put aside for the Canada Games Pool replacement. If there is a reserve fund appropriate for the spending we plan, then drawing from those reserves make sense, though we have to be cautious about drawing those accounts too low because they provide us some financial resiliency, and improve the rates we get from banks when we borrow. Borrowing to pay for infrastructure makes sense for a recreation centre much the way it makes sense to get a mortgage for your house: the people using it pay for its use while it is being used. We have a *lot* of debt room in the City as far as regulations and good financial planning are concerned, but we have to address the public tolerance to take on debt (through a public process when we take out loans), and of course manage the cost of borrowing. The third option is to draw from revenues in the year we have the expense, be those revenues in the form of a grant from senior government or through raising taxes. These both, of course, have limits.

The part of the annual budget that directly impacts your tax rates is the Operational Budget. It is from this budget that we pay staff and buy paper and diesel. Sometimes a pundit in town will chagrin “most of the City’s spending goes directly to salaries!”, to which my only retort is “Yeah, and?” The City provides services more than we build widgets. Widget ore is not as big and expense as delivery of those services, which are delivered by people, from lifeguards to librarians to police officers. Sure, we buy asphalt and pipes, and firefighters need firetrucks, but most of our budget is service delivered by people.


We spend most of the year operating the City based on the operating budget set in the previous spring. As the year goes along, staff, Council and the public identify places where the City can do things differently, where our service is not meeting demands, or where new services are being pondered. Some small things may get done as staff find space in their existing budget to make them happen (or stop doing other things to make the room). But some things are more costly or need more staff time to manage, so managers put forward an “enhancement request” – they ask for more money.

Part of the task of our senior management team is to review all of these enhancement requests, and decide what is reasonable and what isn’t, then set some priorities. Council is not directly involved in that process, but the priority-setting is based on a framework of Strategic Planning created by Council. One of the questions staff need to ask themselves and each other at this stage is – does this enhancement meet a strategic goal of the Council? Then ask if we can afford it. Which is where Council comes in.

Before these enhancement requests, the draft 2020 budget sees costs equaling a 3.9% tax increase already baked into our 5-year financial plan. These are things like increased debt servicing, annual salary increases, inflationary pressures and financing of earlier enhancement commitments already made by Council in previous budgets. Staff have brought forward new enhancement requests equaling just under another 2% of taxes. They then recommended that about half of these enhancements be included in the 2020 budget, and the other half deferred to a future year. This equals out to a draft 4.9% tax increase.

There is an interaction between the Capital and Operational budget. The interest we earn on our reserves is a revenue that is included in our operational budget, so draw those reserves down and we have less revenue. Similarly, the interest we pay on our loans is an operational expense. There is also an operational impact to many capital projects: the NWACC will cost money to heat and light, and will need to be staffed. It will also bring in revenues. Those numbers will be different for the NWACC as they are for the current CGP. These changes have to be budgeted towards.

Since we have a regulatory requirement to balance the budget at the end of the year, if we pull in more revenue (through taxes, charges for services like parking and permits, grants from senior governments, investment income, etc.) in a year than we spend (on salaries, supplies, grants, etc.) that extra money (“profit!”) goes into our reserves and helps offset future capital budget costs. The corollary to this, of course, is that a large capital budget requires us to raise taxes a bit to keep these reserves at a stable level and to pay debt servicing costs.

(I have almost completely skipped utilities in this discussion, I talked a bit about them, with fancy coloured diagrams to show how those work in this blog post from a couple of years ago)


So, this week Council will be asked in two meetings (Monday AND Tuesday nights) to review the budget, review the results of the public consultations that occurred around the budget, and provide one more public meeting where people can come and address council with their concerns regarding the budget. We will review the capital budget commitments for 2020, and will review the recommended and non-recommended enhancements. Council will then make recommendations on any changes, and staff will take those away and work on putting together the necessary Bylaws to make the budget a reality. By the end of the Tuesday special meeting, we should have a pretty good idea what our budget increase will look like for 2020, but looking at the reports, it will likely be something around 5%.

Taxes 2019

If you own a home in New West, you should have received your annual tax bill in the mail in recent weeks. If your assessment went up by the city-wide average of 9.03%, then your tax bill went up over last year by 5.28%. If your assessment went up by more than 9.03%, then your tax bill went up more. Conversely, if your assessment went up by less than 3.7%, or if it went down, then your tax bill this year is lower than it was last year. I tried to show how this works in this blog post from a couple of years ago (with the numbers from a couple of years ago, mind you).

It seems an appropriate time for me to update some of my older posts comparing New West tax rates to others around the region. I’ve done this a few times in a few different ways for several years on this blog (here, here, and here, for example), and no matter what type of analysis you do, it is clear that some local pundits continue to perpetuate terminological inexactitudes when they claim that New Westminster has the highest taxes in BC, or Canada.

Recognizing my own suspicion of bias, all of the data below comes from the BC Government reports that annually compare tax rates and burdens across all local governments, and have been doing so for a while. Of course, this data is from 2018 (Cities are only now submitting 2019 budget numbers to them), but this is the best source to compare numbers across the province. You can read them all here and make your own comparisons if you don’t like my ham-fisted Excel skills.

I am going to reiterate a point I have made before: there are many ways to compare taxes between jurisdictions. Vancouver and Surrey collect more tax overall than New West, because they are much larger. West Vancouver has lower mil rates because their average house price is much higher, Creston has a much higher mil rate because its average house value is much lower. Even the use of “typical house value” to compare taxes is biased, because some cities like New West have more people living in rental and condo buildings than some others, so a “typical house” is much larger and more expensive than the median or average household occupies. So to answer the primary question: do New Westminsterites pay more municipal taxes than residents of other municipalities, I think the fairest comparison is taxes collected per capita:

Source: BC Government statistics, Schedule 703_2018

Of the 161 Municipalities in BC, ranked from highest taxes to lowest, New Westminster (orange bar above) is ranked #71, between Parksville (#70) and Saanich (#72). In 2018 we collected $77.7 Million in taxes from just under 74,000 people, making our per capita tax rate $1,051. Province-wide, $4.76 Billion in municipal taxes was collected from 4.3 Million people, making the province-wide average about $1,150 (red dashed line above). So New Westminster residents paid $100 less per year, almost 10% less, than the average resident of BC. Our tax increase in 2019 will eat into this gap, pushing us up by about $50, but at the same time, almost every other Municipality in the province increased their taxes at a rate between 2 and 7%, so our position will not shift substantially.

Naturally, there are massive differences across the province on the proportion of taxes paid by industry and businesses, and the level of services provided by the Municipality. The Lower Mainland is a bit different than the rest of the province in the level of services we supply and the cost of delivering those services, so it may be fairer to only compare New West to our Metro Vancouver cohort:

Source: BC Government statistics, Schedule 703_2018

New Westminster ranks 13th out of 21 GVRD municipalities in taxes collected per capita. The GVRD Municipalities collect about $2.6 Billion in Municipal taxes from 2.56 Million people, for an average of $1019 per person (the red dashed line). New Westminster collects slightly more (3% more) than this average. This has changed over the last couple of years for two main reasons: New Westminster’s Capital Levy we are using to fund our aggressive capital renewal plan (lead by the replacement of the Canada Games Pool) and the regional trend where there is a much higher rate of population growth in the relatively low-tax municipalities of Surrey and Maple Ridge compared to slower growth in Vancouver and (especially) the North Shore. We can talk about correlation/causation here, because it might not be what you think…

Ask Pat: Private School taxes

Duke asked—

The two large private schools on opposite ends of the city are nearing completion. My question is will the City be receiving any property taxes from these schools? It’s my understanding the BC Libs exempted them from certain taxes.

Short version: no, they likely won’t pay property tax. But as always, there is a longer answer. And this needs a bit of a “this is how I understand things, and I think I am correct here, but am willing to hear any corrections if people have them and I will fix the record” warning.

There are two types of exemptions from paying property taxes: statutory and permissive. As you may have figured from the name, the first is set in provincial regulation, Section 220 of the Community Charter outlines uses that may be exempt from property tax: Provincial property, places of worship, cemeteries, fruit trees(!), private schools and other things. The general interpretation of this act is that the statutory exemption only applies to the building or ground used for the prescribed purpose, not necessarily the entire property.  So a church that has a large parking lot and/or adjacent housing on the same property may not get statutory exemption for those auxiliary lands, but just for the place of worship.

The permissive exemption is also what it sounds like: something cities are permitted to grant, but are not required to grant. There are limits to how we can hand these out, and they are listed in Section 224 of the Community Charter. This permission is generally limited to government-owned lands not caught up in Section 220, parts of lands exempted under S.220 that are not strictly exempted by S.220 (like the parking lot around a church), or lands used by a charity or public service that are used for a community service or charitable work, including sports clubs. The City may grant partial or complete exemptions on these lands, but it is generally limited by Section 25 of the Charter which prohibits the City from providing direct assistance to a business. Whew.

In practice, the City does a review of permissive exemptions (and reviews applications for new permissive exemptions) in September or October, and updates its Bylaw in time that those exemptions can be factored into our financial planning for the next year. The last time we reviewed them in New West was on September 17, 2018, and you can see in that report the list of to whom the City provides exemptions. Both John Knox and Urban Academy are listed as exempt under S.224.

Now back to the other part of your question, Back in 2015, the BC Liberal Government was led by a Premier who proudly boasted that her child attended the most exclusive private school in Vancouver (one that had a large swath of “Permissive Exemption” real estate) while also taking public school teachers to the Supreme Court to defend an illegal contract that kept her from having to staff public schools enough to meet reasonable classroom size standards. That government signed in to law Bill 29, which extended a Statutory Exemption to all of these ancillary lands around private schools are part of the school operation. Student housing, parking lots, skating arenas, the woods out back where the kids smoke pot; as long as they belong to the school, they are now exempt by statute.

Frankly, this change probably does not apply to either the new John Knox school on 12th street or the new Urban Academy school at Braid and Rousseau, because both are modern “urban school” designs, with very little footprint outside of the building site. The parking is underground and the play area on the roof, so there aren’t open fields of “accessory lands”. The shift from Permissive to Statutory exemption is probably irrelevant in this case, though I am not clear why the City gives them an S.224 exemption when a S.220 exemption probably applies.

That said, both schools are being built on lands that had significant commercial value, and paid commercial property taxes before the schools took over the sites. If we ballpark the two properties at (land value only) $3 Million each, then at 2018 taxation rates for commercial properties, the property tax they would pay to the City would be a little over $30,000 each per year if there was a non-exempt commercial property on that spot. Plus about $12,000 each in School Tax. Take from that what you will.

(draft) Budget 2019

I guess we knew this was going to be a tight budget year for New Westminster, as it is for most Cities in the lower mainland. The shift in MSP / employer health tax has impacted many municipalities hard, which I will talk more about below. Combine that with our aggressive capital plan, regular inflationary increases in costs, and constant demand for new services, and the tax increase is higher than some would have liked this year. That said, I actually would vote to make it a little bit higher, and indicated so to Council. Here is my rationale.

The current proposal is for a 5.28% increase in property taxes. That is about a $117/year increase for the “average” household. For perspective, the “average” household in New West is a $1.2M house that went up in value over the last year by 9%, or about $100,000. Condos went up a little more than houses overall, so the tax increase for condo owners will be proportionally higher than for detached house owners. The City has no control over that, it is just how the market works.

For the purpose of explanation, it is helpful to break that 5.28% into component parts. The numbers below are my back-of-the envelope estimates drawn from the kinda complex budget documents (you can see a staff report here), and of course the budget has not been passed yet, so the numbers may change. All that to say nothing below represents official numbers or communications, but this is close enough to an accurate breakdown to foster conversation:

1.8% is directly attributable to the shift in the MSP and employer health tax. This could be viewed as downloading: increased local government costs that will be funding something that should be paid from provincial and federal coffers. However, I generally reserve that for when we shift the burden for a service to local governments, not just the cost – an oft-mentioned (by me!) example is underfunding the provincially-funded ambulance service so that our locally-funded Fire and Rescue staff need to cover the load. regardless of what you call it ,the effect is the same. We and other cities have challenged the province to not apply this to local governments, and we lost that fight. So here we are, and need to budget for it.

If you want to take a more positive look at (spin of?) this tax increase, remember that it is a result of phasing out of the MSP system. That means the $40 or so that this 1.8% costs the “average” household is easily offset by the $1,500 the “average” New West household saves in reduced MSP fees. If that is no help, then at least recognize this is a one-time event, and that there will actually be a slight reduction in City costs next year as the final MSP phase-out occurs. That means we will be starting the 2020 budget year ahead of the game by about $300,000.

4.23% is direct growth and inflationary pressure – increased wage and supply costs related to just doing what we do every day. This goes up both because of because of inflation, and because the population City is growing at a rate of about 1.6% per year, so we need to do about 1.6% more stuff. Add to this inflation a little above the 2.0% projected CPI increase (don’t get me on a rant about how the CPI “basket of goods” does not fairly reflect the inflation of running a municipal government) and the projected 2.5 % wage growth across the region. Much of this increase is locked up in contracts with our staff, which have annual increases built into them. Of course budget time usually results in some on-line trolling of City workers. For the record, I no not think our staff is underworked or overpaid. Wages in New West are a little below the regional average for municipal governments for people in comparative roles, and our ratio of exempt staff to union staff is about 13%, which is slightly below the average of comparable sized municipalities (a fact that is directly counter to the rhetoric used by some during the recent election).

-2.46% That’s right, this is a negative. The growth part of above means that there are more properties / people to pay taxes and more services bought from the City. The taxes from new construction and increased other revenues allow us to actually reduce the overall tax rate by about 2.5%.

1.2% is related to new spending. This is all new staff positions and operational and capital costs related to things we do now that we didn’t do in the past. This is “discretionary spending”, the money we get to haggle over at this point in the budget cycle. And haggle we did.

The reality for us on Council is that people rarely ask us to do less. Every week, people come to Council asking the City to do something more, be it paint more crosswalks or plant more trees or give more to a local group to help run a festival or provide homelessness outreach. Nine times out of ten, we want to do it, and often I see the strained look in staff’s eyes as they are the first to recognize that we don’t have the capacity in our budgets or room in staff work plans to do this, and they are going to have to come back to Council with hat in hand, asking for the resources to fund what Council has already said we want them to do, or to ask us which of the existing programs or services we should cut. It is only the week of budget that everyone asks us to spend less, but aside from “finding efficiencies”, I never hear specific programs that people want us to cut.

The “nice to haves” in the budget reporting this year added up to more than $2 Million, and would have put us well over a 7% tax increase. This means we did not fund some of the things I would have loved see happen this year in the City.

To give you an idea of what kind of new spending we did approve, here are a few line items from the report:
• $122,000 (equal to 0.15% tax increase) to hire two new staff to ramp up the tree maintenance and planting program as we move forward with Urban Forest Management Program;
• $80,000 (0.10%) to bring in some expertise to guide us through our Truth and Reconciliation process;
• $225,000 (0.28%) to run the QtoQ ferry service year-round;
• $54,000 (0.07%)for a part-time Facilities Project Manager to help us make budget and timing on a couple of our bigger capital projects;
• $100,000 (0.13%) for a full time program coordinator to carry the Intelligent City program forward for one more year;
• $65,000 (0.08%) for a Special Events program coordinator to help for community partners to run events like Fridays on Front.

0.5% The final piece of the budget increase this year is the Capital Levy. We introduced this special line item last year as a buffer for our increasingly extensive capital plan. The big item is, of course, the replacement of the Canada Games Pool and the Centennial Community Centre, which will blow a $100 Million hole in our budget. This is a big enough story, and this is already a long enough blog, that I am going to hold off commenting more on the Capital Plan until a follow-up blog. Short version: I think we should be putting more into this Capital Levy and keep it at 1% this year, but the majority of Council did not agree.

What we have now is a proposed budget framework, subject to some last-minute number crunching and adjustments by finance staff. There will be a budget bylaw (and new 5-year financial plan) prepared, which will come to Council for deliberation, though the real debate happened in workshop last week (see the video here). Of course, we always invite public comment and delegations to come speak to the budget and let us know how much they appreciate the hard work staff and Council do to manage the City’s finances responsibly. Alternate opinions are also welcomed.

Bad Data

I never want to react to the Fraser Institute. The easy ad hominem attack is that they are the Canadian propaganda wing of Koch Brothers enterprises, and their attempts to shift public policy in Canada should raise concern, but the more substantive attack is that they produce terrible reports that would not earn a passing grade if they were handed in as an Economics 101 term paper. They are bad at data, so it is best if we ignore them.

Alas, I was asked by an intrepid local reporter to comment because the City of New Westminster is made to look fiscally irresponsible in their latest fresh-off-the-presses piece of decontextualized tripe, so I did a bit of a dive into the numbers. This turned into several hours of trying to reverse-math their numbers, because like the failing university economics students they resemble, they don’t actually provide raw data or point clearly to what their data sources are, instead providing derived numbers without the benefit of showing their calculations. They are bad at reporting data, and we should probably ignore them.

I dug around in the BC Government website they link to as a data source (this one), and after figuring out how they got all of the population for 2016 wrong (using projected estimates instead of readily-available Census data), I started to dig through the various tables and repeated calculations until I got results mimicking theirs. They primarily used “spending data” from this table, and “revenue data” from this table. But they clearly didn’t know (or didn’t care) that New Westminster’s data includes the financial reporting by our Electrical Utility. They are bad at interpreting the data they have, so it is best we just ignore them.

For context, New Westminster operates its own Electrical Utility. It has since before BC Hydro existed. We hold on to it because it is a great deal for the residents of New Westminster. Using 2016 numbers to be consistent with the Fraser Institute report (See Page 90 of this report for the utility’s 2017 numbers), our Electrical Utility sells about $45,000,000 worth of electricity to residents and businesses in the City, at the same rate (more or less) as those customers would pay BC Hydro if they were in another Municipality. It costs the utility about $33,000,000 to purchase that electricity from BC Hydro at bulk wholesale rates. About half of that difference goes into operating the utility (paying staff, buying wires and building substations) and the other half is paid to the City as a dividend. We are the only Municipality in the lower mainland that does this, so we are the only municipality that includes these numbers in their expenses and revenue tables. This is important context. The Fraser Institute is bad at context, which is why we would all be better off by ignoring them.

Because of this bug in the data, their report suggests that New Westminster has “the second highest municipal spending” per capita, along with “the second highest municipal revenue” per capita. They even have bar charts to prove it:

The problem being, New Westminster’s electrical utility “spends” about $38 Million a year, and it generates about $45 Million in revenue. If you take this into account, those bar charts look very different:

The shorter and more accurate story here is that New Westminster (outside of the electrical utility) spends slightly above the regional average on a per capita basis, and collects slightly less than the regional average in taxation and fee revenue. Think about that for a minute.

“Spending” in the local government context means putting police officers on the street, mowing lawns in our parks, and providing swimming lessons to your kids. The money we spend is providing services to our residents, and we do that at a slightly higher rate than the regional average. At the same time, the revenue we collect from our residents in the form of taxes and fees is lower than the regional average. An alternate Fraser Institute headline may be: New Westminster delivers more for less!

Ironically, part of the reason we deliver more for less is the electrical utility that can buy electricity for wholesale, sell it for retail, and provide a dividend to the City which we can use to provide services that would otherwise need to be paid for through taxes. Arguably, having an electrical utility is the most entrepreneurial thing we do, and is something that the entire “run government more like a business” Fraser Institute crowd would normally celebrate.

There is more in this report, including tables showing the City’s residential taxes are below average for the region (12th highest of 17 municipalities), and our debt servicing costs are average, but that kind of story – “City is about average” – doesn’t make for a very exciting headline.

Alas, New Westminster is just kind of average. And when it comes to managing finances, this is not a bad thing. Every financial decision is about balancing the cost with the priorities our residents and businesses expect us to address. I am proud of the level of service we provide in New Westminster, and our ability to do that while keeping taxes below the regional average.

Ask Pat: DCC, MFA, WTF?

This is not a real “Ask Pat”, but I was recently shown this Facebook Post, and I asked the author if I could answer it at length on my blog. I think it provides a good opportunity to open up a bit of how municipal financing works, from my decidedly non-expert-but-required-to-learn-enough-to-make-decisions viewpoint, and (in a roundabout way) asks what I think is a fundamental question about financing municipal infrastructure.

So here’s a question I’ve been pondering for a while about the housing crisis. I’m not sure exactly when the Local Government Act was amended to change the way municipalities generate revenues to cover the cost of infrastructure to support growth. The current method is called Development Cost Charges (DCC’s).

In conversations with a retired city controller I learned that up to the implementation of DCC’s cities would issue Municipal Bonds to generate the funds needed to cover these costs, build the infrastructure and then taxpayers would collectively pay for the costs through tax payments. In the early 70’s the Province created the Municipal Finance Authority to streamline this process so that hundreds of small communities didn’t have to be floating bonds to generate their infrastructure capital they now have expertise and experience at the MFA.

All this changed with the enactment of provisions in the Local Government Act for DCC’s which are essentially prepaid taxes paid to municipalities to cover the costs of roads, sewer and water installations and parks associated with the new development whether that’s an addition to your house or a 50 storey condo development.

OK so what? Well now the purchase price of that newly developed housing unit comes preloaded with tens of thousands of dollars of prepaid taxes. For arguments sake let’s use $50K as a nice round number, please bear with me for this illustration. So your purchase price includes this $50K, which by the way the developer probably has to finance plus any profit margin the developer might add and so additional costs, but lets work with $50K for now. At 5% mortgage interest that increases monthly payments by about $290 and adds over $37,000 in additional interest to the mortgage. With me so far? Now let’s add property transfer taxes and these days for a lot of people government mandated mortgage insurance as well.
So we’ve transitioned away from publically financed infrastructure growth to growth financed by individual families. What used to be money borrowed at preferential interest rates through government Bonds is now financed by homeowners through their local BANKS, the same ones that continue to report record quarterly profits year after year after year.

So what about the cities. Well since 2008 Canadian Municipalities collectively have managed to sock away over $100BILLION IN CASH while continuing to press Federal and Provincial Governments for cash to help them cover the costs of their suppossed infrastructure deficits. It seems to me that while its easy to blame ‘foreign investors and speculators’, at least some of this crisis needs to be laid at the feet of our governments at every level.

My first impression is that this discussion conflates a couple of things, and that is leading to a bit of confusion. Here is my understanding of the relationship between DCCs, Municipal Bonds, and the MFA.

The idea behind DCCs is to charge the capital cost of infrastructure expansion to the persons who benefit from that expansion. DCCs are charged when there is growth in residential density (a 3-story building becomes a tower, a house becomes a set of townhouses), and are meant to assure that a fair share of the cost of building bigger sewer pipes, bigger water pipes, buying new parks space, etc. is covered by the new population that fills that density. The City charges a DCC based on the square footage of the new density, and presumably the developer passes that cost onto the purchaser of the property, who is the ultimate beneficiary of the new infrastructure. In New West, we have DCC Bylaws for Transportation, Water Supply, Sanitary Sewer, Drainage, and Parks.

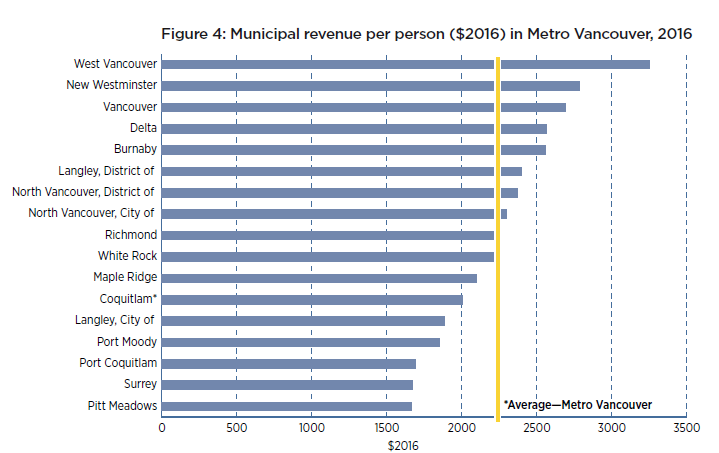
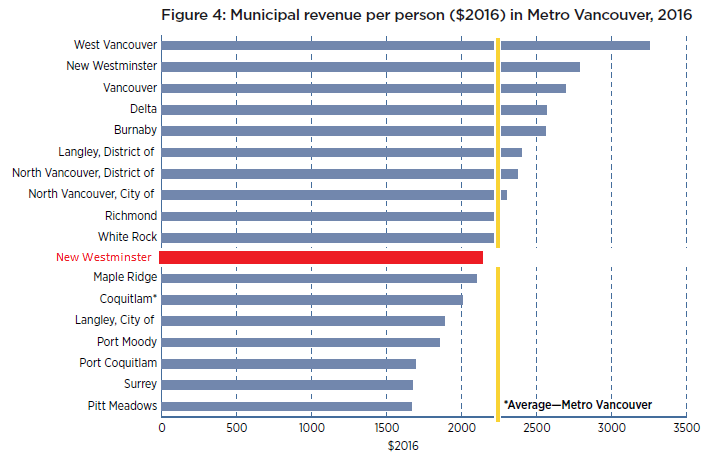
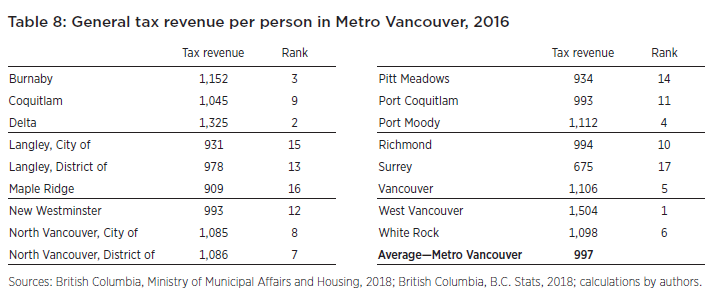
At current rates, a new 1,000 sq ft apartment in Downtown New Westminster would include about $5,140 in DCCs. That would be $1,120 for Transportation, $60 for drainage, $250 for water, $430 for sanitary sewers, and $3,290 for Parks. Note than a brand new 1,000 square foot apartment in New Westminster sells for something over $700,000. If you believe that the cost of new housing is directly correlated to the cost of building it, then DCCs can be said to raise the cost of any single unit by much less than 1%. Although they cumulatively do a lot to reduce the cost of infrastructure upgrades for current residents, I don’t think DCCs are a significant cause of the current housing affordability crisis.

It is important to note DCC money is not thrown into general revenue, but is put into specific reserve funds and earmarked for defined projects under the category for which they are collected. This is fundamental to the DCC regulation – they must be spent on improving infrastructure above and beyond what would have been spent if the density was not permitted.

For obvious reasons, DCC money is not spent the day it is collected. A City is a complicated thing, and we cannot upgrade a section of sewer on a whim. Instead, we need to plan out years, sometimes decades, in advance so that all parts of the system work together. When collected, DCC money mostly goes into a reserve fund and is drawn out when the works happen. Sometimes we can borrow against a reserve fund (if the sewer needs to be upgraded today, but a DCC has not been collected yet and we are confident it will be collected in the near future), but even that is a bit deeper than we need to go here.

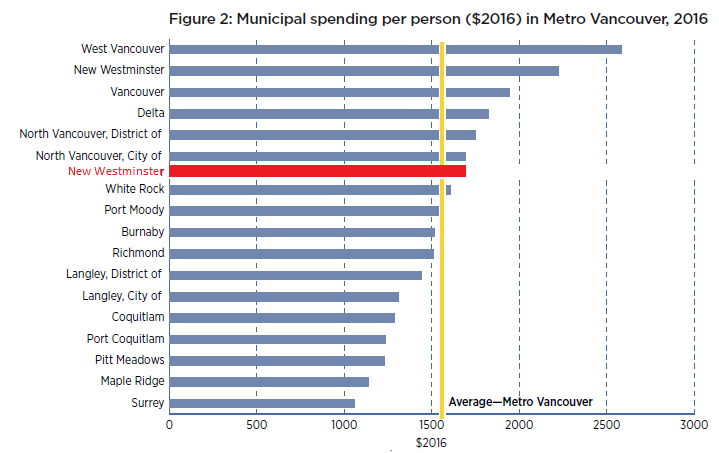
DCCs also don’t pay for all infrastructure upgrades. Even if there was no density increase in a City, we would have to replace your water lines every 50 years or so, pave your road every 10 years or so, etc. That money comes from property taxes (in the case of roads and parks) or part of your water/sewer bill (in the case of the pipes). We collect a little more in your water bill than it costs us to run the water system, and set that aside into those same reserves to pay for maintenance and upgrades of the system when they are needed. Alternately, we can pay for the upgrades when they come up by borrowing money, and charge future users that cost (plus interest). As you will see, we do a little of both based on what makes the most financial sense at the time.

That is how we can have both $120 Million in our reserves and $65 Million in debt. I hate using household finances as a model for explaining municipal finance (they are two very different things), but this is similar to having money in an RESP account at the same time as holding mortgage debt: we do it for rational reasons related to how the financial and taxation systems are designed. We didn’t invent global capitalism, but we operate within it. If you have an alternative system that more fairly distributes capital, send me your e-mail and I’ll subscribe to your newsletter!

This does raise what I think is the fundamental question about how we finance public infrastructure. If we want to build, say, a new $100 Million recreation complex, do we save up enough money to pay for it before we build it, or do we build it on debt and pay it off over time? There are compromises to both.

In the first case, everyone pays today into a reserve fund until we hit the number that we need to build the complex. It will take several years, and for all that time, the taxpayers of the City will be paying into the fund but not receiving the benefit of those payments until some point in the future when the complex is completed (if they still live in the City at that time). Is that fair to them?

In the second case, the complex gets built first, and the people who have an opportunity to benefit from that complex pay taxes for it while it is being used. Of course, they have to pay a little more this way because the debt needs to be serviced over the period of time it takes to pay it off. Is that fiscally prudent?

(It sounds to me like you would prefer more of the latter in the case of financing infrastructure related to new growth, as it would result in the City borrowing more from the MFA or Municipal Bonds and spreading the cost evenly among all taxpayers, whereas the former puts more burden on the new home purchaser which they would, presumably, borrow from a bank to finance. Please correct me if I got your argument wrong.)

There are other factors that need to be considered, and this is why most local governments do some combination of both. It matters what interest rate a local gov’t can earn on its reserves vs. what interest they pay servicing the debt. In this low-interest era, we may choose differently than back in the high-interest 70s. These rates are also related to your financial status: a City with $100 Million in the bank can get a lower rate than a City with $100 Million in debt. There are also significant complications local governments have to go through to borrow beyond their 5-year financial plan. Add to this uncertainties like inflation of construction cost and other capital needs that may pop up in the same time period. The practicality is that we sometimes need debt, and we benefit from strong reserves. 

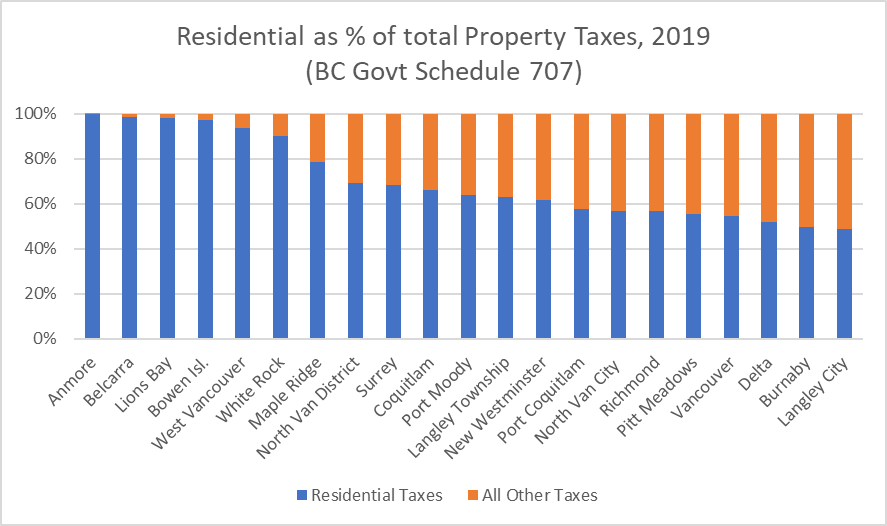
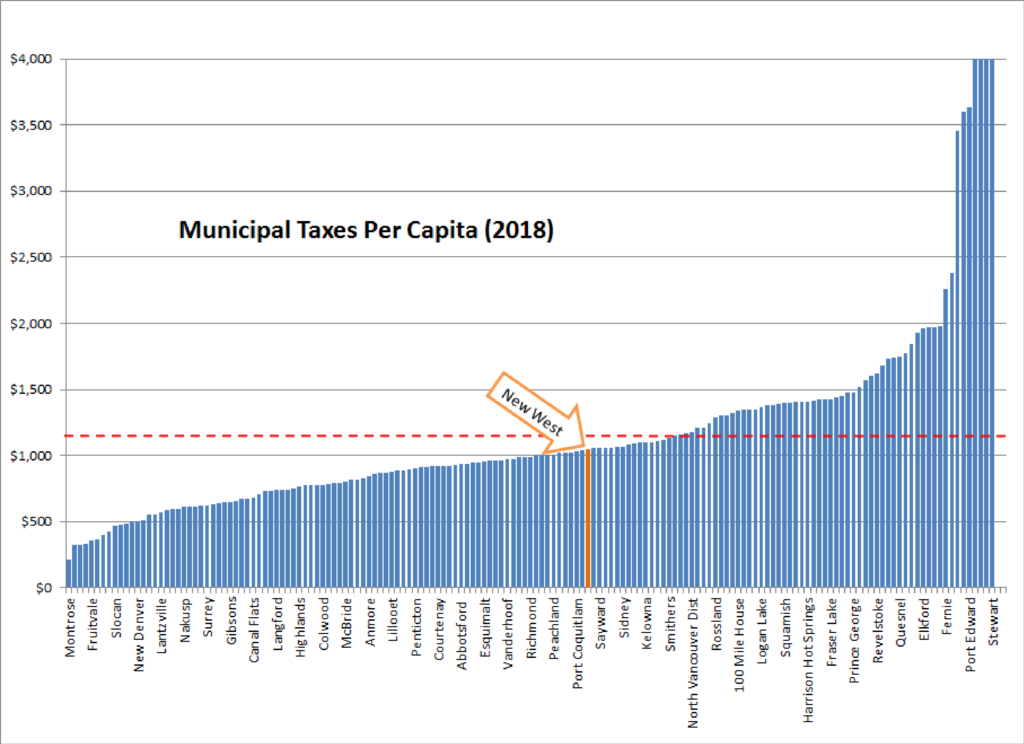
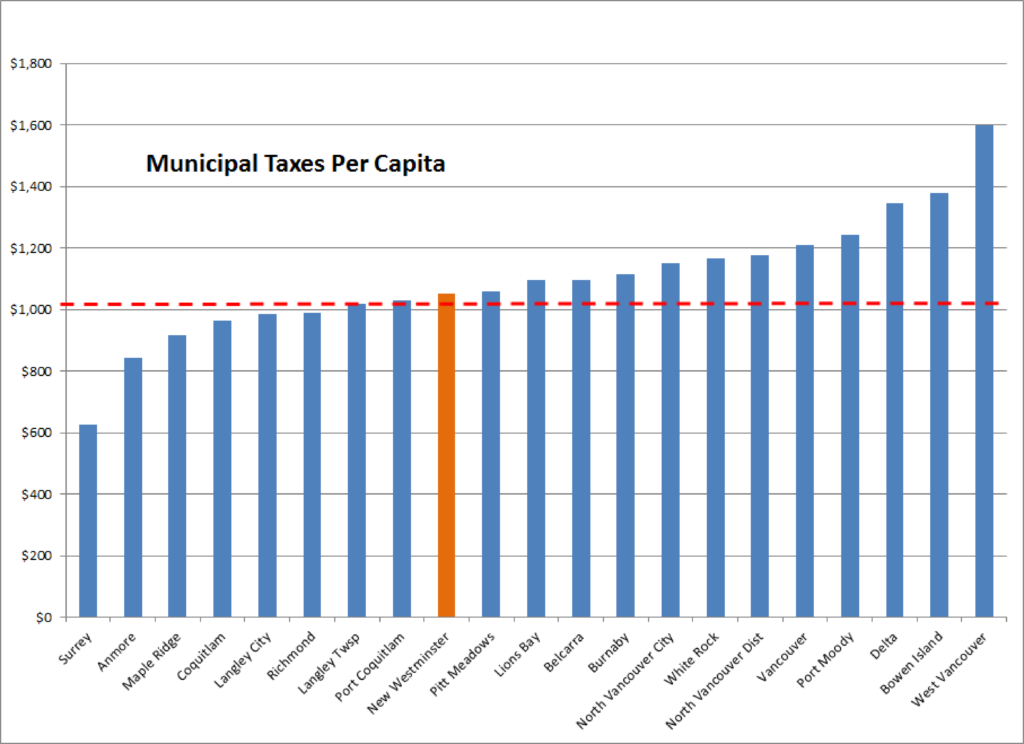
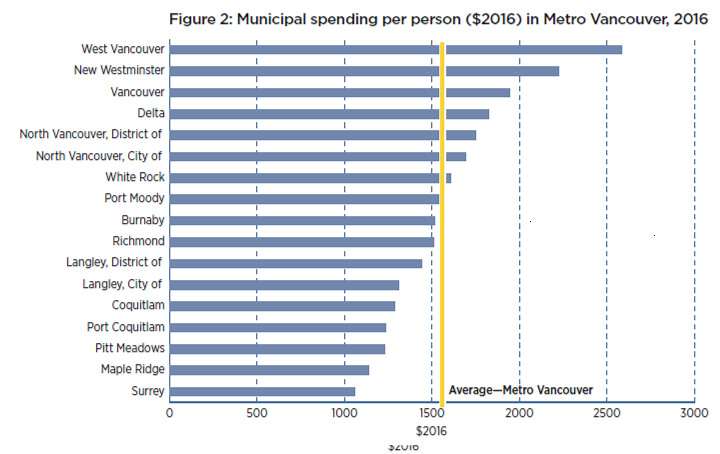
I don’t want to get into the discussion here about us going to senior governments with hats in hand asking for their help in funding public infrastructure (this blog post is already much too long). However, I can summarize by saying local governments are responsible for the maintenance and upkeep of about 60% of public infrastructure in Canada, and we directly receive about 8% of all tax revenues. Without help from senior governments, little of your public infrastructure would be sustainable. The Infrastructure Gap commonly measured across Canada to be more than a hundred billion dollars is measured above our existing reserves; but I digress.

The Municipal Finance Authority is, essentially, a Credit Union. Local Governments can borrow money from the MFA at rates better than we can get from commercial banks, and we can save our reserves with the MFA and receive a pretty good return. Most years, New West makes a little more in interest on our reserves than we spend in interest on our debt (though market fluctuations obviously impact this equation). As you note, the MFA structure has largely replaced Municipal Bonds issued by individual Local Governments. In essence, the MFA issues Bonds on behalf of all its member Local Governments. I am really not an expert on this part of finance, but I would assume that the reason we use the MFA instead of issuing our own Bonds is that the interest rates the MFA can offer (because they are a large, diverse organization) is much lower than we would have to pay to make the Bonds attractive in this razor-thin investment market.

But perhaps more to the point, the Bonds vs. MFA issue is something completely separate from the DCC discussion. DCCs are taxation – they generate revenue for a Local Government. Bonds are simply debt instruments; they are loans which we would have to generate revenue (taxes) to pay back. This takes us right back to the fundamental question that we have already asked – when should a government collect the money to pay for new infrastructure? Before it is built, or after? In reality, we do a little of both, and use the financial instruments available to us under the Local Government Act to hopefully strike a fair and responsible balance between the needs of today and the needs of tomorrow.

Ask Pat: Taxes – the western suburbs edition

westvandude asks—

I read your property tax comparison article as I was looking to compare West Vancouver to City of Vancouver taxes. For instance if we say what is the total tax paid on a $2.5 or $3 million house in either community (so property tax, garbage, sewer, water, etc) as I always thought City of Vancouver was more expensive…. when you compare Vancouver streets potholes and snow removal it seems Vancouverites are getting ripped off. Where would I find a comparison for total taxes for same value houses?

Hey, wait, this isn’t a New West question! It also sounds like you want me to answer one of those questions that a few minutes on Google could answer. That link I just used is a little old, but fresher information is pretty easy to find. For example:

Go to the City of Vancouver Property Taxes webpage, and it gives you a pretty good summary of what your Mil Rates are, and where they go:

taxes1

Unfortunately, no such page exists that I can find on the West Vancouver property taxes webpage.

taxes2

To find the Mil Rates, you need to dig a bit through the Bylaws until you come upon Bylaw No. 4885, 2016, where the Mil Rates Rates are set out:

taxes3

If we can ignore Metro, School, and other property taxes that don’t go to the City and are set provincially or regionally, on a house assessed at $2.5 Million in 2016, you paid $3,700 to West Vancouver (2.5M/1,000 x 1.4758), and $3,900 to Vancouver (2.5/1,000 x 1.56168). Of course, we also have to, just for a moment, put aside the absurdity of the phrase “$2.5 Million house in West Vancouver”.

Utilities are more complicated. West Van charges Quarterly for water and sewer. Water has a $60/qtr base charge, and rates that go from $1.15 to $1.93 per cubic metre of water depending on how much you use. Sewerage further costs you $32/qtr plus another $2 per cubic metre of water you use.

Vancouver bills for water on a Ternary basis, with about a $31 base charge, and rates that go from $0.95 to $1.20 per cubic metre of water based on season. Sewage costs a further $0.87 per cubic metre of water use. So it sure looks like for most users, Vancouver water rates are quite a bit lower, but it depends completely on your use. If you have typical household use, Vancouver is several hundred dollars cheaper per year.

Notably, West Vancouver charges homeowners a “Drainage Levy”, which is $400 per year for a typical home. Vancouver does not have a charge like this. That extra $400 charge easily exceeds the difference in property taxes between the Cities. And also points out how the deeper you dig into the comparisons between how different cities pay for their public services, you discover that simply saying “Vancouver has higher taxes than West Vancouver” is a bit of a meaningless phrase. This is why I tried to compare what cities collect in taxes per capita, using data normalized a bit by the provincial government. West Van looks pretty expensive when you look at it that way.

Finally, about the roads and pothole thing, you can look at the 2016 West Van budget, and see they have about $100M in revenue every year, and spend about $4.5M on all engineering services (about 2/3 of that spent on roads). Vancouver’s 2016 Budget showed $1,260 Million in revenue and spending of about $75 Million in all engineering services – so about a 33% higher proportion of revenues. Of course, the roads that Vancouver spends money fixing are way more likely to be used regularly by a West Vancouver resident than vice versa. Also note that Vancouver has (almost) the most roads by area and the most road lane kilometres per capita than any City in British Columbia, where West Vancouver has relatively sparse roads. So we are, once again, comparing apples to pineapples here.

New West taxes? We are about average per-household in the region, and are well below average on a per-capita basis. And the potholes this year are terrible, despite the $4.5 Million spent on asphalt annually. That December snow event was pretty hard on asphalt, and that is going to cost us.

Ask Pat: $1 Transit?

Terran asked—

Hey Pat,
Hope I’m allowed to still ask questions even though I don’t live in New Westminster anymore. (I’ll be back once affordability comes back)

Translink recently started asking about transit fares again. This was a long time promise for the compass card that we could better manage the system. The survey is quite overly simplistic but that’s not my question more concern.

My question stems for the comments below the Facebook post they have for the survey. The idea of $1 transit fares comes up. Considering only ~35% of the budget comes from transit fares could this actually be a realistic option? I know I would switch from using my car if I could get to work for only a $1. Would the increased ridership even come close to off setting the huge loss in revenue? Is there even a way to know?

Sure, I’ll give you one free question since you used to live in New West. Wait – was that your question?

As you mention (and I talked about a bit a few weeks ago), TransLink is going through a Fare Review process right now. This is likely in response to the integration of the Compass Card as much as to a newfound opportunity for the next stage of system growth, as the Mayor’s Plan for a decade of capital investment may be back on track.

This review is not intended to boost or reduce fare revenues, only to re-jig the system to make it work better; to make it more “fair” or more user-friendly. The working model is that any adjustment would result in about the same revenue from fares, it will just be collected in different ways. The survey therefore was designed to collect people’s feelings about fare structures such as whether people who travel farther should pay more, or the entire system should be a flat fee, but is basically silent on what the actual flat fee or distance charge would be.

What you are suggesting is not just a “flat fee” model, but one that sets the fee quite a bit lower than it is now, in hopes that it will boost ridership. Considering the purpose of the survey, what would that rate have to be?

TransLink receives a little more than 1/3 of its operating revenue from the farebox, or about $510 Million of a $1.4 Billion budget. Aside from roads and bridges and all the other things TranLink does, they annually have about 240 Million journeys on the multi-modal transit system, or 360 million boardings (obviously, some portion of journeys results in more than one boarding, as a person may transfer from SeaBus to the SkyTrain, or from one bus to another on a single journey). So depending on whether you want to issue transfers or not, you would need to charge $2.15 per journey, or $1.45 per boarding.

So a dollar won’t be enough, but would this simple and cheap fare boost ridership enough to make up for it? At current service levels, there would need to be a doubling in the number of journeys on the system, or a 45% increase in boardings. Anyone riding a SkyTrain during rush hour or standing on a 106 recognizes this is not viable without a significant increase in service levels, which would require investments in the capital part of operations (buying more trains and buses), not just increased operational costs.

Perhaps there is some wiggle room in the idea of flat $2 fares per journey, one might speculate that this would provide a 7% increase in ridership to make up for the lost revenue per ride, but that brings us back to the fairness question: should a person riding the 106 from Columbia Street to Uptown pay the same amount as someone riding SkyTrain from Surrey to Downtown Vancouver? Which type of journey are we trying to incentivize more? These are the questions the current review is trying to address, even at a relatively simple level.

Calculating an optimum fare, one that incentivizes use but also provides enough ridership to maintain a system, is some difficult calculus, even putting aside the political implications of increasing the various tax subsidies to the system (or the massive tax subsidies to the alternatives). I don’t think we are going to get there through this fare system review.

And seriously, we really need to talk about how much you are spending on your car now. If $1 fares would sway you, perhaps you might want to crunch the numbers and see where $2.15 fares put you, financially. The sad reality is that, regardless of how much we subsidize cars, they are still surprisingly expensive to operate if you do the actual math.

Ask Pat: Anvils and elephants

Duke of Belyea asks—

Hi Pat, perhaps the notion of the Anvil Center being a white elephant could be dispelled if you or the City could show the actual revenue/expense numbers for the facility.

First, on the premise, I disagree with you. Second, on the solution, I wish it was that simple.

I do not think critics of the Anvil Centre (or indeed critics of Council) will ever be convinced that it is anything but a white elephant. Specific residents of Coquitlam will write occasional long-winded factually-challenged screeds to the Record for some time, using the Anvil as an example of New Westminster’s failures, regardless of any success seen around or within the Anvil. That is just political bullshit theatre we need to live with, and facts will not change it, because the Anvil is more than building, it is a totem around which previous elections were fought and lost. Some people never stop fighting yesterday’s battles.

The premise further relies on measuring the success or failure of Anvil on a balance sheet of effort-in & revenue-out. I simply don’t see it that way. To explain that, we need to clarify what the Anvil is, and what a City does.

For one building, The Anvil Centre has purposes to fill a long paragraph (noting, for full disclosure, that I was not on Council when these conversations and decisions were made):

The Office Tower was conceived as an economic driver for Downtown, but since the City sold it off for more than it cost to build (success?), the City no longer had much say in how it is operated. The owners have every right to set their rent and manage their incentives any way they see fit, regardless of whether it serves the larger purposes of the City. The restaurant space is finally leased, and although later than we may have liked, I think we will have an operating restaurant that fills a niche in the City, brings attention to Columbia and 8th, and becomes a revenue driver for the City. I’m not sure how you measure the success of the shift of the Museum, Archives, and Lacrosse Hall of Fame to this venue. They have been relocated from various other locations to a central cultural hub, which also freed up space in those other venues. The New Media Gallery has quickly become one of the region’s most important artistic venues, drawing visitors and raves from around the region. Conference services are on or ahead of target for bookings and revenues, the program at the Theatre is (slowly) coming along, and the numerous arts and culture programs on the 4th floor are similarly starting to fulfill the original vision for activating the Arts in our City. All of these tangible purposes are wrapped up in the larger benefit of turning a windfall (the DAC funding) into a community asset to replace a failing retail strip at the renewed gateway to our central business district.

This brings us to your solution to the inevitable political push-back: a simple spreadsheet that outlines the costs and recoveries from the Anvil. I suppose it is doable, as the City’s Financial Plan and backing documents are openly reported, and every input and output is buried in those spreadsheets somewhere. But it would be really complicated, simply because the Anvil is not a single entity operating separate from the rest of the City.

The museum and archives have always cost money to operate; moving them to the Anvil doesn’t change that. The old Hall of Fame site is now home to a very popular and revenue-generating recreation program: is that success part of the Anvil, though it is located at the Centennial Community Centre? The City’s Arts Programmer works out of the Anvil, but also administers the City’s Public Art program, which is funded through a combination of fees, sales revenues, and taxes – how does that balance sheet overlap with Anvil’s? Even the Conference Services, which are a revenue-generation aspect of the Anvil, share resources with other departments (especially the theatre and our catering contractor), and rely on an integrated operation to be successful. There are staff who spend part of their time doing Anvil-related things, and part of their time working at other facilities, just as the toilet paper and photocopier toner at Anvil are bought as part of City-wide operations. The tax revenue for the office tower is higher than it was when the space was a one-story retail space, but that tax enters general revenue, and needs to be measured against opportunity cost if a private developer had taken over that site… the list goes on.

I guess it sounds like I am creating a list of excuses of why not, instead of addressing your original concern. Lyrical gentlemen from Coquitlam will accuse me of “spinning” the facts here for political reasons – the same way they would accuse any spreadsheet produced of doing the same thing. So if you want a spreadsheet to solve a political problem, I suggest it won’t work. So why spend valuable staff time producing it?

I tend to agree with one idea buried in your premise, and maybe an answer to that last question: we need to find a better way to share our financial information in the City. Although all reporting is “open”, I am afraid our efforts towards “transparency” is a little clouded by the complicated way that Public Service Accounting Standards are regulated and performed. Even as a City Councillor exposed to this stuff all day, I am sometimes challenged to create connections between line items in spreadsheets. There is a lot of Accountant Talk here, and with all due respect to the profession, they are no better than others at explaining to lay people just what the hell they are doing. I’m not sure what the answer is from a public engagement viewpoint, but suspect (hope?) we can do better. I’m just not sure it will ever be enough to satisfy some Letter-to-the-Editor authors, and maybe that shouldn’t be our goal. However, we do need to find ways to translate our financial reporting so residents and businesses can be confident that their money is being spent wisely.

I am pretty sure of one thing: any honest accounting would reveal the City spends more money on operations at the Anvil than it receives in revenue from Anvil operations. Just as it spends more money on the Canada Games Pool than revenue earned, or the all-weather playing field at Queens Park, or the Queensborough Community Centre, or the Library. I suppose there is a discussion that could be had about which of these operations community assets would need to show a financial profit to be considered “successful” in the City, but I don’t think that is where you were going with this question.

I also think there are improvements we can do to make Anvil run better, especially in opening up the first floor to more public use and making the entire centre more inviting. That is an ongoing discussion, and one very much worth having.

Tax time – 2017 edition

Assessments are out, everybody lucky enough to have entered the housing market lottery prior to about 2008 is discovering how much their nest egg has expanded in the last year, and even to the lucky winners, this is at times disconcerting. Strangely enough, people who have just discovered that have an extra couple of hundred thousand dollars in tax-protected equity they didn’t know about are concerned about the impact on their Property Tax. People are funny that way.

I wrote a piece several years ago about how property tax relates to your assessment increase, and last year provided a handy graph showing how your assessment increase vs. the average city-wide assessment increase results in different increases in your taxes.

This year, the Mayor of Coquitlam used Facebook to send essentially the same message, and New West blogger and noted Hawaiian star-coder Canspice wrote another piece with a slightly more updated example of how the system works compared my older one. So I won’t tread over all that again, but short version is your Municipal taxes won’t go up nearly as much as your assessment.

My incredibly average house’s value went up 30% this year, and the average for New Westminster was 28.5%, so my property tax bill will go up 2.5% plus whatever increase Council decides is required to pay the bills in 2017 (now looking to be just under 3%, but not yet confirmed). If your home went up 25.5% in value, your taxes would be exactly the same as last year. If your home went up less than 25%, your taxes are going down.

However (and here is another important point people often miss), this only relates to your Municipal taxes. When Council decides it needs to collect 3% more tax revenue to balance the budget, we adjust the mill rate to increase our revenue by 3%. However, Municipal taxes are only a little more than half of your Property Tax bill. You may remember these line items from last time you paid your taxes:tabletax

In New West (and this varies between Cities for reasons that will soon become obvious), about 60% of your Property Tax goes to the City, the other 40% goes to other agencies, and the City has no control over what the rates are for those taxes.

Your 2016 property tax in New West broke down into these categories, with the Mil rates shown. Only about 60% goes to the City
Your 2016 property tax in New West broke down into these categories, with the Mil rates shown. Only about 60% (the blue bit) goes to the City.

The School Taxes (for a New West residential property, this is about 30% of the total you pay) are set by the Provincial government. They are based on a Mil rate, like your Municipal taxes, and like them, the rate is different in every City. Generally cities with higher land values have lower mil rates (West Vancouver is 1.026, Quesnel is 3.698), and the rates are adjusted every year. After that, I honestly have no idea what formula they use or what their goals are towards equity across the Province. According to the Ministry, they are raised every year “based on the previous year’s provincial inflation rate”, but I am not really able to confirm or refute that idea. I have never seen a letter written to the newspaper complaining to the province that School Taxes are going up.

There are also two regional charges attached to your Property Tax bill, again not directly controlled by the Municipality: those to support the operation of Metro Vancouver (GVRD) and TransLink (GVTA).

The Metro tax (Mil rate 0.0563) is solely for regional government operation, and is separate from the utility charges that makes up most of Metro Vancouver’s revenue. The Metro Vancouver board (which is every mayor in the region) negotiates that rate every year based on needs, and it is the same Mil rate across the region, so people in West Vancouver pay much more per household than people in New West, as their property values are higher.

The TransLink Mil rate (currently 0.2834) is determined by the TransLink board, with approval from the provincial government and within the confines of the provincial regulation that governs them. This rate is , again, flat across the region, meaning West Vancouver and Vancouver pay more than New West and Langley per household. This provides about 20% of TransLink’s revenue, and this is the heart of the long battle between the provincial government and the mayors of the region – the Province would prefer that new TransLink revenue to come from increases here, the Mayors have a long list of alternate sources they would prefer, from sales taxes to road pricing to carbon tax. But let’s not go down that rabbit hole just now.

There are also two small charges controlled by the provincial government for the benefit of local governments. The BC Assessment Authority (BCAA), who determines your land value, is funded wholly through Property taxes, and the Municipal Finance Authority (MFA) gains some operational funds through a very small Property Tax charge (20 cents for a $1,000,000 house). Both of these are collected with Mil rates flat across the province, so the average West Vancouver resident pays much more than the average Quesnel resident, with New West somewhere in the middle.

Finally, the City’s new Property Tax Estimator gives you an idea of what your actual assessment means to your tax bill, assuming that Council approves a 2.98% tax increase. It also provides an interesting break-down of how the City’s revenues are distributed between departments, giving you an idea of what you are buying with your Property Tax, and how much you are paying for each.