Taxes & the CPI

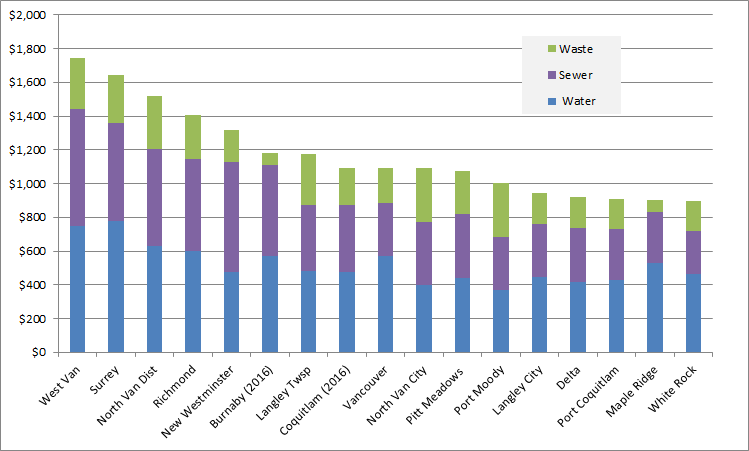
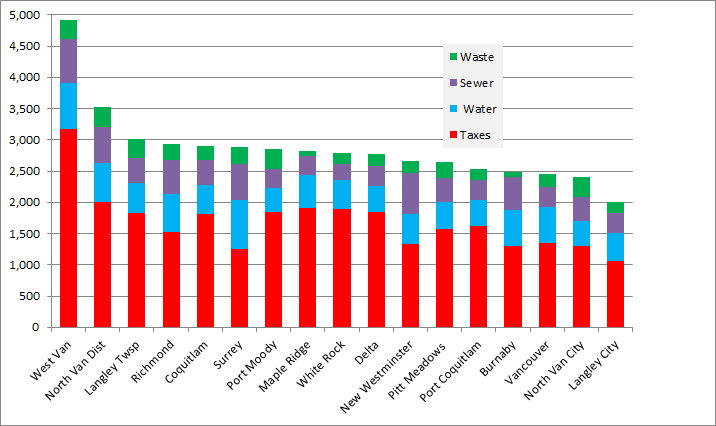
We are through the annual budgeting cycle at City Hall, our 2016-2020 Financial Plan passed, our tax increase bylaw adopted with a 2.73% increase for 2016.

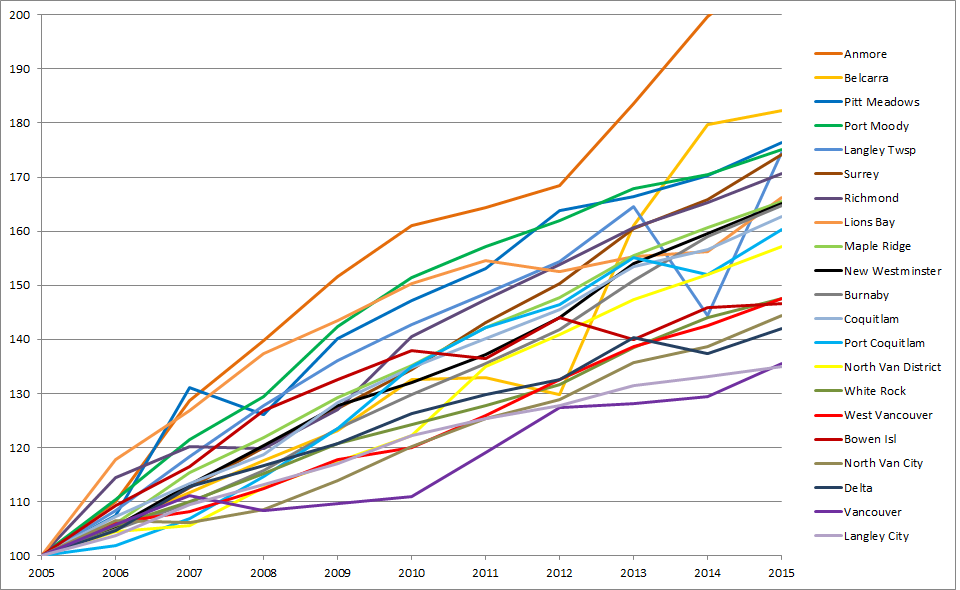
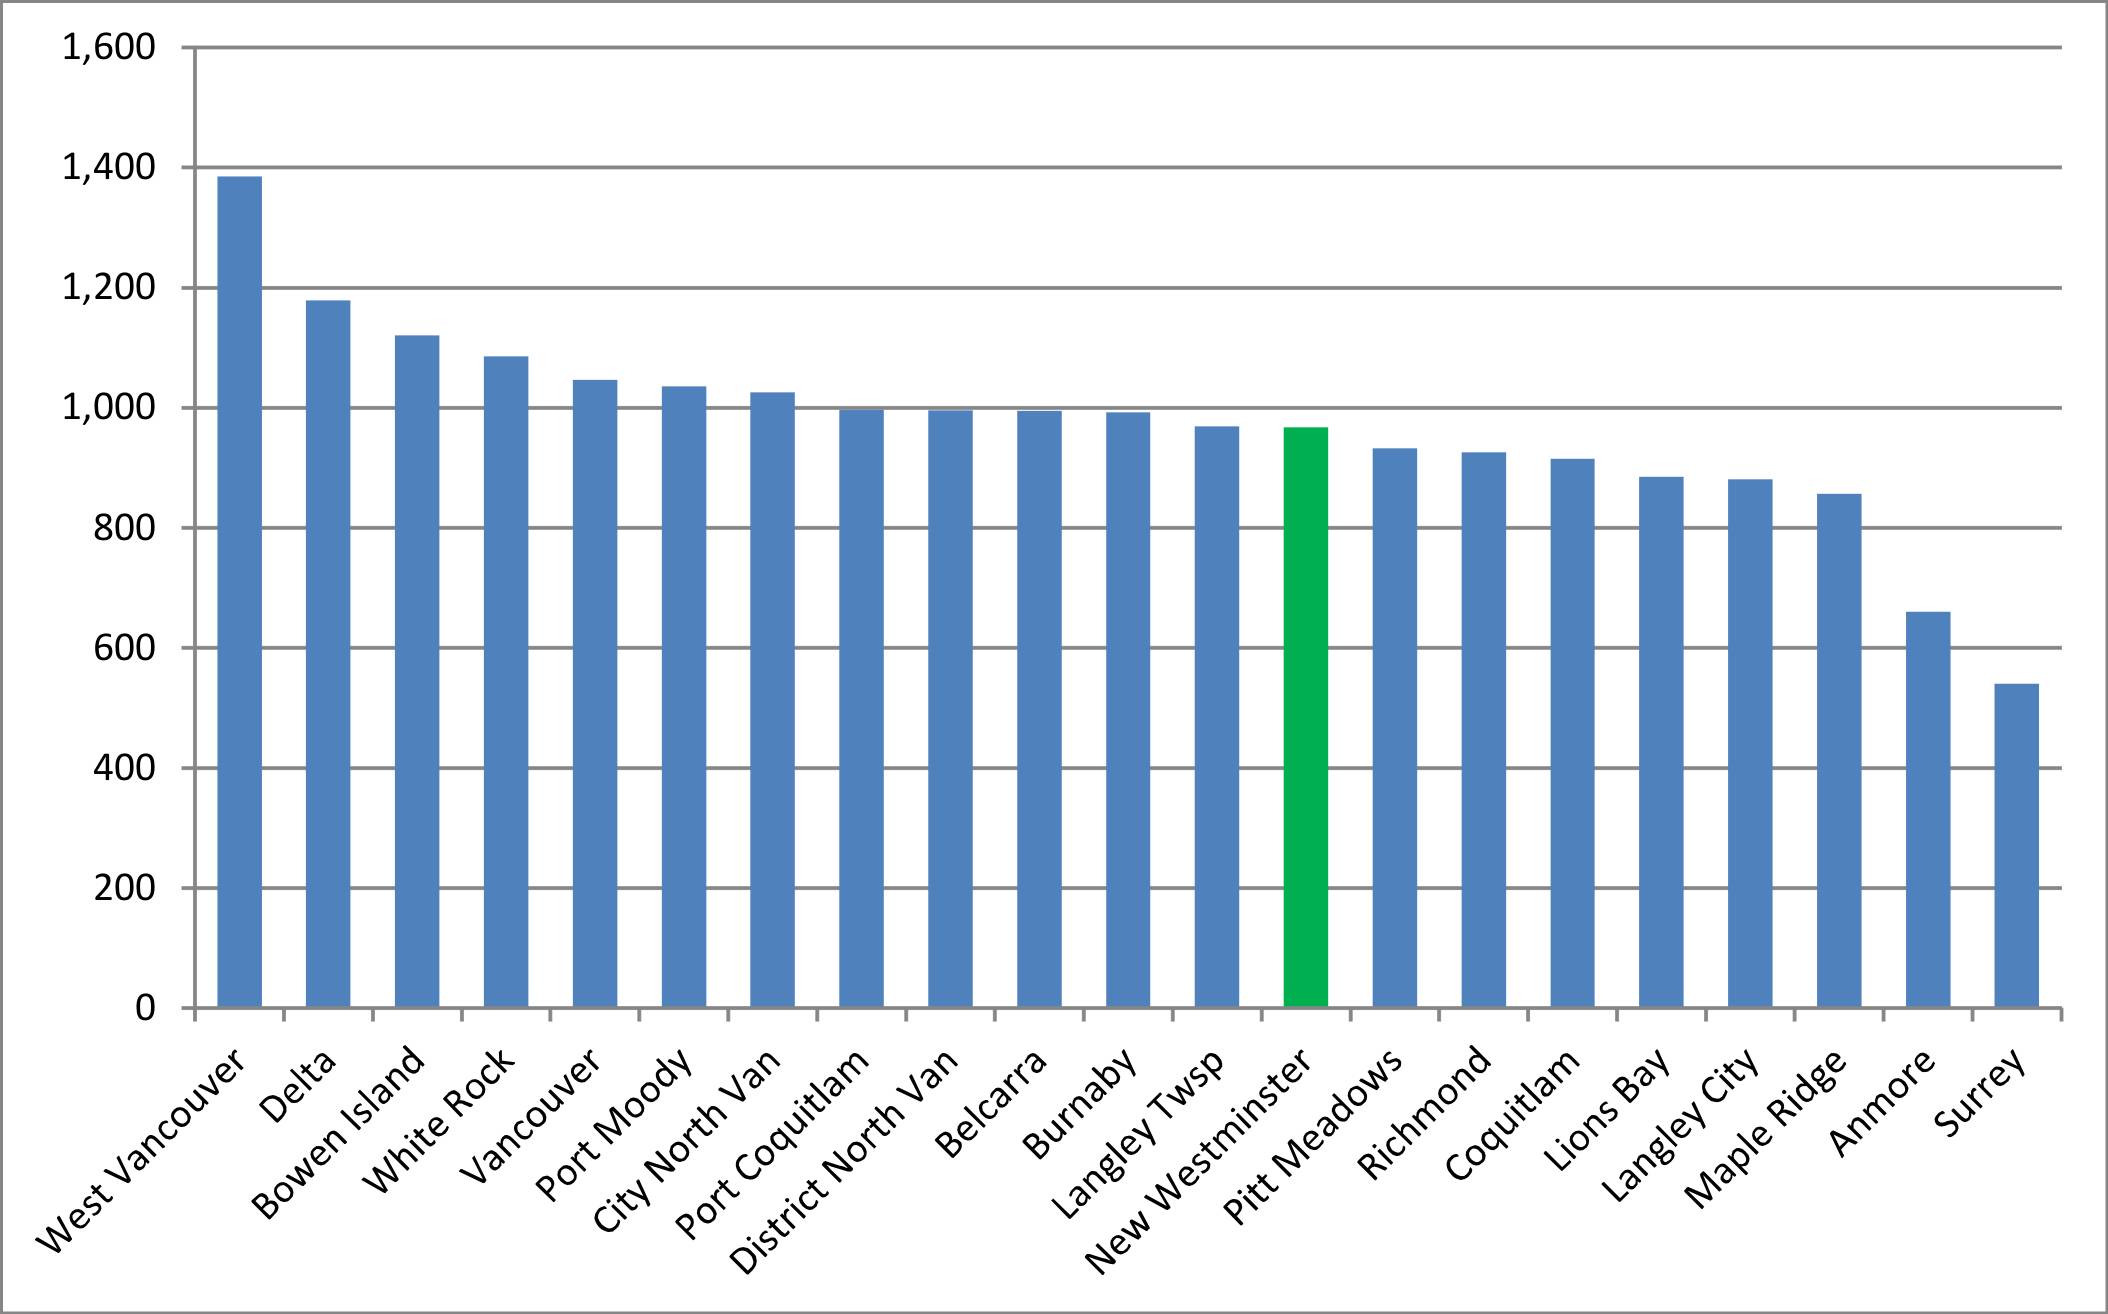
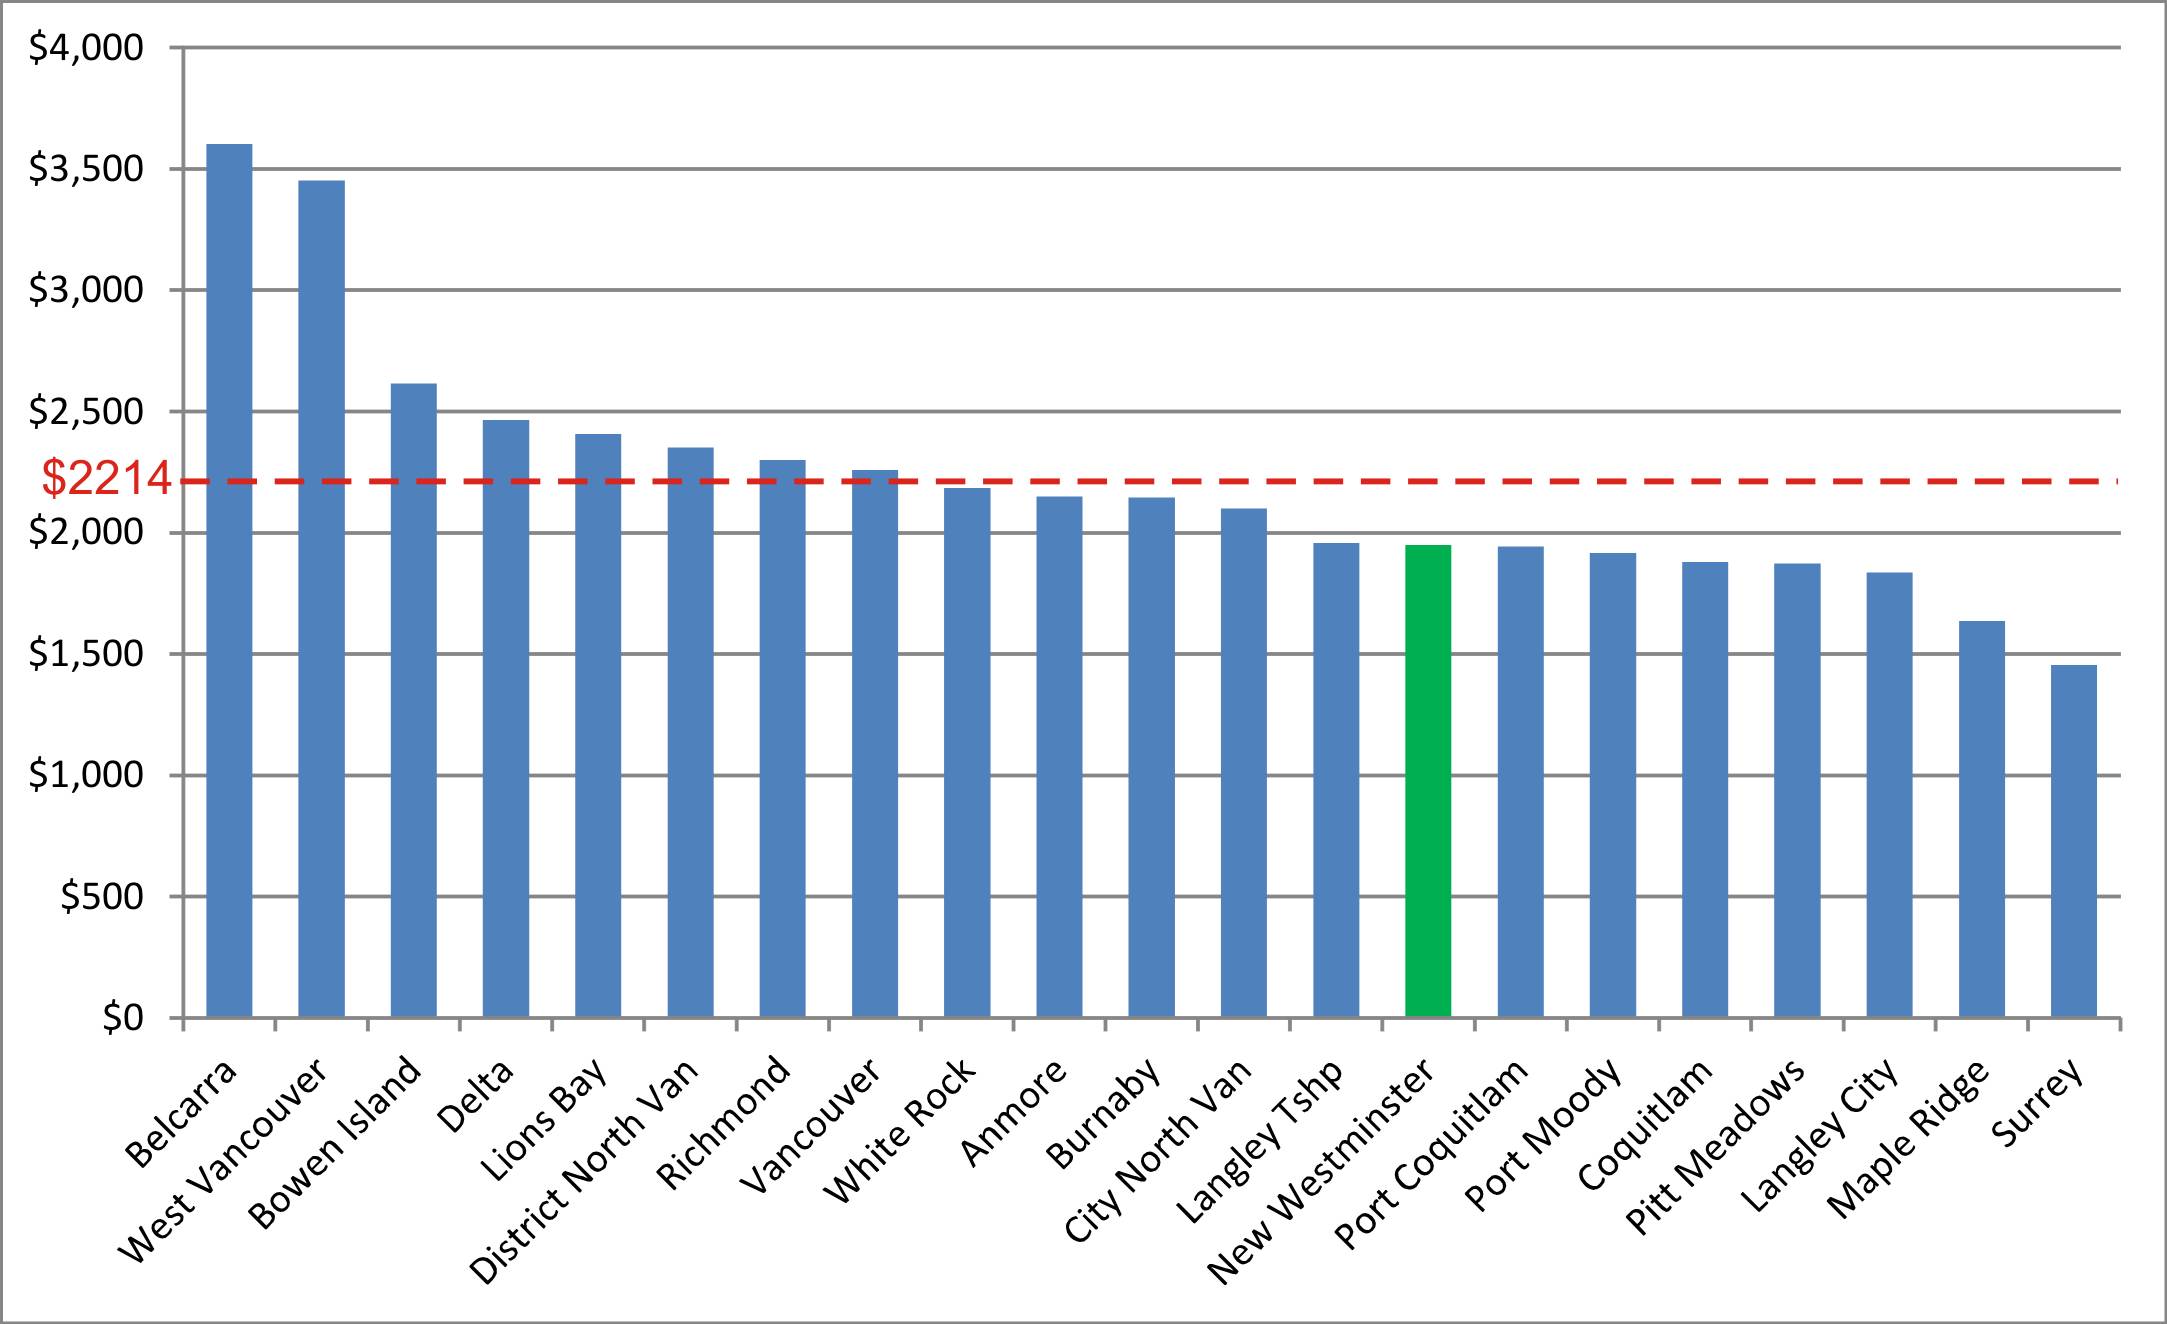
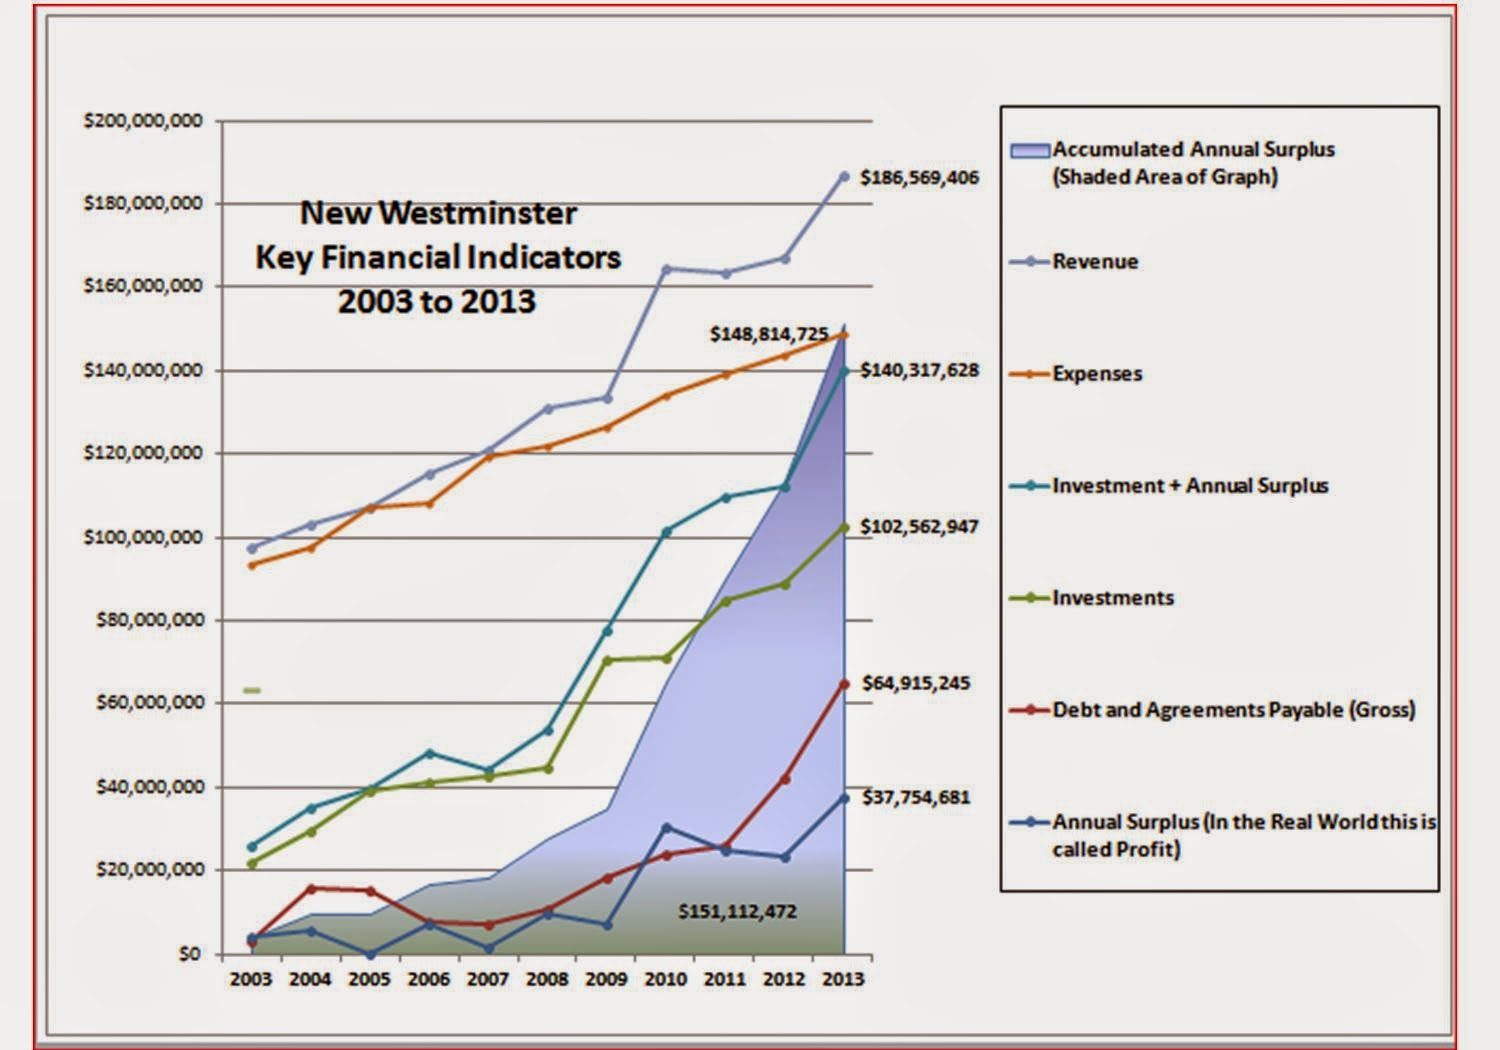
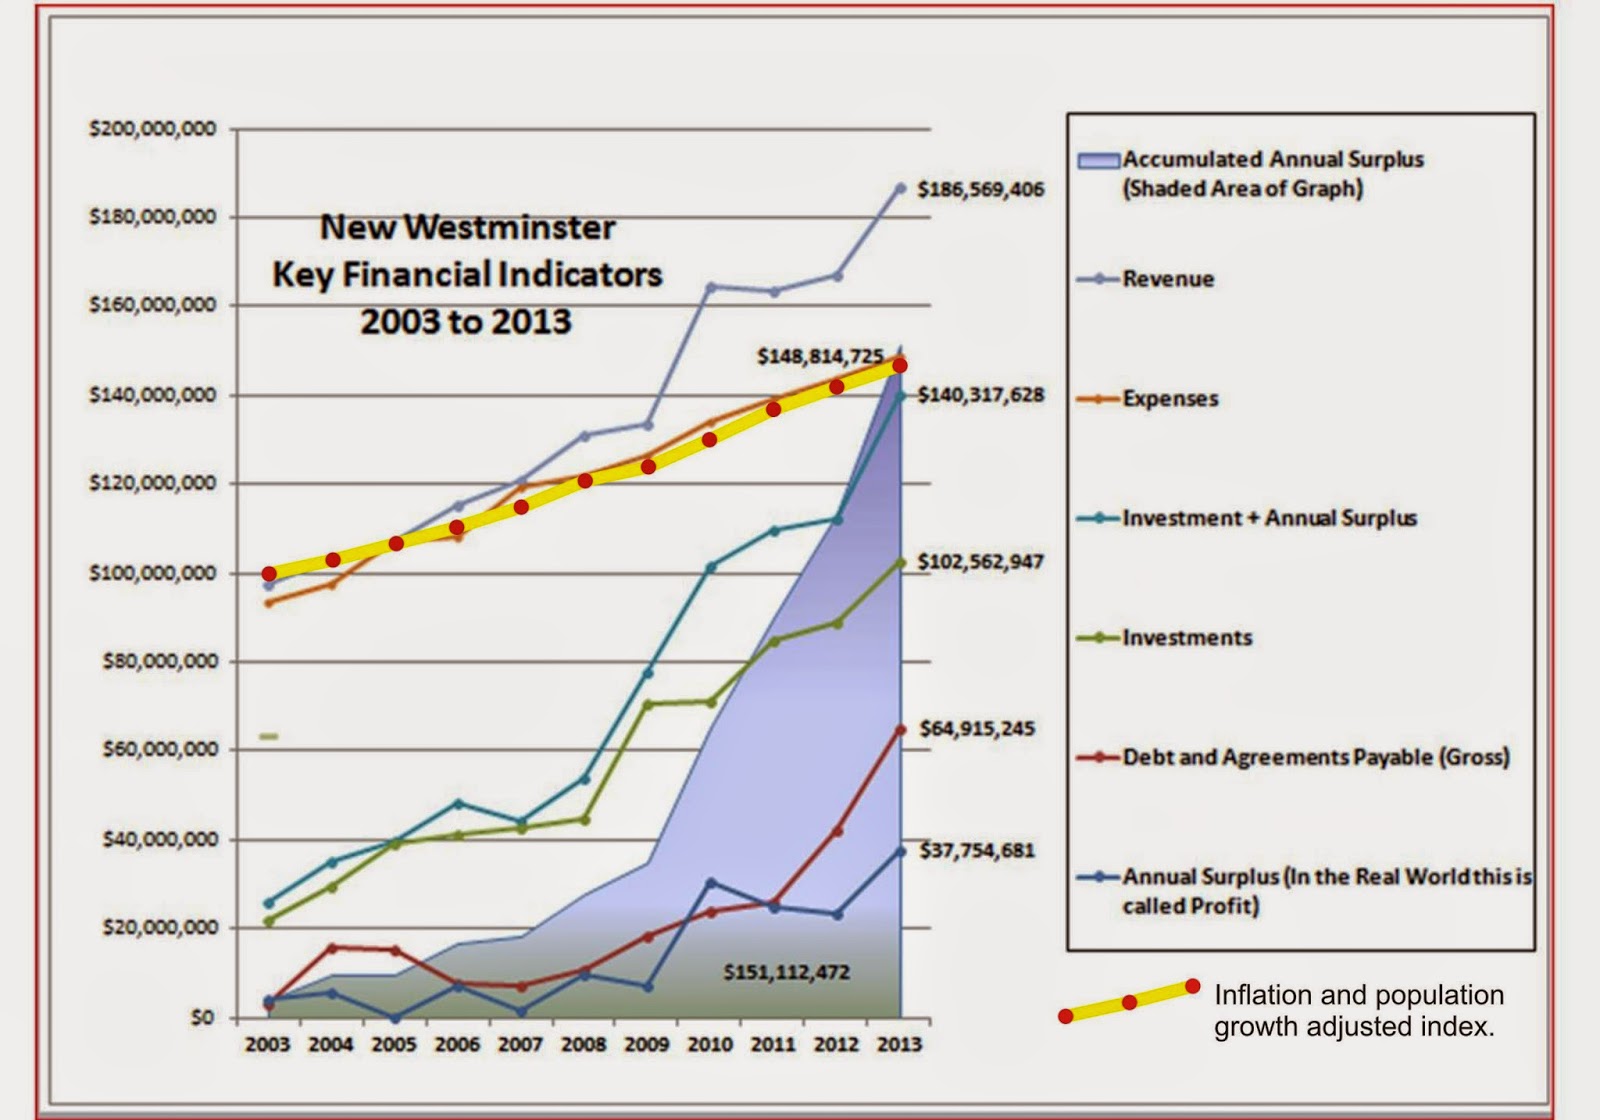
I tried during this and previous tax seasons to talk about the hows and whys of our Property Tax system, but there is one topic I didn’t really touch on. It is a topic raised commonly by local contrarian, cyclist, and generally good guy, Ed. I am paraphrasing a collection of Twitter missives a bit, but my understanding of Ed’s position is that property tax increases should be limited to CPI increases, or matched to inflation. In this post where I compared New Westminster’s tax increases to the inflation rate, you can see that we are, and have been for more than a decade, above the CPI rate (which is projected by the Province of BC to be 1.9% in 2016), as is every other City in the Lower Mainland. Why?

It shouldn’t be too much of a surprise. Every year as a part of the budgeting process, staff bring recommendations to Council about new spending, and provide us (and the public) a pretty clear picture of how much each new staff position, program, or service will cost Taxpayers, right down to the percentage of tax increases. Some of those positions, programs or services come with offsetting cost savings or revenue potential, but in the end it always seems that taxes need to go up, it is just a question of how much.

I’m going to skip a little bit past the easy political talking points: downloading, deindustrialization, and economic bleeds caused by decades of neo-liberal economic policy. That’s not to say these factors should be blithely dismissed; indeed they are real pressures on local governments, and may be the biggest factor in ongoing tax increases. Maybe in another blog post I’ll try to explain what is wrong with the entire world economy (better if you just go read Umair Haque), but for now I am going to keep this local, because we are asking what we in Local Government can do about this.

There are many drivers that push up the cost of running a City the same way they push up the cost of running of your business or household. Just as you pay more every year for food, utilities, banking charges, transportation, and taxes, the City pays more for wages, equipment, supplies, banking charges, utilities, etc. As Ed astutely observes, those increase is (more or less) related to the Consumer Price Index.

There may be long-range factors that impact how closely our operational costs match CPI year-to-year. For example, a long period of ignoring our infrastructure means it will be more expensive to repair when the situation becomes critical. Similarly, if we have extended periods where wages are not keeping up with inflation, that will come back to haunt us.

There is a third factor, however, that is completely in control of local governments and the electorate that empower them. Every year, people want more from their local government, and more never comes for free. To give examples of this, I think I can divide that “more” into three general categories (recognizing there is a lot of overlap between the three): new needs, new programs, and new approaches.

New Needs are things we have to do now, that we didn’t really have to do in the past. There is some aspect of “downloading” to this, but most of it is just a result of changing times. We currently train a group of our NWFD force to respond to Hazardous Materials incidents, in case one happens at the railyards in the City. This was partly a response to the tragedy at Lac Magantic, partly an increased awareness of the hazards that exist in our community and a demand from the public that we do all was can to address those concerns. Another example is the new policy that every single sidewalk corner will have a “let down” to make all of our sidewalks accessible for those on wheels, those pushing children in a stroller, and those with other mobility limitations. We are similarly spending money upgrading all of our bus stops to meet accessibility standards. These are just a couple of examples of things we now do that we did not do in the past, and they all cost money – more money than we collected in the past.

New Programs are things that we have chosen to do because people want them, but are (arguably) not “needs”. I was at the Youth Awards held last week at Century House, and was reminded about the programming we offer in our (still brand new) Youth Centre, a facility used by literally thousands of local youth every year. We have recently been discussing infrastructure upgrades at the Library, and I am learning how they provide the only access to the internet for a significant portion of our community. Everything from interacting to government agencies to applying for jobs is impossible in 2016 without internet access, and the needs of the community are outstripping the computer terminals we have. We are currently replacing one of our all-weather fields for the princely sum of $1.5Million, because it is past its service life. We do this because a plastic turf field is about 5x more used than a grass field, and we can offer much more programming on a limited amount of space available in the City. Our Police Department has officers specially trained to determine when a person is suffering from a mental health issue, and manage their approach in a way that is less likely to result in violence or self-harm for the member of the public. Again, new, modern problems all around, not things we did 20 years ago, but things that our community expects in 2016.

New Approaches are things we have always done, but do very differently now, often in ways that are more staff or resource intensive. I am sitting in on the Public Engagement Taskforce, a group of staff and public volunteers looking at better ways for the City to reach out to the public they serve, both so we can keep the public more informed and so we can get more meaningful feedback from the public when we need to make decisions. The way we, as a City, have turned the Official Community Plan update into a two-year-long public conversation about the future of the City, instead of just a small collection of staff and a few councillors attempting to dictate the future, is an example of how resource-intensive true engagement is, and how important it can be to a community. Again, it seems obvious to us now, but not something we expected 20 years ago.

This is not to say there is nothing we can stop doing or paying for as times change: we save a bunch of money on pesticides with the new approaches to weed management in the City; our fleet fuel budget is going down as we upgrade to a more efficient vehicle pool; the cost of running our solid waste program is definitely increasing at a rate less than inflation as efficiencies are found. Our mental health officers will likely result in lower crime levels, better supports for marginalized people, and law enforcement savings down the road. Building pedestrian-friendly streets will reduce the use of cars in our city saving us money in road maintenance, emergency response, and health care costs. There are also efficiencies of scale as population increases and density makes provision of services more convenient. But the reality is that pipes in the ground and mowing lawns are costs that track along with the CPI, and no-one is lining up to propose which programs they want to see cut in the City. New approaches to new problems are inevitably added to the bottom line.

Every election, people come along saying they will freeze or lower taxes, but do any of them provide details of how they will do it? I still fondly remember former Mayor Wayne Wright in the 2011 election shutting a rather vitriolic opponent down at an all candidates’ meeting by calmly saying “Cutting taxes is easy. It’s the easiest thing for us to do. Just tell us which programs you want to cut to make it happen”. There was no retort, because he put a lie to the “find efficiencies” and “set priorities” memes that neo-liberals use when their real goal is to undermine public services at every scale, from public transit to schools to health care.

It is also telling that even the most strident of anti-tax crusaders find that in Local Government, the bills are always coming due because we have to answer the phone when someone loses a service or program important to their lives.

As a Council, the toughest part is setting priorities. You get elected hoping to do a lot of great stuff, and run up against limited resources and an over-burdened agenda of 7 Council Members. I would love for us to develop the Gas Works site into a public art curator and public park, to complete the Sapperton Landing to Pier Park greenway connection, to build an architectural wonder for a Q2Q bridge and a energy efficient family-friendly and competition-supporting Canada Games Pool. While we are at it, I want to fill the funding gap of senior governments that is threatening the very existence of our supported Co-op housing sector, build a fully integrated and interconnected bikeway network, and plant 10,000 trees to bring our urban forest back to the national average for tree canopy. These are all important things, and they all cost money, and they would all result, eventually, in tax increases above that of inflation. We can probably avoid significant tax increases if we do none of them, along with not doing a list of other things that would make our community better.

So every year at tax time, and actually throughout the year, when new programs or better services are presented to Council, we evaluate them. We try our best to understand the long-term budget implications, ask how or if these ideas can offset costs other areas (“find efficiencies”), and determine if this is something needed right now, or if it can be put off (“set priorities”), and we hear from the public about how critically important, wonderfully visionary, or economically savvy each new idea is. And we make those tough choices, and often we say no. That’s the job.

When people say “The City should…”, I so often want to respond with “Let’s do it!”, but instead end up saying “I wonder how we could…”. That (along with no longer fully enjoying the Letters to the Editor section) is probably the biggest dose of reality going from being a community rabble-rouser to an elected official. I agree with Ed, with former Mayor Wright, and (though I shouldn’t speak for them) with my Council colleagues, that we need to be diligent at finding ways to save money, find efficiencies, and keep our taxes as low as possible. But much like Jordan Bateman, I agree that we have a responsibility to the present and future residents of the City “to build the infrastructure that will keep them safe and healthy… we must balance both present and future needs

Utilities 2016

As we are deep in to budget times at the City, I wrote a couple of previous posts comparing the amount of tax collected by New Westminster, and the rate of tax increases in New Westminster relative to the other Cities in the Lower Mainland.

If you are a homeowner in New West, you also paid your annual utility bill recently, and you may have noticed the rates for utilities are going up faster than your taxes. So it is worthwhile comparing between municipalities, as the way they manage their utilities has an impact on the taxes you pay, and the cost of living in your community.

First off, I removed the very rural municipalities from this analysis, mostly because the comparison of apples to apples is difficult. Anmore, for example, has no municipal sewer service, so every resident has their own septic field. Water services on Bowen Island are limited to parts of the community, and the level of service provided to Lions Bay and Belcarra is very different than in major communities.

Even within the “bigger” communities, there is variety. The Township of Langley provides about half of its water through its own groundwater wells, White Rock has its own groundwater supply for 100% of its needs, where pretty much everyone else who charges for water gets it from he GVRD. Large numbers of Langley residents and smaller numbers of Richmond, Pitt Meadows or Maple Ridge residents still use septic fields. Trash collection services vary widely across the region.

I have done my best to compare the cities based on the numbers they made available on their websites (as of March 1, 2016 – yes I wrote this pose a few weeks ago and just haven’t had a chance to put the graphics together). All the numbers shown are the published 2015 rates, except for two Cities that have already published their 2016 rates and purged their 2015 rates from their respective web sites, which I label in the diagrams below. So the numbers you see don’t reflect the numbers on your bill this year because I am comparing 2015 values, because that is the data available.

To start with Water Services, it is important to note that some municipalities meter their water, some charge a flat fee. If there is a flat fee available, I listed that. If only a metered rate is available, I calculated the amount they would pay if the household consumes the Lower Mainland average of 350 cubic metres of water per year.

water
Average household water bill per municipality. Flat Rate for Single Family Home or metered rate for 350 cubic metres.

As you can see, New Westminster is about the middle of the pack, and slightly less than the regional average of $519. Surrey is especially high as their flat rate is somewhat punitive to encourage voluntary metering, whereas West Van is fully metered and charges pretty high rates (all of those single family homes on large lots, high slopes, and hard rock result in significant infrastructure cost for their utility).

The sewer utility comparison tells another story. New Westminster is the second most expensive city in Greater Vancouver for sewer rates:

sewer
Sewer rates for Single Family Detached homes, including drainage rates if run as a separate utility. For metered municipalities, 350 cubic metres consumption was presumed.

This can be partially blamed on the age of our infrastructure (we need to put more into reserves sooner to plan replacement/upgrade) and a large amount on us still having a large proportion of our sewers not source-separated. We send a lot of storm water to the treatment plant, and that is really, really expensive way to deal with it. The alternate is to accelerate our source separation program, which also happens to be very, very, expensive. There is a whole blog post to be written on this point alone, so I’ll leave it be for now.

Finally, garbage and recycling programs vary probably the most between municipalities. As some Cities have bi-weekly trash collection, and vary greatly in the volume of different waste types they collect, I tried my best to compare to the “baseline” in New Westminster, which is 120L trash and green bins, unlimited recycling bins.

waste
Municipal solid waste / organics / recycling rates per household, assuming 120L bins where options exist.

As you can see, New West is slightly below the middle of the pack for solid waste services. This reflects two competing trends. Our city is compact, which should reduce the cost for trash collection, but we have one of the largest percentages of residents not living in the Single Family Detached, where trash is collected commercially and not by the City, which hurts our economy of scale somewhat.

Put these all together, and here is where all Municipalities compare on utility rates:

allute

We are the 5th most expensive Municipality out of 17, firmly in the top third, almost completely driven by our higher sewer rates. As there is a complex interplay between tax rates and utility rates, it is interesting to add our average residential tax per household number from this old post to the amount we pay in utilities, to show a closer approximation of real costs between Cities:

combo

Not surprisingly, West Vancouver with the highest taxes and the highest utility rates, is standing tall compared to all others. It is more interesting to see Surrey with its very low taxes jump up to the middle of the pack because of higher utility rates (driven in this analysis, by the punitive “non-metered” water rates, a Surrey resident can probably save $250 a year by getting a meter, which would put it down around Pitt Meadows overall). New Westminster, as expected, is somewhere down on the low side of average, 11th of 17 municipalities.

So what does this all mean? Not much, especially as this is a bit of a jumble of data – a combination of sources with great citations, but combined in a way that would get me laughed out of accounting school. Overall, though, it does suggest that New Westminster is not running its City anomalously less or more efficiently than any other city in the region. New Westminster does not have the costs or services of West Vancouver, but spends more than Langley City. Outside the few anomalies at the ends of the charts, it is probably not surprising that similar cost drivers overwhelm wildly varying political philosophies, and most Cities in the region have found a way to balance the needs and desires of their residents within very similar funding envelopes.

Ask Pat: tax increases

RA asks—

This past year the assessed value of my property has increased by $150,000. Approximately a 30% increase. Using the property tax estimator, entering a rate increase of 0% results in an increase of my tax payment of 18% due to assessed value increase alone. Therefore this more than covers the 2.67% the city proposes. I understand that many homes faced similar increases this past year. For these reasons, I am not in favor of the tax increase proposed.

Can you tell me how the city has factored in the large assessed value increases into its budget and resulting proposed tax increase?

Wow. 30% in one year is crazy. It would be nice to think you made $150K this year just sleeping in your bed, but that doesn’t do you much good if you can’t sell – you have to put that bed somewhere. However, the short answer to your question is: it hasn’t. The longer answer is below.

Your assessed increase was significantly above the average increase in property values for the City over the last year, which was 11.7%. This means you are going to get dinged by the property tax system more than most. However, that doesn’t mean the City is getting extra money, it means someone out there in New West must have got an assessment increase less than the average, and they will see a relative tax savings this year.

The better way to answer your question is by going through a quick example of how the Assessment/Mil rate tax math works.

First off, the City has not yet settled on a tax increase this year. The current draft of the 5-Year Financial Plan that needs to be done by May (the “budget”) is built around a 2.73% increase. That is (more likely than not) the number that is going to come to council in the form of a Bylaw sometime in April. This means the City plans to collect about $1.8M more this year than we did last year in order to balance the budget. About $1.3M (1.97%) of that is “base budget” increases – inflationary increases that, if not approved, would result in a reduction in existing programs and services. The other approximately $0.5M (0.76%) is new departmental requests: things like additional staff to enforce and administer the Tree Bylaw.

Using the City’s handy tax estimate calculator, you can enter 2.73% and your assessed values from 2015 and 2016, and get an idea how much your taxes are likely to rise this year. For the fun demonstrative value of it, I entered several values for property assessment increases and City tax increases, and plotted out the results:

grahp

On the Y-axis (vertical) is the property value increase from BC Assessment. I don’t think many properties went down in value, and your 30% is the highest increase I have heard of, so this should cover most of the range of residents in the City. The average increase City-wide was 11.7%, which I show with the thick grey line. On the x-axis (horizontal) is the amount your tax bill will increase based on the three scenarios represented by the green line (City tax increase of 0%), the blue line (the City’s proposed 2.73% increase) and just for comparison, a 5% tax increase shown with a red line.

You can see that for the average assessment increase (11.7%) the tax increase is equal to the City’s set increase. As your assessment increase is an astounding 30%, your tax increase is going to go up much more than this, and the relationship is linear: if we raise taxes 0%, you will pay 18.3% more, raise taxes 2.73% and you will pay 21% more, raise them by 5% you would pay 23.3% more. My assessment went up about 17%, so my numbers would be 5.3%, 8.0% and 10.3% respectively.

However, 11.7% is the average increase for the City, so for every property that increased more than 11.7% there is one that increased less than 11.7%. For the owner of a property that went up 10% in value, the proposed tax increase is about 1% (less than inflation), and any property that increased by less than 8.7% in 2016 will see their taxes go down. I know you are sitting on a 30% increase and the regional real estate numbers are crazy, but by the virtue that your property went up almost 3x the average, there must be a large number of properties in the City whose increase was less than the average, and even below that 8.7% threshold.

To sum up, the big point here is that the City does not look at the assessed property value increases when calculating the tax increase required for the year. We look at our budget and determine what our need is to deliver the services required. This year it looks like about $1.8Million, so for every $100 we took in from property taxes last year, we need to take in (about) $102.73 to deliver those services and balance the budget. If the average property assessment was 1% above last year or 100% above last year, it does not change that 2.73%, and the only thing that increases or decreases your tax burden is the amount your property increased or decreased in value relative to the city-wide average.

If you think a 30% increase is not realistic, then you are able to appeal it. Too late now for 2016, but 2017 is just around the corner. The BC Assessment office doesn’t work for the City, so we have no say in how they do their work, but there is an appeal mechanism, and if you think your out-of-scale assessment is wrong, you can appeal. If you were to get your 30% increase appealed down to 20%, you will cut in half the amount of tax increase you experience. As a City, we have no skin in that game (because every one of your neighbours’ taxes will go up slightly to offset your reduction), but as homeowner whose assessed value went up 17% last year, I’ll be sharing your pain.

More taxes – with colour!

My main argument last post was that New Westminster’s property taxes, on a per capita basis, are not out of line with the rest of the region, and are actually significantly enough below the average that the difference works out to a pretty nice chunk of money.

However, it was noted to me that we don’t actually pay property taxes on a per-capita basis, we pay per household. So I took the same sets of statistics from the BC Government site to see how much each City was collecting in taxes from Residential properties only (not business or industry), and compared it to the number of Households in each community, which is a statistic collected by Metro Vancouver for their own purposes.

table1crop
Total residential taxes collected by Municipality per Household (BC Gov’t and Metro Vancouver data)

As you can see in this colourful chart, New Westminster slips down into one of the lowest-taxed communities in the Lower Mainland in this comparison. We have a relatively low number of residents per household (2.28, compared to a regional average of 2.73) likely because of the larger number of rental suites and apartments in New Westminster than other Municipalities.

Although the presence of taxes irritates some people, the issue really arises whenever taxes are raised, so how do we measure up in the constantly-increasing-taxes department? Every year Council discusses a potential tax increase to keep up with inflation, growth, wage increases and paying for new programs. Again, the Province’s annual reporting is a useful dataset for comparing these increases between Municipalities, in this case the table called Schedule 703, which lists the annual “Total Property Taxes and Charges” for all Municipalities. I calculated the % increase every year for all 21 Municipalities, and to facilitate comparison between Belcarra’s $2M budget and Vancouver’s $1.4B budget, I indexed all of the taxes to the 2005 baseline, which I arbitrarily set at $100.

table 2
Taxes and fees collected by Municipalities, 2005 to 2015, as a percentage of the baseline amount collected in 2005.

As you can see, between 2005 and 2015, New Westminster’s taxes went up about 65%, which puts us right about the middle of the pack regionally. Anmore was off the scale in their increases, and Vancouver was (perhaps surprisingly to some) one of the most conservative in their tax hikes. To answer your question, I have no idea why Langley Township has that big jog in 2014, except to say that’s what the stats report, and it was an election year in Jordan Bateman’s riding!

These numbers, however, mask that over those 10 years, there was a lot of regional population growth, so as taxes went up, so did the number of taxpayers. Your individual tax increase as a resident of one of these Cities is not represented here, so I took data from Schedule 201 to track the rate of population growth with the same set-2005-as-100 indexing, and the same line colours:

table 3crop
Municipal population, as a percentage of the 2005 baseline population.

The data here is, unfortunately, a little choppy, as the BC Government does estimates between census years, and the 2014 Census leaves something to be desired. Why they reported no changes in population in 2013 or 2015, you will have to ask them. Perhaps most surprising are the 6 Municipalities that saw their population shrink since 2005 (we need to sit down and talk about the Regional Growth Strategy here, folks). As you can see, New Westminster was one of the fastest-growing communities, behind Surrey and Port Moody, and quite a bit faster than all of the municipalities to the north and west of us, even those with similar dense urban cores and rapid transit access.

So combining those two charts together, I calculated the “Total Property Taxes and Charges” (from Schedule 703) and divided by population (from Schedule 201), then again indexed the resultant taxes per capita to the 2005 rate, which I arbitrarily set at 100:

Taxes and fees per capita, as a percentage of the 2005 value.

Not surprisingly, taxes didn’t go down per capita in any Municipality over the last decade, but Vancouver’s rapid growth combined with its relatively conservative tax increases make them look pretty good, and they were the only Municipality whose tax increases were (at least until 2014) on pace with the National Inflation Rate, which I added as a dashed line, mostly for Ed’s benefit. Notably, only 4 municipalities (Vancouver, North Vancouver City, Langley City and Surrey) have increased their taxes at a lower rate than New Westminster. It is interesting that these are amongst the most “urbanized” municipalities, and that taxes are increasing fastest in more rural/suburban municipalities, a correlation I have no theories to explain.

As a summary, New Westminster is far from the most-taxed municipality, and are trending towards being one of the lowest-taxed. Based on BC Government data, I am confident that our taxes, no matter how you count them, are comparatively low, and our increases to date are low relative to the other municipalities in the Lower Mainland.

Tax time again

As it is budget time again at New Westminster Council, people will soon be asked to provide some feedback to our somewhat byzantine financial planning.

The feedback the City receives during tax time can usually be summed up in one phrase: Stop raising taxes. Unfortunately, that advice usually offers a paucity of practical suggestions of how to save the money, with the exception of a general idea that we need to fire some number of “gold-plated staff”. For every suggestion of a practical way to save money (“stop wasting money on flowers”), there are other suggestions or how poorly we prioritize our spending (“what happened to the flowers that used to be on the boardwalk?”)

This is an area where the City’s public engagement process could definitely be improved, but it may be the most challenging part of community engagement, because there are a variety of barriers between making municipal financing understandable to most people, while still providing a complete enough picture of how our budgeting works and where our your money actually goes. The City’s books are, by regulation and practice, completely open, but that doesn’t mean the data presented is put into a context that is useful for most people. This is augmented with a general lack of understanding of how municipal financing works, including the Public Service Accounting Standards, auditing, and formal reporting that is done by every City in the Province.

So to start the conversation here about the 2016 budget plan, I want to put to rest, once again, one of the myths we commonly here in New Westminster: that we are “The Highest Taxed City” in the Lower Mainland. To challenge that idea, I am once again going to the standardized financial reporting data that every City provides to the Province.

I have already talked about Mil Rates, and not much has changed since I wrote that blog post all them years ago – Mil rates are still a terrible way to compare taxes between Cities. Actually, pretty much any way to try to compare taxes between Cities is a terrible way. Every comparison includes some confounding variables hidden in the data, because (back to the top) municipal budgeting and taxes are a complicated topic.

So for the purposes of this post, I will provide a couple of charts showing that we are not, as some would assert, the highest-taxed City in the Lower Mainland. Again, all data from the BC Government sources cited above, which is about the most impartial source of data available for local government finances.

Table1
Residential property taxes collected in 2015 per capita.

Table 1 shows the amount of residential property tax paid to the Municipality per person who lives in the Municipality. This does not include taxes paid by industry or businesses, or other fees the City collects, but right off the top, you can see that New Westminster is no-where near the most taxed Municipality.

But this is only Residential Property taxes, and Cities vary somewhat in the amount of industrial and commercial taxes they collect relative to residential taxes.

Table2

As a bit of an aside, Table 2 shows how much of the taxation burden is carried by residential homeowners, relative to how much of the present assessed land value is residential. In every City (except those few lacking commercial or industrial taxpayers), the business community subsidizes the homeowners. The few Munis with almost all of their revenue collected from residential land are the anomalies, but the “gap” between tax burden and assessed land value here in New Westminster (~25%) is not out of line with that of our “competition” with similar tax rates.

Table3
All municipal taxes collected in 2015 per capita.

If we widen our focus away from only taxes collected from residential property owners, and put all municipal taxes (residential, commercial, industrial, etc.) into the bin, we end up with Table 3, the amount of municipal taxes collected from all sources per capita. Again, New Westminster is somewhere in the middle, skewing slightly (but probably not significantly) towards the lower-tax side of the spectrum. The Cities that moved up are (naturally) those with the largest commercial and industrial land bases. Vancouver moved up 11 places from one of the lowest-tax cities to 5th from the top, Delta from the middle of the pack to the second highest (thanks to their low population and the Annacis Island cash cow), while residential bedroom communities like Anmore, Lions Bay and (sorry) Maple Ridge move way down to where they look more like comparatively lower-tax communities.

However, there is one more way these comparisons of taxes are not fair between jurisdictions, and that is in the other ways some municipalities choose to collect money from residents and businesses. Fees, Local Area Service Taxes, and Parcel Taxes are ways that tax burden can be kept off the “Mil rate”, but still appear on your bill. These are, fortunately, reported to the Province, which allows a more fair comparison between the Cities (Surrey, Burnaby, Coquitlam) that collect millions in Parcel Taxes with others (Vancouver, Richmond, New Westminster) that collect none.

Table4

Table 4 shows what happens if these additional taxes are included with your variable property taxes, and the Cities are compared, again on a per-capita basis. Not only does New Westminster compare well against out neighbours, we are significantly below the average per-capita taxes for the region, shown by the dashed red line.

For the fun of it, I calculated what it would mean for New Westminster to raise its taxes to match the per-capita regional rate. To get there, we would have to collect $18.5 Million more every year, or $264 per resident. To put that in perspective, an extra $18.5 Million per year would pay outright for a new Canada Games Pool in 3 or 4 years, a new Animal Care Facility in less than 6 months, or enough money to raise our annual grant fund for festivals and other services by 20 times. That is a crazy amount of money, and that is the amount we are below the average for the region.

Do all cities charge too much taxes? Some would argue that, while other question whether cutting municipal costs to the bone is really worth the erosion of livability that usually results. And threading that needle, my friends, is where we need to have a better discussion around the City’s budget.

Talking Taxes (pt. 2)

A little while ago, I blogged about Property Taxes, and tried to put some context to where New Westminster compares regionally around residential property tax levels. I used this dataset provided by the Province, as comparing the financial documents of all 21 Lower Mainland municipalities from their on-line reporting is a bit of a challenge. I demonstrated (I think) that New Westminster is neither the highest of lowest taxes municipality, but was either in the top third (if you take a very raw measure) or right about in the middle (if you actually count how much the typical household or resident pays).

But what about businesses? During the last election, it was suggested in print by one of the (unsuccessful) candidates that taxes charged to businesses in New Wesmtinster are “the highest in Metro Vancouver”. This did not make sense to me at the time, but didn’t rise to the point, as I wanted to be able to put number to the issue. The simplest method, of course is to compare how much is collected from businesses of every type on a per-capita basis:

Table3

You can see that New Westminster is 8th in the crazy category of most taxes per capita from businesses of all types. If you look only at commercial businesses (blue), we are the 6th highest. This is where you can see some of land use choices affecting the numbers. Delta has huge tracts of industrial land on Annacis Island that provides almost half of its non-residential taxes, and Port Moody hosts a lot of major industrial use. Meanwhile, Vancouver is truly post-industrial, with their largest “industry” being non-industrial commercial businesses. There is nothing here that makes New Westminster anomalous.

However, this is a rather useless comparison. Unlike residential taxes, you cannot evaluate business taxes on a per-capita basis. With the varying levels of residential/business mix, you can’t really count up the number of businesses or business owners or leasable square footage and divide the taxes collected between those groups, as the variables are way too…uh…variable. So how do we compare apples in this diverse bowl of fruit?

One way would be to look what proportion of the total property tax revenue is paid by residents, and what proportion is paid by businesses. To index this, you need to compare it to the proportion of assessed land value that is zoned Residential vs. that zoned Commercial. This allows you to recognize anomalies like Anmore and West Vancouver (which have almost all of their land in residential use) and compare them to places like Langley City and Port Moody, where commercial land use is proportionally large.

First, compare the percentage of land value that is in residential property with the percentage of tax revenue drawn from that residential land:

Table1

You can see that in Anmore 100% of the property is residential, therefore that is the only source of revenue. At the other end of the “best fit line” is Burnaby, where 80% of the land is residential, but only 50% of the tax revenue comes from residential taxes. Note the green line, which represents an even balance between proportion of residential land value and tax revenue. The best fit around which all municipalities cluster is well above that, which makes sense as all municipalities charge a higher Mil Rate for businesses and industry than for residents. The amount more they charge is the “Multiplier”.

In New Westminster, our Multipliers in 2015 are shown on the table below. The first number is just New Westminster taxes, the second includes all the School, GVRD, MFA, etc. taxes that the City has no real control over.

Property use    Multiplier (City Only)     (all taxes)
Residential                            x 1                               x 1
Business                                x 3.475                       x 3.403
Light Industry                      x 4.566                      x 4.131
Heavy Industry                    x 8.102                      x 6.444

But back to the graph above. If a municipality charges less to residents in proportion to their property value than they do to business and industry in comparison to other municipalities, then they appear below the best fit line. For lack of a less-pejorative term, I’ll call these municipalities “resident friendly”. Those above the line are more “business friendly”. Langley City is anomalously “resident friendly”, where North Van City and Port Moody are more “Business Friendly”.

However, much of what controls the proportion of industrial land is structural to the economy and geography. Today’s Delta won the lottery in 1955 when the island was designated as the region’s first Industrial Park, and the high-multiplier property taxes started rolling in. Another way to look at the above graph is to flip it over looking only at commercial business taxes:

Table2

This time the best fit is under the (green) equality line because every business in every municipality pays more than its share of property taxes. The further under the best fit line, the less “business friendly” a Municipality may be considered. Vancouver is the obvious standout (the attractiveness for major businesses of being located at the central business district of the metropolis demands a premium), but New Westminster, Coquitlam, and the District of North Vancouver also appear a little below the line, and have very different land use proportions when looking at residential vs. industrial vs. commercial.

This raises a question which is completely rhetorical, but well worth asking: what should be the balance between residential and business taxation? Should a City like New Westminster give business owners a bit of a break to encourage job creation, or should we keep residential property taxes lower to manage the affordability of living here? Should businesses subsidize residents, or vice versa? If “neither”, what is the balance?

Just for the fun of it, I plotted every municipality’s details on the same graph. Population is on the X axis, and the total land assessed value on the Y axis. The area of the pies represent the annual tax revenue, and the colours of the pie charts represent the tax revenue by land use. Note that Vancouver and Surrey are both way off the chart here. Both their populations (640,914 and 504,661 respectively) and assessed land values ($221 Billion and $85 Billion) put them in a range that is out of scale with the rest of the graph.

Table6

I don’t have much to say about this graph except that New Westminster is snugly right in the middle on pretty much every measure. The amount of tax revenue collected and the proportion of residential vs. other types of taxation is pretty much right where you would expect for a City of our size and population. It is clear that we do not, by any measure, have the highest taxes in Metro Vancouver, nor are we the lowest, regardless of whether you are a business or a resident. We are somewhere in the middle, proportionate with our land use and population size.

All of this data is from 2014, and the new 2015 reporting to the Provincial government is starting to trickle in. This year, New Westminster Council approved a 2.42% tax increase, which is higher than the 1.3% increase in the Consumer Price Index over the fiscal year 2014-2015. This raises the question of whether our tax increases are happening at an anomalous rate. I’ll try to dig out some data for that and bring you a Part 3.

Talking Taxes (pt.1)

For those who were paying attention, the City of New Westminster’s new 5-year Financial Plan just went through public hearing, and passed three readings at Council. After months of work, several reviews by Council, and a not-terribly-exciting public engagement process, the Bylaw that supports the Plan will likely be adopted by Council this Monday.

But we really haven’t talked about it as a community. When you measure column inches in the local paper, hours of council delegation time and discussion, or conversation at coffee shops and pubs, Parkades and Lancers have by far outstripped this. Which is probably not good, as this is arguably the most important thing Council ever does – scheduling the spending of your money.

We, as a City, need to have a better conversation about this, and I hope the Mayor’s Public Engagement Taskforce can figure out how to make this issue front and centre in the City’s conversation for the next budget cycle.

It’s not like people in New Westminster don’t talk about taxes. It comes up every local election, and there will be a few letters to the editor complaining about the increase approved this time around. There was even a Facebook page that *mysteriously* popped up during the last election all about the untenable tax situation in New West. The general opinion is that New Westminster is either one of the highest-taxed communities in the Lower Mainland, or the highest. This spectrum of opinions is only partially true.

A few years ago (long before Council was a glimmer in my eye) I wrote a series of blog posts on taxes in the City compared to the rest of the region. I wanted to understand where we stand and wanted to cut through the rhetoric. I talked about what a mil rate really is, I expanded by talking about how that compares to actual taxes you pay based on typical house values, and for the fun of it, threw utilities into the mix. My conclusion at the time was that we were not the highest-taxed community in Metro Vancouver, but somewhere in the middle. As a general rule, people north and west of us paid more, people south and east paid less.

Now I have a new role, and although I do not agree with the opinion that taxes are “out of control” (as people continue to ask for the services that taxes provide), I do think I need to be more cognizant of how the tax system in the City relates to other municipalities with whom we compete for businesses and residents (with taxes being only one of the many factors that influence location choices for both of those).

So I started to gather data on taxes from various Cities’ 5-year Financial Plans. However, if you start to search through them, you quickly realize the varying ways financial statements are presented in the published plans. For fun, compare recent 5-year plans of Burnaby and Port Moody.

Fortunately, local governments are required to make disclosures to the provincial government every year, and through that process, a standardized set to statistics are collected. You can read them here. I’m not saying they are the perfect Stats to evaluate whether we get full value for our taxes, but it does give us a level playing field through which to compare New Westminster to our neighboring jurisdictions. And comparison, I will do.

This first graph below shows what a typical household should have paid in all property taxes to their municipality in 2014, and breaks it up by different categories. The number on the top of each column is the assessed home value deemed “typical” for that community by the province, and the value used to calculate the tax amounts based on mil rates.

Table1

By this analysis (and this is the province’s data, not mine), the typical New Westminster residential property tax bill is the 12th highest of the 21 municipalities in Metro Vancouver. Obviously, a huge driver of this placement is that New Westminster’s “typical” $675,000 home value is below average (14th of 21) and our Mil rate is higher than typical (5th of 21, but in a virtual tie with those that are 4th through 7th):

Table2

Recognize, these are averaged numbers, the Mil rate multiplied by the “typical” value. What about what people actually pay? You can calculate a “True Mil Rate” paid in a City by taking all of the Property Taxes collected by the City (in New Westminster in 2014 that was a bit over $65 Million) and divide it by the assessed property value of all taxable property in the City (in New Westminster, that number is just north of $12 Billion), then divide by 1,000. That makes our “True Mil Rate” about 5.32, which is the fourth highest in the region:

Table3

Note that municipalities with low land values cluster towards the left side of the graph, and higher-land-value places cluster towards the right, so this graph more displays relative land value than it does level of service provided or efficiency of the operation of local government.

Up to now, we have only been looking at taxes as compared to land value. Land doesn’t pay tax, people do. So it might be more meaningful to look at how much tax we pay per resident in the City. Lucky, the same provincial data provides population estimates by municipality projected from the 2011 census to 2014, so that is also an easy comparison to make. Here, again, New Westminster is up in the top quarter, finishing 5th of 21 municipalities.

Table4

However, the comparison here is (yet again) not fair, because all taxes are not paid by residents. Businesses and industry also pay property taxes. The Province helpfully divides out local government tax revenue by land use, and if we limit the comparison of residential property taxes paid per resident in their municipality, we see that New Westminster falls back down to the middle – coincidentally 12th place among 21 municipalities:

Table5

I say coincidentally because although New West finishes 12th in the first and last graph here, none of the other 21 municipalities fall in the same location on both graphs. There are many ways to look at the numbers, but by various apropos analysis, New Westminster residential property taxes are pretty much in the middle regionally. Our $572 per person in 2014 puts New Westminster well below the $660 regional average, and essentially equal to the regional median of $573 represented by Langley Township.

So why do some graphs show New West so high? That has to do with how we use our land in New West, and how we tax residents, businesses and industry differently. To see more analysis of that, you will have to stay tuned for Part 2, coming soon.

On Spending our Reserves

A candidate for Council in 2014 wrote one of those letters to the local paper that I just have to respond to. I know Harm, am a customer of his business, curl with him at the Royal City, and respect him very much. However, this letter is so full of wrong, I need to reply in my customary paragraph-by-paragraph basis. I like to quote people directly, because I don’t want to be accused of misquoting them. However, if I err in fact or in representation, I invite Harm (or anyone else) to reply here.

“In response to both Mr. Lundy’s (Why I’ll be voting ‘No’ in referendum, Inbox, Jan. 23) and Mr. Johnstone’s (Why I’m voting yes, Inbox, Jan. 28) letters about the transportation needs and plans for Metro Vancouver. The reality here is that the governance of Metro Vancouver is a mess! Twenty-two city governments, police departments, fire departments, and unelected Metro regional government and TransLink: A gong show that needs a serious overhaul.”

An interesting argument, but not apropos of the current Metro Vancouver Transit and Transportation Plan referendum. Since the Kevin Falcon era, many have been asking for a review of TransLink governance and a return to a more accountable elected board – no-one has called for that more often and vociferously than the Mayors’ Council. However, the Provincial government has made it clear they are not interested in exploring this at this time, and there is no reason to believe a NO vote will bring this about any more than a Yes vote will. I think I made that point in my earlier letter to Mr. Lundy, so I won’t belabour it here.

“The reality is that Metro cities are sitting on a massive cash reserve in the order of $5 billion as reported in annual financial reports to Dec. 31, 2013. Of the $5 billion, the five cities most serviced by SkyTrain hold $3.4 billion.”

Let’s talk about reserves. If you would like to follow along, you can look at this document from the City website. The City of New Westminster has (or had at the end of fiscal 2013) about $15.7 Million in its bank account (“net financial assets”, Page 1 of the Financial Statements). That is derived from subtracting all of the things the City owes money on (invoices in our inbox + revenue we have deferred + money immediately payable on our debts, etc.) from the financial assets of the City (Cash in the bank + money people owe us + the money we have invested, etc.).

If you take away the fact we owe people money, and people owe us money, there are two more important numbers when thinking about the amount of money we have on hand. One is the “Cash and cash equivalents”, which was about $12 Million. The other number which kind of represents what we have in the bank is found on Page 8: $102M in Investments. When discussing “reserves”, this is the money we have set aside in various reserve funds, prudently invested and earning us a bit of interest income.

When we talk of “accumulated surplus” (Page 13), that is a different number, but $622M is a bit of a funny number, because it includes the depreciated value of most everything the City owns, including skating arenas, light posts and the furniture in the Mayor’s Office. I guess we could sell it all, but we wouldn’t really have a City anymore, would we?

“The reality is that the development of public transit infrastructure creates growth and, unlike traditional sprawl growth, does not cost municipal governments massive amounts of money to support. In fact the direct costs for public infrastructure directly related to density growth is charged back to the developers in the form of development cost charges, in reality a pre-paid tax which then becomes part of the purchase price of the units that are developed.”

Correct, the City collects DCCs from development to pay for present or future infrastructure and amenity cost related to the new population pressure. By necessity, we do not spend the DCC the day we get it. We can’t, because most of the needs are cumulative, and many of them carry operating costs that cannot be carried until the population increase happens. See Page 8 where the deferred Development Cost Charges are itemized:

DCCs1

This is money we collect from DCCs, and have put aside for specific uses. In the meantime, the DCCs sit in – wait for it – reserve. While the growth happens, we strategically draw from this reserve to continue to fund portions of capital costs for projects required to provide the services people demand. But you can’t build $100 worth of sewer every time someone moves to town, you need wait for a bunch of people to move to town, then pool their money to upgrade the sewer as needed
However, it isn’t enough. We simply do not collect enough DCC to pay for all future infrastructure needs, nor should we. People living in the existing housing stock have some use for future infrastructure as well, so the City puts a bit of money aside every year, the amount determined by our long-term capital plan based on projected needs, and fiddled with a bit by council (just because we can). We keep the money in the bank earning interest. Look at Page 13…
dccs2

…and see how reserve funds are set aside for everything from Affordable Housing to Equipment Replacement to Water and Sewer funds (I don’t want to get into the whole Tax vs. Utility thing here as this is already too complicated, so for simplicity, assume it is all tax). I’ll come back to this discussion of reserves in a bit below.

“So, while we all know that municipal spending growth has far exceeded the increases in the cost of living, municipal tax revenues in the cities that benefit directly from transit infrastructure development has even outstripped these massive increases in spending.”

This sentence is simply false. A graph from Woldring’s own website shows how expenses have gone up between 2003 and 2013.

dccs3

Indeed, all of those upward trends look concerning. However, Cities are subject to two types of continual growth: population and inflation. To understand the effect, I set an “index” value for City spending at $100,000,000 in 2013, and increased this value annually, factoring in only the inflation rate (which ranged from 0.3 to 2.9 over those 10 years) and the population growth rate in New West (based on census data, projecting the 2006-2011 trend up to 2013):

dccs4
If we superimpose these numbers on to the earlier graph, note how this line is ever so slightly shallower than the City’s actual expense increases over the same amount of time. Spending growth in New Westminster has only just matched population and inflation growth over the last 10 years:
DCCs5

If you want to stop inflation and stop population growth, then we need to have a serious sit-down about Capitalism as an economic model, but this is probably not the right time or place for that.

“What we have here is a giant power struggle and a fight about taxpayers’ money.”

Well, no. What we have here are two levels of government trying to NOT tax at their own level to pay for services that people want. Mayors don’t want to increase your property tax, and the Province doesn’t want to raise your other taxes, but they both agree the project should be funded. Why? Because they are tired of having to explain to people that public services cost money to provide, because every time they say so, Jordan Bateman steps up and calls them all wasteful incompetents, to the cheers of a hundred CKNW phone-in “men on the street”. This letter to the editor is an example of that phenomenon.

“If transit development creates a “development dividend” for cities, some or all of that dividend should be spent on the continuing development of public transit infrastructure across the district instead of simply fattening the coffers of individual municipalities.”

Far from fattening the coffers, that dividend goes to providing the services people who are living in those developments will need – hence DCCs and expenses going up in parallel to population growth and inflation as seen in the graph above.

“The reason I’m voting ‘No’ is that the money is already there and the provincial government should wrest our money away from those municipalities and invest it in regional transit infrastructure with the emphasis being on moving people and goods using transit infrastructure like SkyTrain, LRT and short sea shipping instead of building more roads, tunnels and bridges. The people are ready; isn’t it about time politicos and bureaucrats stopped protecting their own turfs and do what we pay them for: serve the taxpayer!”

I ask the simple question: if the 5 cities cited above convert the entirety of their reserve funds, 100% of them, to the 10-year Mayors Plan (which would only provide 47% of the needed funding, so let’s assume the Federal Government matches those funds, and we get this done): Now what? (I’m going to, for the sake of argument, ignore the fact that some of these reserves are Statutory, meaning the Community Charter or other legislation limits our ability to spend them on whatever we want).

If we drained our reserve and DCC funds to zero, what would that do to those things listed on Pages 8 and 13 of those financial statements? Money we have earmarked for the Canada Games pool replacement? Gone. Money for the required (and incredibly expensive) storm drainage separation project? Gone. Future electrical utility maintenance and upgrades? Money to re-build Massey Theatre? Future support for daycare, affordable housing, roof replacements on City buildings? Money set aside for future fleet vehicle replacements, computers, the cemetery reserve, or paving of roads? All of it gone. How does that serve the taxpayer?

The letter invokes a picture of City hall having this big vault in the back where Mayor and Council occasionally roll around in piles of cash, all for shits and giggles. In reality, consecutive Councils have created and supported a long-term financial plan that will provide for the ever-increasing needs of the community (a problem made worse by downloading of so many senior government coasts to local governments) while assuring that future councils have the capital required for the huge pile of inevitable big-ticket items the City will need in the future without the sudden need for sharp tax increases whenever a capital project is needed. It is responsible governance.

“p.s. The new bridge to replace the Deas tunnel isn’t as much about cars and trucks as it is about getting bigger ships farther up the Fraser River, and since that’s the case, shouldn’t Port Metro Vancouver and the federal government be funding that one?”

This is hardly a PS. This is the central point. But I’ve been banging that drum for so long I’m tired of the rhythm.

*My turn for a PS: This is a good time to have the discussion about the City’s reserves, not because they would be better served bailing out the Province from their responsibility toward TransLink, but because we are going into a budgeting cycle in the City where Council may ask taxpayers for yet another increase, and some of the money that increase will bring in will go towards reserves. The letter writer clearly believes these reserves are getting too big, I have talked to a Charted Accountant who has some experience in Municipal finance, and (after a cursory review of our 2013 Financial Statements, and admitting he didn’t know much about the pressure on New Westminster’s physical resources) he suggested they were moderate, or perhaps a bit low, and he is not alone in that feeling. We need serious talk about reserves and how we use them, for the long-term good of the City.

Fare Evasion and Jordan Bateman

There was furious action on the War on Public Transit this week, as our local Libertarian hypocrite from the misnamed Canadian Taxpayers Federation again got unexplained media saturation by suggesting that fare evasion on lower mainland transit is some sort of a scandal, or worse – proof of incompetence at TransLink. It sounds compelling, but it is just predictable CTF misinformation.

Allow me to explain.

The latest CTF anti-transit rhetorical volley is based on data released on the “no fare paid” button on TransLink buses. This is the process through with bus drivers account for improperly paid fares (fare evaders, those paying too much, those crossing a zone boundary without paying the premium, etc). Drivers counted 2.76 Million incorrect fares in 2013, which is an increase of 250,000 over 2011. This, in the rhetorical world of the CTF, proves that TransLink is irresponsible, inefficient, and cannot be trusted with the public’s purse. It is further implied that if they could only solve this simple problem, TransLink may not need those new funds being requested through the upcoming referendum.

There are several problems with this narrative, and I might be accused of senseless idealism when I expect our “liberal media” to point them out instead of just parroting Bateman talking points.

For example, the media could put the numbers in perspective. 10 seconds on Google, and one can find TransLink’s financial disclosures, and find that there were 355 Million boardings in the TransLink system in 2013. That means 2.76 Million “non-fares” represent 0.8% of the boardings. In a rational world, an organization as worried about the public purse as the CTF would be touting TransLink’s phenomenal record of collecting fares from 99.2% of passengers on a crowded, chaotic, distributed system with literally thousands of moving fare collection stations comprising what is, essentially, an honour system*.

The CTF makes further hay out of the trend. A 10% increase in “fare evasion” since 2011 sure sounds like a trend should be worried about. Except again, no. TransLink collected $433Million in fare revenue in 2011 and $481 Million in 2013. Over those two years, ridership basically flatlined (356M boardings to 355M boardings, thanks to “rationalization” of routes) but fare revenue went up by 11%. Again, the CTF fails to tout that TransLink is doing an 11% better job squeezing users for revenue, reducing the burden on the poor taxpayer the only way they can without senior government approval.

What about the lost money though? Surely this means TransLink is hemorrhaging money due to scofflaws and lazy drivers? Again, the data says something different. Assuming those fare evaders would have paid if forced to (instead of just walking or hitchhiking or dying where they stood, whatever) that would have resulted in about $7 Million more revenue. Compare that to the $481 Million in fare revenue collected in 2013, and it represents a 1.4% revenue bleed, which is not unsubstantial, but hardly breaks the bank. In comparison, the Congestion Improvement Tax (ugh, still hate that stupid moniker) will raise about $250 Million per year, all of which will go to Capital Projects, not operations.

When Bateman says “TransLink can’t properly manage the system they already have – they certainly can’t be trusted with another $7.5 billion of our money,” he is suggesting not just that this fare evasion is a huge problem, but that TransLink is incompetent at stopping it. What he doesn’t suggest is a way to close that gap, and there is a good reason for that: diminishing returns.

Yes, we could put an armed guard on every bus enforcing payment and issuing receipts, and fare evasion would approach zero, but it would be prohibitively expensive, and the return on revenue would not cover the cost. This has been the central story all along on the Falcon Gate fiasco – TransLink was forced by the Former Minister of Transportation to install an expensive faregate system that TransLink knew would never cover the cost of the fares evasion it was meant to prevent. (Oh, and it is just a coincidence that that the guy who tried to get that same Minister of Transportation made into the Premier is now going to lead the NO campaign for the CTF, but I digress).

Any rational person has to understand that fare-evasion-zero is not possible (just like Zero Tolerance on parking meter violations or speeding or drugs is impossible). A rational person with any business sense at all says that reasonable effort should be made to push that evasion towards zero, up until the point where the cost of those efforts exceeds the money saved through enforcement. Pushing past that point makes no monetary sense if the goal of fares is to earn revenue. I frankly don’t know what that magic point is – at what point further enforcement costs more than it is worth – but if I was a betting man, I would put my money on something around 1%, because that is a common number the tolerance TransLink and other transit systems gravitate towards. Bateman thinks it is a different number (closer to zero), but I’d like to see him (a person with no experience running a multi-modal transit system) demonstrate what that number is, and explain his rationale.**

But he won’t, because he is not interested in public policy or rational discussion. He is interested in getting headlines by making irrational arguments that clip well in order to get donations for his organization. And our media provide him that free advertising every day.

If you think I am being mean to Jordan Bateman, you are right, because he used to be someone I respected. As a City Councillor in Langley, he was a voice of reason and an excellent communicator. I didn’t often agree with his politics, but always liked the way he tried to explain his thought process through contentious issues. I know people who worked for him, and he had a reputation as a Councillor who did his homework, collected the data he needed to understand issues, and defended his decisions based on that knowledge. He knew that there was an objective truth and that good governance required it. He was the kind of City Councillor I want to be. This makes him a disappointment whenever I see him acting like a clown for the TV cameras.

Back then, Bateman not only had a much more rational approach to taxation, he was a supporter of increased capital funding to TransLink to provide improved light rail and transit service, specifically so his children would not be cursed with another generation of entrenched motordom. Unfortunately, he is now the one person in the province most interested in leading the campaign against exactly what he called for 7 years ago. And he has yet to provide any meaningful reason why he changed his mind.

And that is a shame. For him, for his kids, and for all of us who want to improve our region.

And I know just by responding to him, I am falling for some sort of Streisand Effect trap he is setting. The result? Just watch, 4 months from now, when the referendum campaigns are in full swing, scofflaw fare evaders and TransLink’s refusal to address this issue are going to be major points repeated uncritically in the media, as Bateman and his ilk keep hitting that drum while providing no actual context to the discussion, until it becomes just another part of the “common sense” that no-one can deny. The lie will become truth, thanks to a guy who used to know the difference.

*Actually, the ever succinct Canspice points out bus boardings in 2013 were actually 228 Million, my number includes SkyTrain boardings. I’m not sure which number is better to use, but I guess whether you are trying to make the point that Bus Drivers are useless or that TransLink is incompetent. As noted by Canspice, if your argument is simply the CTF’s standard “ALL TAXES BAD!”, then I guess it doesn’t matter.

** In looking for this number, I found two fascinating research papers, one using Game Theory to determine if Fare Gates make sense for a public transit system (Optimal choices of fare collection systems for public transportation: barrier versus barrier free: Yasuo Sasaki, Transportation Research Part B: Methodological Volume 60, February 2014, Pages 107–114) and another using multi-variable calculus and economic modelling to determine what the optimum fare inspection rate is for a proof-of-fare transit system like SkyTrain (Fare evasion in proof-of-payment transit systems; Deriving the optimum inspection level: Benedetto Barabino, Sara Salis, and Bruno Useli, Transportation Research Part B: Methodological, Volume 70, December 2014, Pages 1–17).


Who pays for roads?

Once again, a casual conversation I had around a transportation issue led me to look for the data to support my long-held belief. I think I already had this data, as I like to convince myself that data is what most of my long-held beliefs are based on, but I’ve been wrong before, so it never hurts to check yourself, in case you are caught in the same conversation again. Run-on sentences are cool.

In this case, it was a version of the old “There is no need for road pricing, because I already pay for roads through gas taxes” or “Cyclists have no right to the road unless they register and pay a tax” narrative that I was arguing against. The central narrative is that gas-burners pay for roads, ostensibly through Gas Taxes or some other tax that non-drivers don’t pay. My long-held belief has been that gas taxes don’t pay for your roads, nor do ICBC rates or drivers licence renewal fees. The average cyclist likely pays just as much tax as the average car driver, they both pay for the roads (or, more likely, the average cyclist and the average driver are exactly the same person, as pretty much everyone I know who rides a bike also drives a car sometimes… but I digress). It did get me thinking – how much of what the average Lower Mainland driver pays for a car actually goes to maintain the road?

The first part of this is to determine just how much the average Lower Mainlander pays per year to drive the average car. Luckily CAA collects this data on an annual basis, so there is a single source for this number.

Click to make Bigger, borrowed from BCAA, probably illegally. 

Let’s start setting assumptions, lots of people drive compact cars ($9,543 per year) and lots drive SUVs ($12,666 per year), most of the other categories are between these, so let’s pick the vehicle that is closest to the mid-point between these, which is a “Crossover” at $10,745 per year to operate. We have to also assume the average person drives an average amount, and their cost breakdowns are about average. You can see where I am going here, so I am going to try to reduce the use of the word “average” from here on in, and you are not going to use anomalous end-member data to criticize the following analysis. Deal?

Click to make Bigger, borrowed from BCAA, probably illegally. 

According to the Car-Knobbling Council BCAA, your Crossover will cost you about $1,831 a year in fuel, $1,760 in insurance and registration, and about $7,198 (!) in depreciation and maintenance. Neither Esso nor Canadian Tire build roads (excepting, of course, in that they pay taxes, and that goes to roads, but that is true no matter where you spend your money- at the Chevy dealership or the bike shop, so that argument goes nowhere), so we can assume that when we talk about paying for roads through our cars, we are talking about the paying tax for through using things that are part and parcel with using the road. The ICBC part is a special case I’ll have to hit on later, as this is already getting long.

Let’s figure out how much tax you pay to run your car.

For that $1,831 you spend in a year for fuel, the calculator assumes your gas costs you $1.25 per litre, which works out to 1,465 Litres of fuel (I know gas is more expensive now, but I’d rather use numbers from an independent source than make shit up). According to the most independent source I can find, struggling gasoline retailers, $704.42 of this (just over 38%) is taxation at the retail level. This includes $146.50 in Federal excise tax, $97.15 in carbon tax, $249.05 in “transit tax”, $124.53 in Provincial gas tax, and $87.19 in GST.

Per-litre cost of fuel, according to Petro-Canada. Click to read.

These are each individual revenue streams, so I apologize in advance for the complicated stuff below.

The Federal excise tax goes into the Consolidated Revenue Fund – it all gets stuck in a big pile and mixed infinitely with all the other money the federal government collects, from the 16% duties on Ecuadorian wool socks to the income tax that came off your last paycheque. However, the Feds do pull $2 Billion a year out of that fund, (misleadingly) call it the “Gas Tax Fund” and transfer that directly to municipalities through a slightly convoluted allocation formula. Considering about 40 billion litres of gasoline are sold in Canada every year (not including diesel – which has an excise tax of $0.04/L on sales of 17 Billion litres annually), somewhat less than half of the Federal excise on gasoline is reinvested into this infrastructure fund (which makes the name misleading). Of that less-than-50% approximately 28% is spent on local roads and bridges.

So crunching the numbers, the $146.50 of federal “gas tax” spent by the average person, about $20 goes towards roads.

The Carbon Tax is much simpler to work out. Exactly 0% of it goes to roads. The Province has been quick to point out and reinforce that the carbon tax is “revenue neutral” – it only goes to offsetting income and corporate taxes, and to providing a $200 cheque to rural British Columbians who own a house. All that just to kill a few jobs.

The “Transit Tax” is the TransLink gas levy, and some portion of that does directly go to maintaining roads and bridges. Looking at the TransLink Base Plan for 2014, we can see that TransLink collects $331 Million per year on its gas tax (on about 2 Billion litres of fuels sold in the TransLink area annually), which is 23% of its total revenue. Of this total revenue, about $119 Million (or about 8%) is spent on Roads, Bridges, and Cycling. So just as the federal money goes in to one big consolidated fund from which road money is drawn, the money TransLink gets is pooled and re-distributed (otherwise, their road spending would be decreasing as the gas tax revenues decrease, and that is not happening).

So of the $249.05 of Transit Tax, about $19.92 goes to the roads your drive that car upon.

The Provincial tax is much harder to estimate, as it all also goes to General Revenue, as does the GST hit, of which even a smaller proportion is transferred to the Province for roads spending. So let’s ignore the usual whinging about deadbeat have-not provinces and assume 100% of the GST comes back to the Province, and is pooled with the PST. How much does the Province spend on Roads? According to their recent financial plan, the annual Ministry of Transportation budget is about $800 Million, and a further $1.3 Billion on Infrastructure investment for transportation, meaning $2.1 Billion is spent on transportation. Of course that includes roads and bridges, along with cycling, transit, rail, Ferries (coastal and interior), gondolas, and the Mountain Pine Beetle Strategy (!?). This sounds like a lot, but it is only 4.7% of BC’s annual revenue. Given these very, very generous estimates, something like $10 of the average PST/GST cost of the annual gasoline bill goes to transportation.

That’s it: $50. That is the “toll” the average British Columbian pays every year for using the roads through gas taxes. Notably, this amounts to a “road tax” equal to one half of 1% of the annual cost of owning and operating a car.

There are, of course, major flaws with the above analysis, but none of them change the underlying premise.

First, most of the roads you use every day are paid for and maintained by your municipality, whose revenue sources do not include gas taxes (excepting the transfers from TransLink for the Major Road Network, and a portion of that Gas Tax Fund infrastructure money).

Thirdly, this analysis assumes that people who don’t buy gas do not pay even more for roads and bridges through their other expenditures. A daily driver gives $249 a year to TransLink in gas tax, but a daily 2-zone Transit Pass user gives $1,488 to TransLink in the same year. A daily SkyTrain user pays 6 times as much towards TransLink’s roads budget than someone who drives their car on a road every day. Of course, they both use the roads, just like pedestrians and cyclists and squirrels (who get off comparatively Scot free), but only the transit riders uses the Skytrain. Except that being on the SkyTrain gets her out of the way, “freeing up traffic”, which benefits the road driver.

The big exception is that people who don’t spend $1,831 a year on gas – or $7,000+ a year on a depreciating piece metal – don’t usually stick that extra money in the mattress. They usually spend it on other things. Like bicycle parts, or shoes, or peanut butter sandwiches (which is pedestrian fuel) or iPhone apps or pez dispensers or lottery tickets, beer and popcorn. Every dollar not spent on gas is likely spent in other ways, and when spending on things (be they car things or non-car things) they provide revenue in the form of sales taxes and in income taxes of the people who are selling stuff. That is the nature of our economy. Through the magic of “General Revenue”, just as much of those taxes go to funding roads and bridges as the sales taxes on gasoline does. In this sense, the more you use the roads, the less you likely pay for your share of their use.

As a bonus, that money is most likely not spent on things that destroy the atmosphere, as few things in our society have the same atmosphere-destroying capability on a dollar-by-dollar basis, than 1,400 Litres of gasoline.