The first week of January is when the BC Assessment Authority releases their annual report on property values, including your personal assessment and regional trend data. More often than not, this is followed by some hyperventilation on line and in the media: How the hell does this keep happening? How unaffordable can housing get? What can be done? I’ll avoid those topics in this post* and let the media and pundits answer those in the way that serves their interests best. I just want to talk about New West, assessments, and taxes, since Council is going to be talking annual property tax increases on Monday.
The City is working towards a budget with a 4.4% tax increase. I’ve written about how we got to that number, and will write more after next week’s meeting, but until then I am going to assume that is what Council is going to vote for, and use that number as a placeholder to talk about the below.
A 4.4% tax increase does NOT mean your property tax bill will go up 4.4%. It might, but it is more likely to go up a little more or a little less than that, depending on what type of home you are paying taxes on, and how its assessment compares to the average across the City.
Here are the numbers from the BC Assessment authority for the “average” property in New West: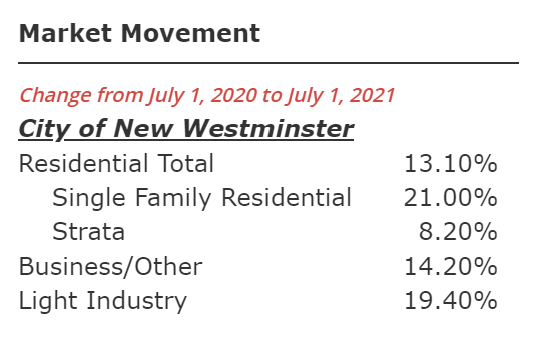 All residential properties went up 13.1 %, but Single Family Detached houses went up more than this (21%) and Condos went us much less (8.2%).Since tax increases are based on the average value, this means taxes will be going up more for most SFD, and less for most Condos. Indeed, at the current proposed rate, the average Condo may not see any increase at all.
I’m going to use fake numbers to demonstrate how this works, because that level of detail is unnecessary to make clear how this works, and complicated math makes explanation complicated. This really isn’t that complicated. However, I note there are two confounding factors I need to mention here, because they matter. The City adjusts its tax rate based on all assessed land values, and I am only dealing with residential here, and am ignoring commercial and industrial. Also, I am only dealing with the part of your property tax bill (63%) that the City sets and collects, the blue part in this pie chart: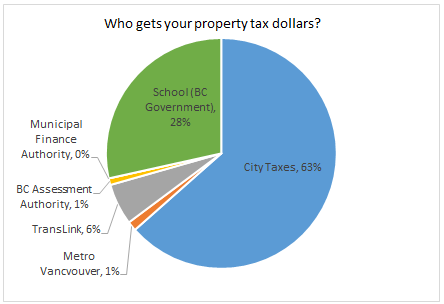
The rest is set by the province, and the City neither has control of it nor sees the money, so I can’t talk too much about them except to note they are there.
Ok, with those caveats aside let’s imagine the City collected $100 Million in taxes last year, and the combined value of all the properties in the City was $10 Billion. The City would need to set a tax rate (called a “mill rate”) of 10 to collect those taxes. This is the math:
($10 Billion in properties) / $1000 = 10 Million;
($100 Million in taxes) / 10 Million = (mill rate of 10)
As a property owner who owns, say, a $100,000 home, you use the mill rate like this:
($100,000 property value) / 1000 = 100;
100 x (mill rate of 10) = ($1,000 in taxes)
So lets then lets assume the next year the City Council decided it needed $104.4 Million to run the City, and therefore property taxes have to go up 4.4%. If the property values didn’t change at all, this would be simple, as the Mill rate will go up 4.4%:
($10 Billion in properties) / 1000 = 10 Million.
($104.4 Million in taxes) / 10 Million = (mill rate of 10.44)
But lets imagine, instead, that the City gets a report from the BC Assessment Authority that says the combined value of all properties in the City went up by 10% over that year. That changes the math:
($11 Billion in properties) / 1000 = 11 Million.
(104.4 Million in taxes) / 11 Million = (mill rate of 9.49).
Taxes went up, but the mill rate went down, because the inflation in property tax was lower than the inflation in property values. This will be the case in New West in 2021 where average values went up 13%, but taxes are only projected to go up 4.4%).
Now, we can talk about how that change in mill rate impact individual properties, becasue they do not all go up in value the same as the average. If in the last example (average property increase of 10%, tax increase of 4.4%) the property you own increases in value the same as the average, then the mill rate applies to you exactly as it does to the average, and you end up paying 4.4% more taxes. But what if your house goes up 2x as much as the average, and your neighbour’s house doesn’t go up at all? You end up paying a different amount of tax:
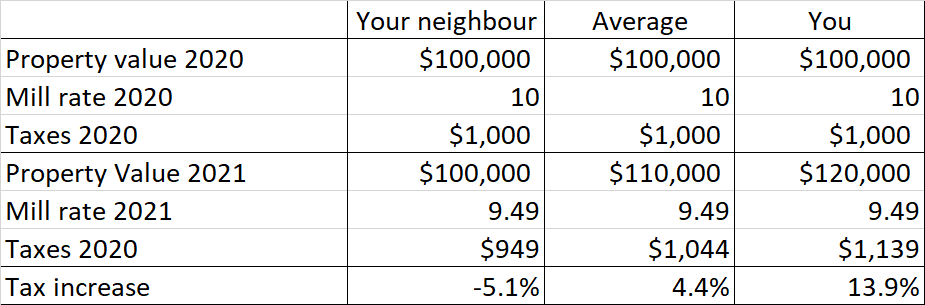
This will happen across New West this year. As the BC Assessment report that I mentioned in the opening showed that SFD houses went up 8% more than average of all city wide residential property values, so the 4.4% tax increase for the average SFD will be in the order of 12%. At the same time, the average Condo value increased 5% less than average, meaning that property taxes for the “average” condo should go down a little bit. If that doesn’t seem fair to you, all I can say is I didn’t invent the system, I just report it.
*(supply and demand; very unaffordable because the most comfortable are being made more comfortable through this; we can start building differently)
Addendum: The New West Record points out that the BC Assessment news release says the “typical” SFD home in New West went up 24% in value, which is a different number than the 21% they have in their Market Trends table or their interactive map (where my table above is from). Not sure what that is about, maybe a typo, maybe a mean-mode-median thing. Anyway, take the exact numbers with a grain of salt?