The 2021 census data is starting to trickle out. The first release of data is on population and housing, which is obviously a hot topic in the Lower Mainland. This means there are a lot of news stories about what has changed since last census in 2016. However, because of the work I do, I prefer to look at the change over the full decade since 2011. This is because 2011 was the “baseline” population level that the 2040 Regional Growth Strategy for Greater Vancouver is pegged. Since every municipal Official Community Plan was developed in context of the 2040 RGA, and since we are currently updating to a new 2050 RGS, I thought it would be good to re-look at Greater Vancouver population change in comparison to the RGS with the new census data.
Regular readers (Hi Mom!) might remember me doing something like this last year with the 2020 Stats Can population estimates. As it turns out, actual counts are more accurate than estimates*EDIT – see below*, and an update is required. Here is the table of Municipalities with 2021 Census population sorted by the rate of growth since the 2011 Population used for the Regional Growth Strategy (yes, I excluded the minor Municipalities like Anmore and Electoral Area A, for simplicity, laziness, and because I can).
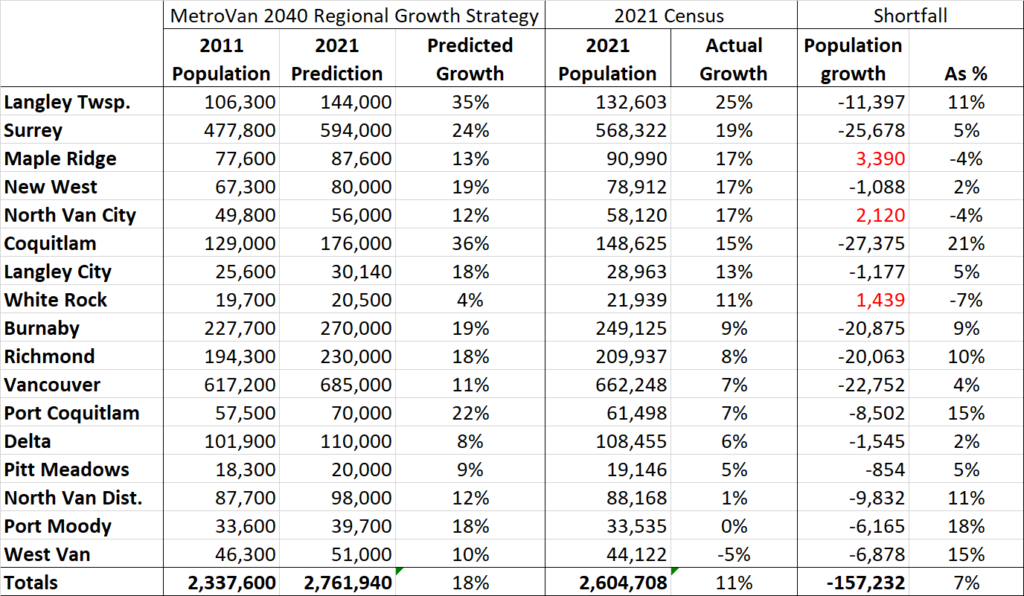
Where to start? Overall, the region (excepting those small Munis ignored above) grew by an overall 11% over that decade, falling far short of the predicted growth of 18%. This means there are at least 157,000 fewer people living the in Greater Vancouver than expected. Only three Municipalities added more population than the RGS expected: Maple Ridge, the City of North Vancouver and White Rock. That last one might be a surprise, but remember White Rock had the lowest predicted growth over the decade, and so their growth being on par with the regional average put it way above what was expected.
Note that North Vancouver District and Port Moody have essentially not changed in population over the last decade (though found two very different political pathways to this lack of change) and West Vancouver lost population. The overall result is that every region of greater Vancouver fell short of the predictions, excepting the Northeast corner of the regional district.
The story locally is that New West also surprisingly fell short of the RGS goals, though only by a small amount. Nonetheless our 17% growth rate was one of the fastest rates in the region. This is perhaps more remarkable when you note the only Municipalities growing at a faster rate happen to be the 3 easternmost ones – those with the greatest access to greenfield into which to sprawl.
Which bring us to the other New Westminster headline of this census release: New Westminster being touted as the major municipality with the second highest density in Canada. This is interesting, but I may argue this is a bit of an artifact of the data and political jurisdictions.
We are surely a dense urban community, which is a natural result of being the nucleus of a rapidly growing urban area for more than 150 years. Our footprint is compact (under 16 square kilometers) and we don’t have farms or large undeveloped areas of forest, having chopped most of those down about 150 years ago. Our urban form was mostly established before the automobile era, and was not extensively re-drawn with Motordom.
However, this does not make us that different from many older urban areas of Canada. But in looking at the data, we need to remember that satellite centres of Toronto or Montreal are amalgamated into one larger municipality. Shown at the same scale using Censusmapper.ca and population density data, it doesn’t immediately appear that New West (as a 79K population commuter suburb of Vancouver) is much denser than, say, the arguably comparable (population 72K commuter suburb of Montreal) neighbourhood of Verdun. 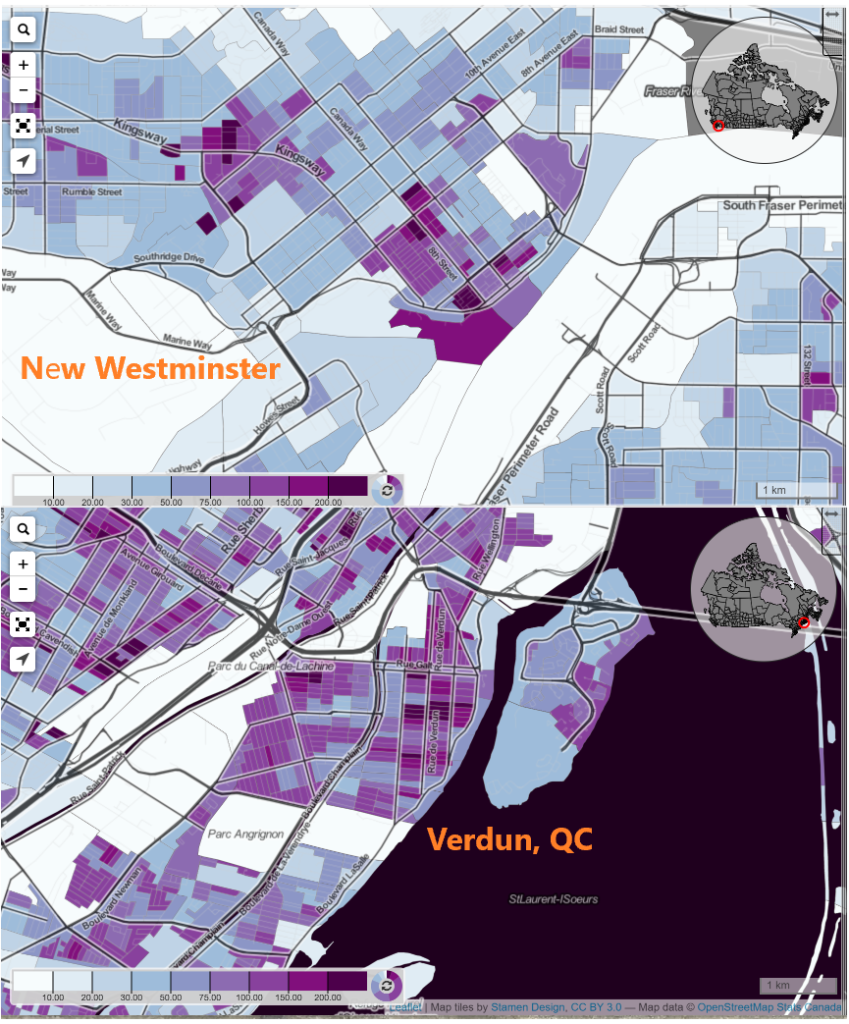
I’m not ready yet to say what it all means, as there is more data and mapping to come out. However, New Westminster is part of a region facing a long-standing housing availability crisis, and more acute housing affordability crisis. We may be bringing on supply as fast as anyone in the region (and faster than most) but at 79,000 people, we are still only 3% of the region’s population, and addressing the supply crunch is going to take more than New West can do alone. We need more action across the region.
At the same time, I am proud to say that New West is bringing in not just supply, but a diverse type of supply. Market condos are meeting the region’s most aggressive Family Friendly Housing policies. We are approving more Purpose Built Rental than we have in decades, and we have truly affordable housing options being built across the City as fast as the funding for these units becomes available. Though the value of land has shifted regionally past where rowhomes and townhouses represent “affordability” for most families, we are starting to see a big uptake on this type of build in traditionally Single Family parts of the City, and this long-standing gap in supply is finally being filled. We are also bringing this supply on while protecting the more affordable housing in the City, for the most part avoiding the mass displacement of people from existing lower-cost housing through strong policy. We have a lot of work to do, but we are on the right track.
*EDIT *: TIL: I’m completely wrong on this point. Census population estimates may actually be a more accurate count of the number of residents living in a municipality, because they account for the way the census systematically undercounts. Read more here, if you care. Fascinating!