The full election results are available on the City website, and as I have done in the last couple of goes-around, I like to look at the poll-by-poll results and infer a few things. Of course, others have taken this on and provided their own analysis, but I love to stick to a trend once I start, which in part explains the existence of this blog. Note: after boldly asserting I am NOT a political scientist, everything I write here has to be taken with a grain of salt.
This overlaps with the point that anyone in New West could vote in any polling station. One might assume that people vote in the station closest to their homes (as I did, voting early at City Hall), but there is nothing stopping someone from voting across town, so the geography of voting location is only a feeble proxy for the political leanings of that neighbourhood, which is the thesis of this entire post. Caveat Lector. But it is always fun to conject, so let’s have some fun. (Thanks Canspice for the image:
Starting with the Mayor’s Race, I marked the first place finisher in a poll with dark green, the second place finisher in lighter green. I also bunched the “Special Polls” and “Mail in” together as a single poll, for simplicity:
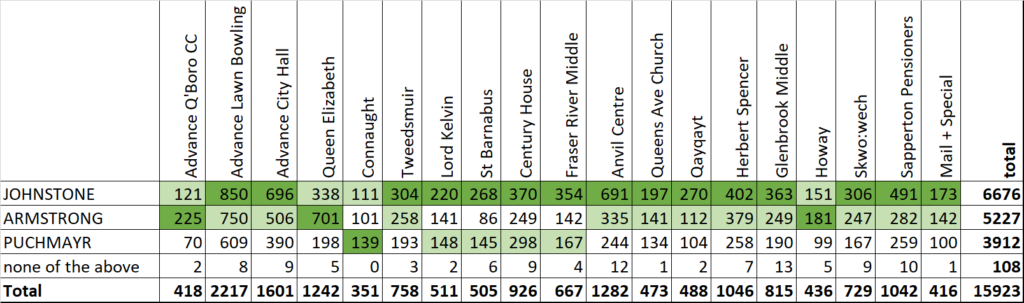
I finished first in most polls, and second in all the others, with my strongest polls being Downtown and the Brow, where I pulled greater than 50%. Armstrong won handily (~55%) in the two Queensborough polls, which represent about 10% of the overall votes. He also won the closer race in the Howay (Massey Victory Heights) poll. Puchmayr won Connaught Heights, which also happened to be the smallest poll, and the polls around his home in Moody Park generally had Puchmayr ahead of Armstrong in second place. As others have observed, there is a marked difference between multi-family and single-family neighbourhoods.
The Council race provides a bit more insight into how the vote was distributed. Here I shaded the first place finished in darker green, the second place finished in an apple green, and the other top 6 finishers in pale green. I used pale yellow for the three people just below the line, and no shading for the bottom three.
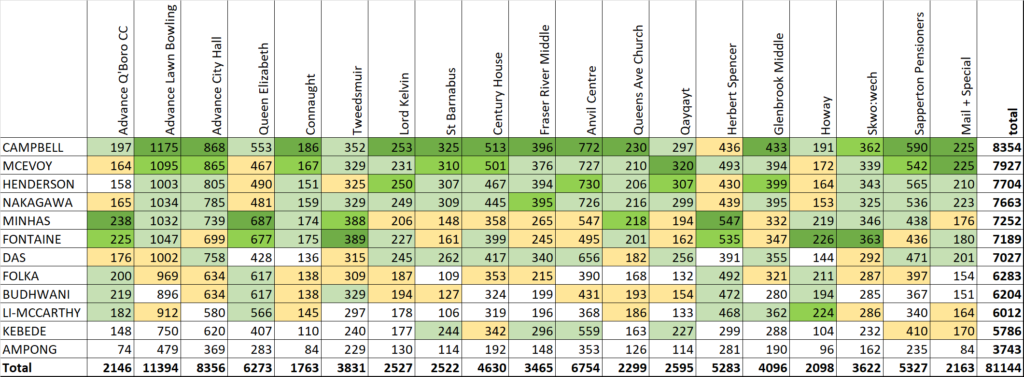
Much like Nadine Nakagawa last election, rookie candidate Ruby Campbell finished first overall by a good gap, and won the most polls. She finished first in 12 of the 19 polls, and second in one more. She “showed” (finished in the top 6) in all polls except (perhaps surprisingly) Herbert Spencer. Daniel Fontaine and Paul Minhas each led three polls, and Jaimie McEvoy was tied with Campbell for the favourite in the special polls, and was overall winner at QayQayt.
As most candidates were running with a party, there were clear trends related to those parties, and reflected somewhat the Mayor’s race. Community First had better results overall in most neighbourhoods, with the notable exceptions of Queensborough (the effect of Ken Armstrong being a Q’boro resident?) and Massey Victory Heights. The Progressives had a surprisingly strong showing at Herbert Spencer, which presumably draws most voters from Glenbrook North (where 3 of their down-ballot candidates reside) and Queens Park, but the same strength didn’t show at Queens Ave Church or Glenbrook Middle which would also presumably draw from Queens Park and Glenbrook. The two successful NWP candidates also had strong showings in Tweedsmuir (the West End) and Skwo:wech (Upper Sapperton), showing their appeal was broader overall this election than last, though again linked to single family neighbourhoods. The fact Queensborough didn’t show up for the one council candidate from Q’boro, when Downtown and the Brow did, will no doubt be the source of much deeper discussion.
And here are the School Board results with dark green for overall winner, apple green for second place, pale green for the rest of the top 7 finishers:
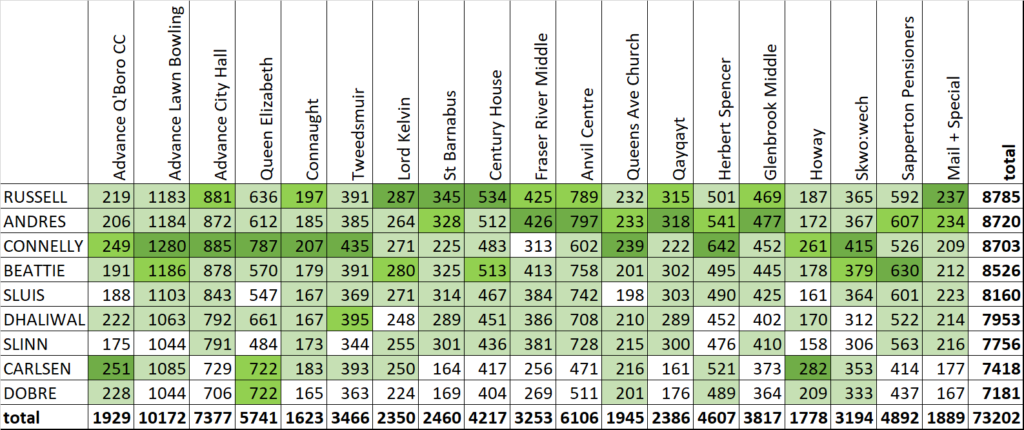
The results were close between the top three finishers, with third place finisher Connelly actually winning more polls (8) outright than Russell or Andres (4 each), who nonetheless had broader appeal across the City. Again, the NWP candidates followed Mayor and Council in having their strongest results in Queensborough and Massey Victory Heights, and Carlsen not able to leverage two first place and a second place finish into enough overall votes to get across the line. Aside from this single anomaly, it is perhaps surprising that party lines were not clearer. You could convince yourself that Connelly’s popularity pulled votes for Carlsen and Dobre in many polls, but it is far from consistent across the table.
Here is an interesting trend. Last election, about 21% of vote was cast at an advance poll. That went up to 27% this election. What’s interesting is in how the advance vote was distributed. Last election Team Cote got a bit more support at the advance than election day polls in comparison to the New West Progressives. This election, NWP candidates got an average of 28% of their vote in the advance polls, CFNW candidates only around 26% on average, with the Mayoral candidates having the biggest spread. See these tables with colour-coding for party affiliation and winners bolded:
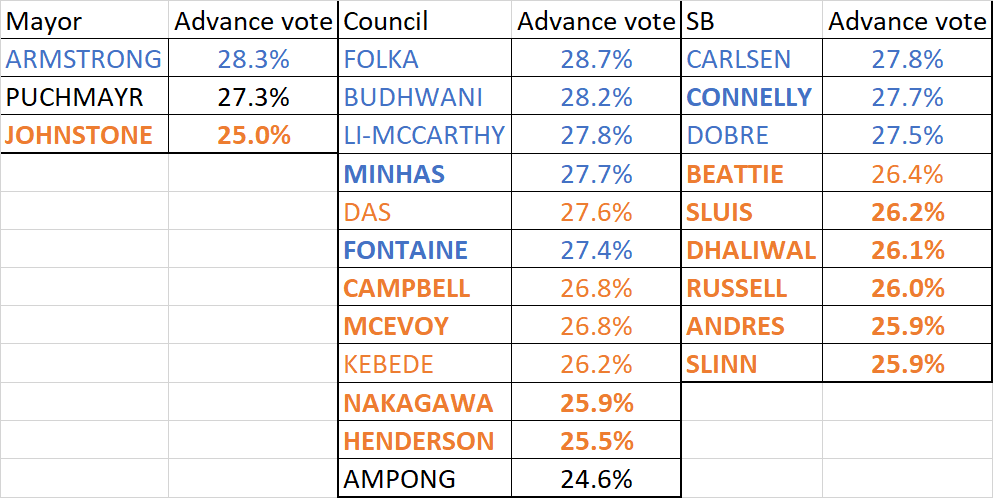
Now, 2% isn’t a huge gap, but it is such a consistent trend between parties that it can’t be a coincidence. The prominence of an advance poll in Queensborough (and relative NWP popularity there) is not enough of a vote gap to account for this, so we need to presume something shifted in overall popularity between the first advance polls and the final election day. Community First got more popular as the election went on. The said, if we only counted advance pollsthe results in the end would be pretty much the same. The only difference would have been Carlsen being elected instead of Slinn for the final School Board spot.
Finally, there were 15,923 ballots counted, but 108 of them (0.68%) did not select a Mayor Candidate. If we project that same number of ballots to the Council race, there were 95,538 potential Council votes (6 per ballot), and 81,144 votes marked, or 85%. With School Board and 7 votes per ballot, there were 73,202 out of a possible 111,461 (66%) votes cast.