Who else spent a rainy long-weekend day digging through regional housing stats?
Metro Vancouver tracks regional population and housing numbers in order to meet their mandate and track progress on the Regional Plan that the 21 member municipalities share. One of the public-facing parts of this tracking is the Housing Data Book they recently published, building on 2021 Census data and other data sources. There are graphs, maps and the tables of numbers to back them up. Its a great resource. Following on Mayor Pachal’s lead, I thought I’d look at it from a New Westminster perspective.
Thing is, regional planning is not a competition. Though I have been oft quoted suggesting that New West is more than pulling it weight on the housing front, I look through these regional stats to help understand where we are doing well, and where we need to find better solutions. So here are some graphs and maps pulled right from the Metro report, with a few comments.
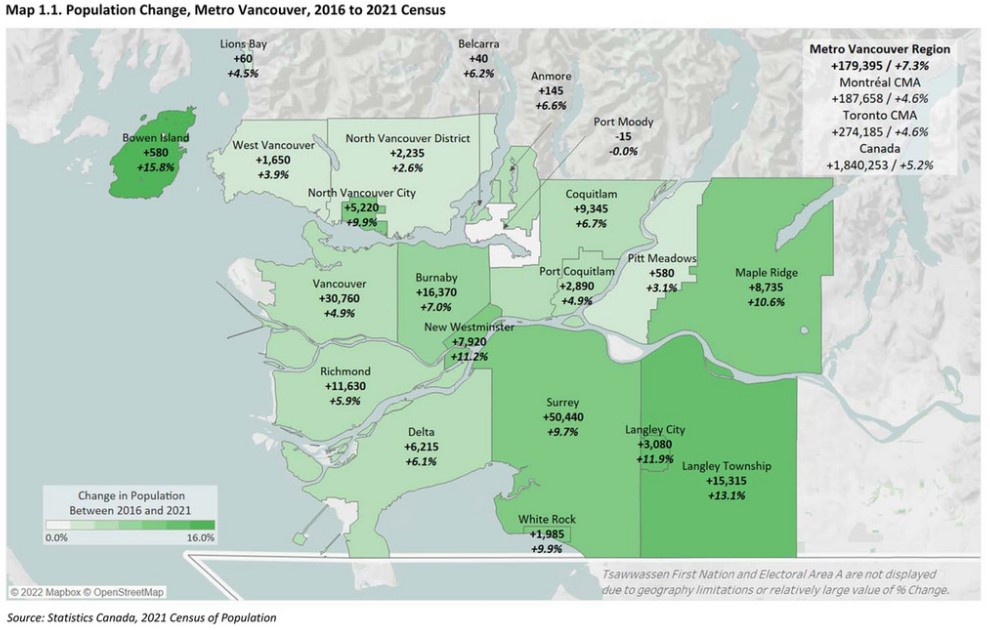
There is no secret New West is growing fast. At 11.2% growth between the last two censuses, we are one of the fastest growing communities in the Lower Mainland, and growing faster than the overall regional average of 7.3%:
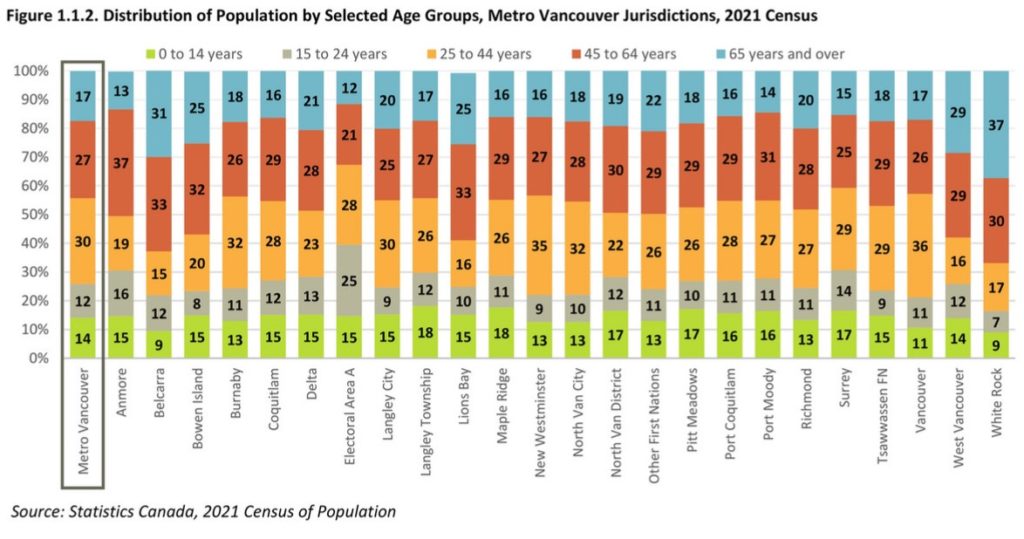
One interesting point about our demographics is that New West is not young or an old city, but is a millennial city. The proportion of our population between 25 and 44 years old is second only to Vancouver proper:
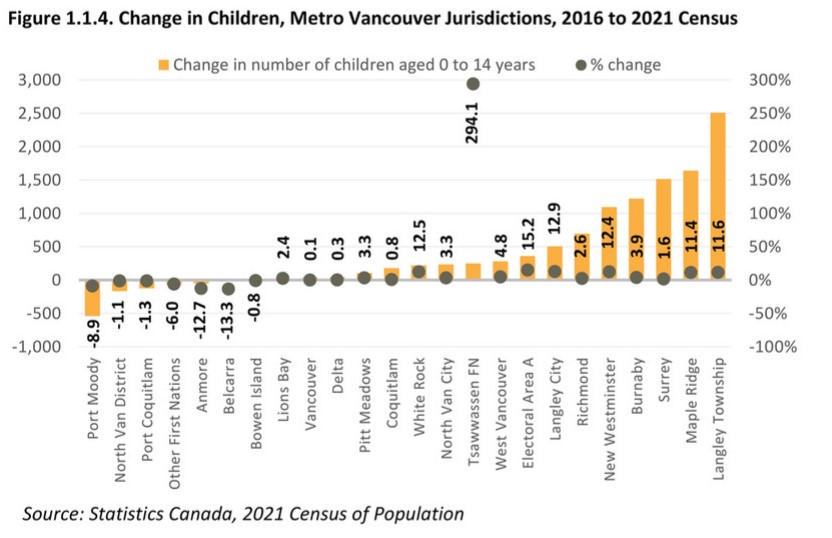
And a you might expect for a City with lots of people in that parenting age, we are one of the fastest-growing communities for the 0-14 age range (and if you want to know how we differ from Port Moody – look at that number!):
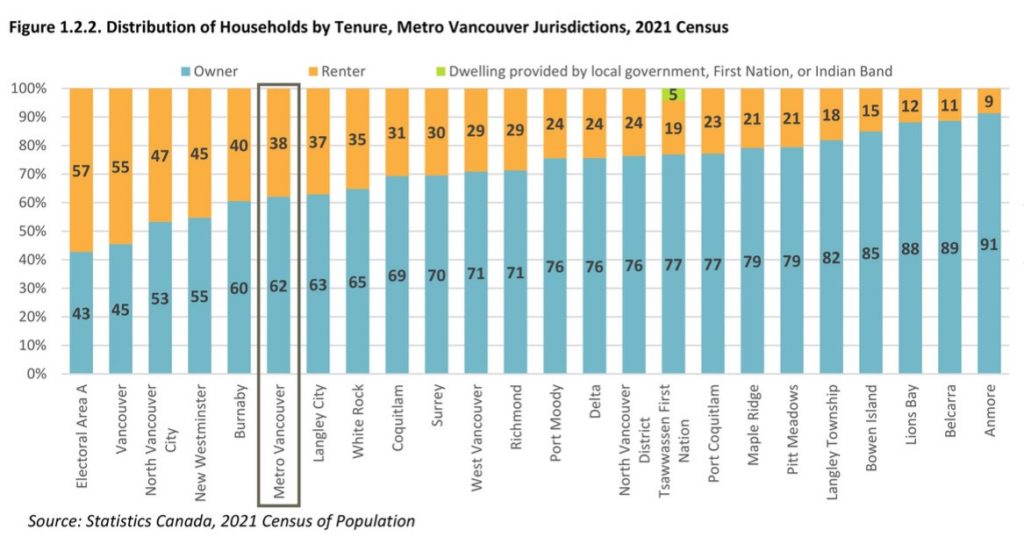
New West continues to have a proportion of rental households (45%) well above the regional average:
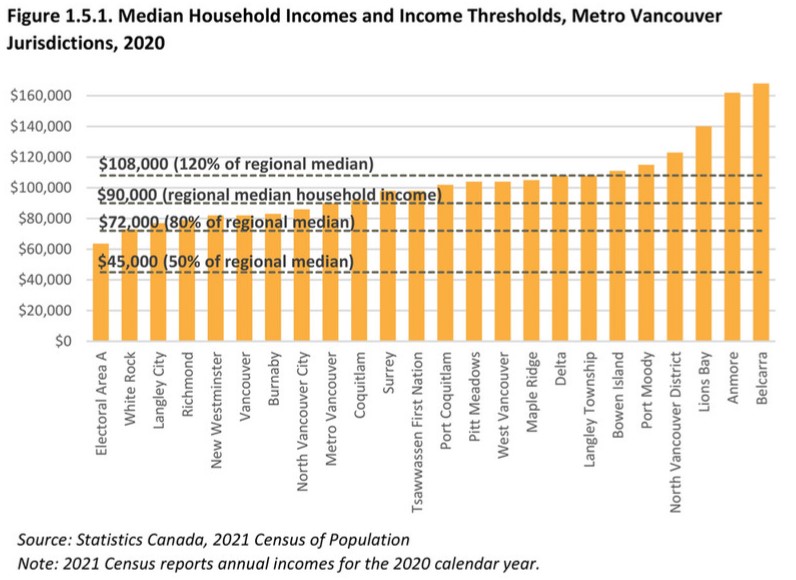
And probably a combination of those last few data points results in New West having a median household income a little lower than the average for the region ($82,000 compared to $90,000, or 9% below):
but our median household income is growing faster than the regional average:
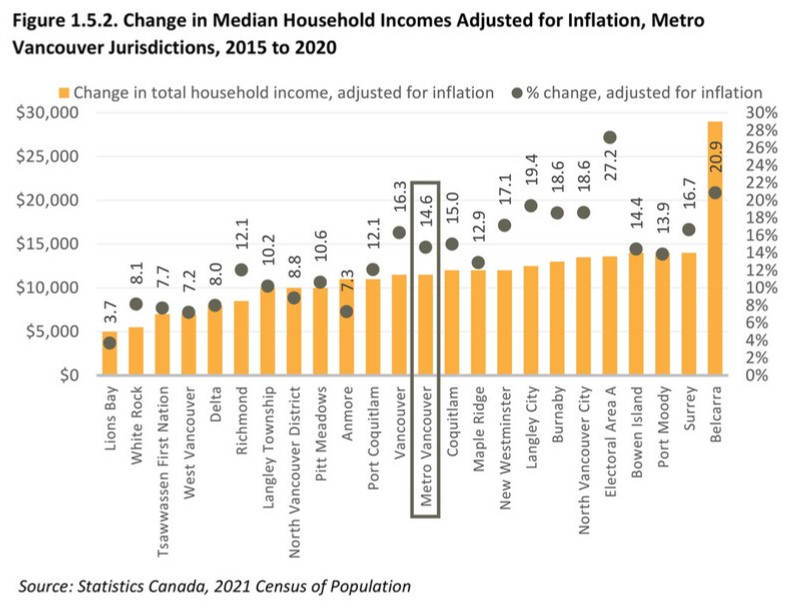
Now, that number is interesting. Between 2015 and 2020, median household income (inflation adjusted – using 2020 constant dollars) went up 17.1%. For the fun of it, I pulled up the data from the BC government on residential property tax burden (Schedule 707 available here) and found that per-capita property taxes over the same period rose about 13%. Using this calculator to adjust for inflation, per-capita property taxes only went up 8%. In short, incomes are rising much faster than property taxes.
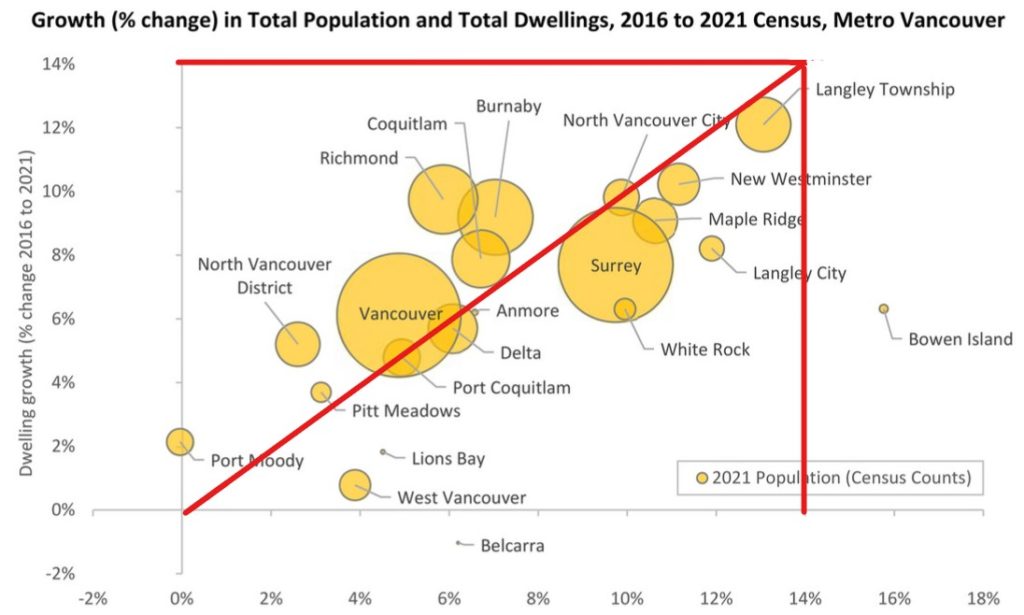
Now on to this pretty cool bubble chart, that shows the correlation between population growth and growth in the number of dwellings, with the size of the bubble representing population in 2021. I added the red lines to show what parts of the region are growing in people faster than in homes (Surrey, Langley City, West Van, and yes, New Westminster ) vs the cities where homes are being built faster than population is growing (Richmond, Burnaby and Vancouver). Again, Port Moody’s quixotic lack of growth stands out.
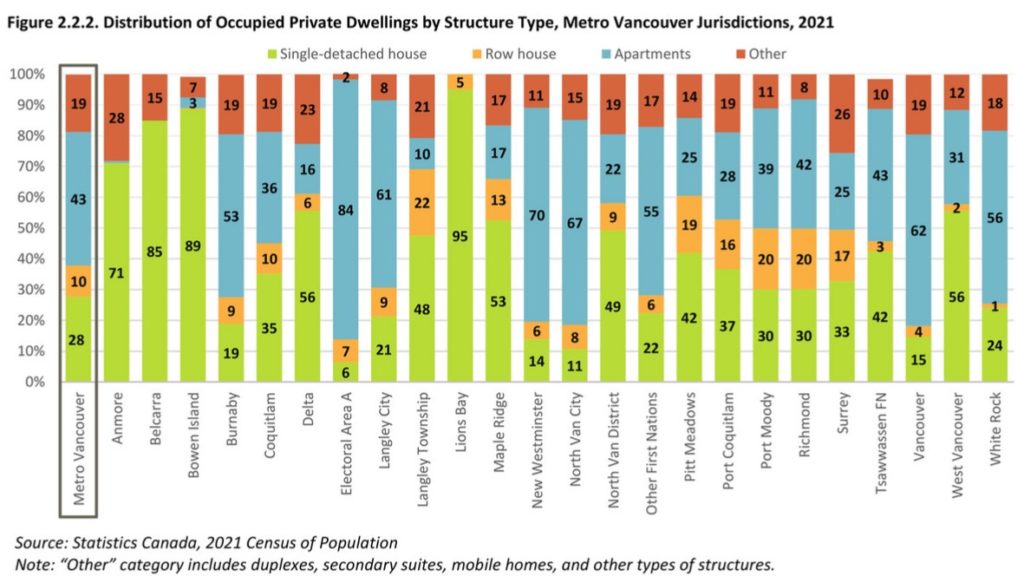
I’ll jump ahead here to housing types, and one of the big headlines is that only 14% of New West households are in a single detached home, one of the lowest proportions in the region, Note that people living in secondary suites in those homes would be counted as “other” in this statistic. The 70% living in apartments is second only to Electoral Area A (which is predominantly UBC campus, so would include a lot of student housing):
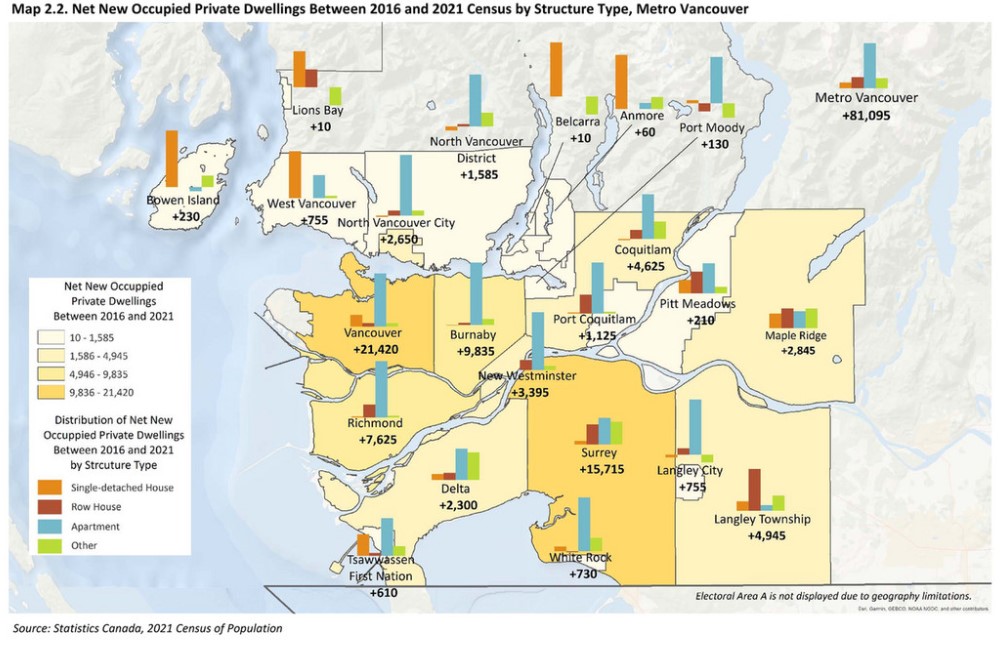
And as you might expect, almost all new homes being built in the City are in the form of apartments and rowhomes (including attached and stacked townhouses) with no net increase in single family homes (but also no real decrease either, like we see in North Van District):
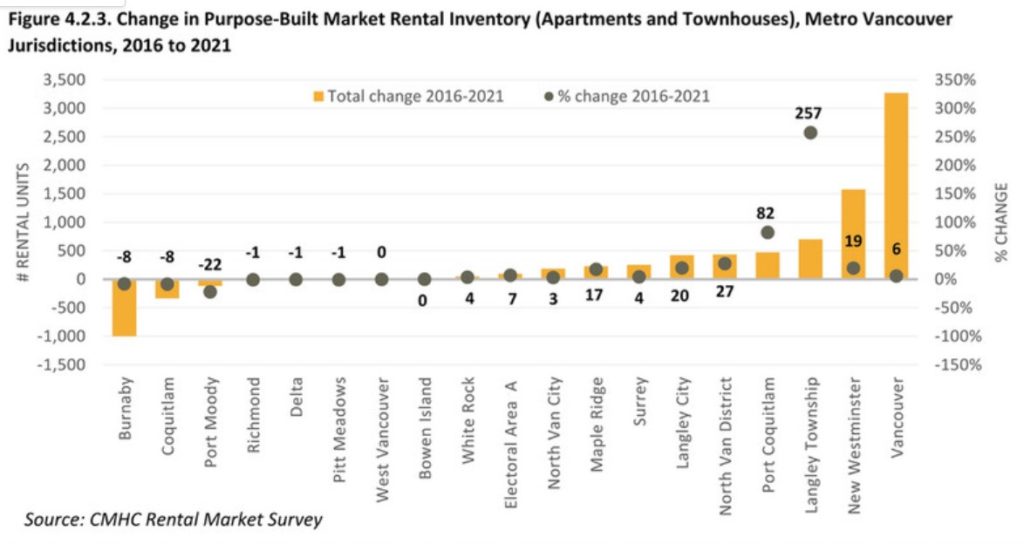
One place New West has been doing well is Purpose-Built Rental. We are getting more new rental built per capita than any other Municipality in the region, and more in raw numbers than any but Vancouver, while we are protecting the most affordable older PBR stock and are not letting it be replaced with condos (see the left part of the chart).
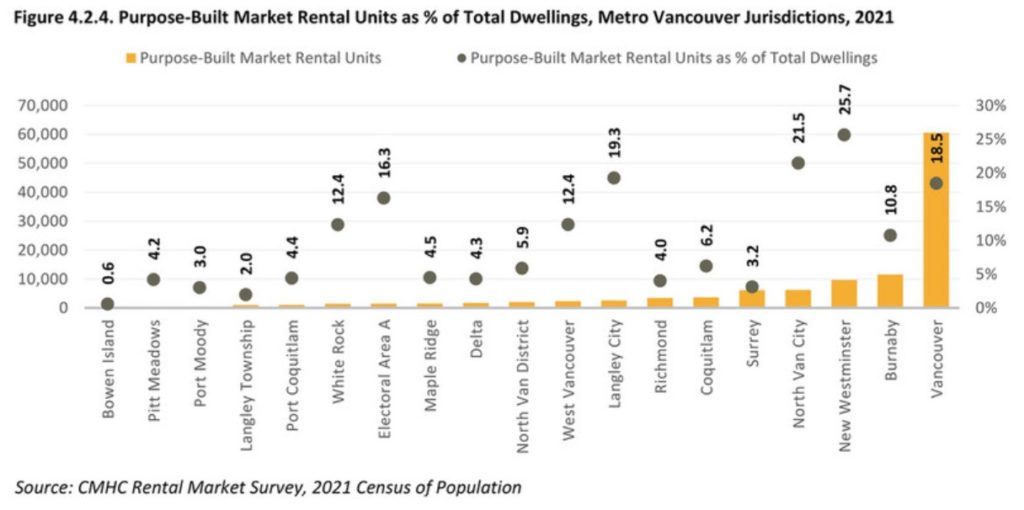
As a result, we now lead the region in Purpose Built Rental, with almost 26% of households in that housing type. This matters in a city where 45% of households are rental households, because PBR has one big difference over the “secondary” rental market (people renting out their condos or basement suites). That is in how they provide long-term housing security to renters. Any secondary market rental unit can leave the rental market at any time at the whim of the landlord, which is a precarious situation for the renting family. PBR brings increased housing security for the increasing number of working people in our community who cannot afford to buy.
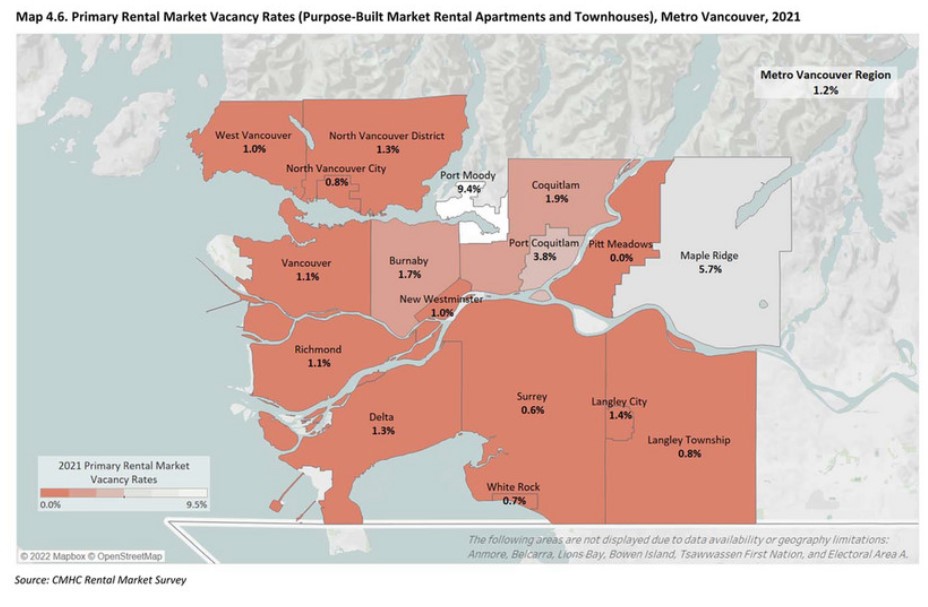
This is especially important as the Vacancy Rate is still dire:
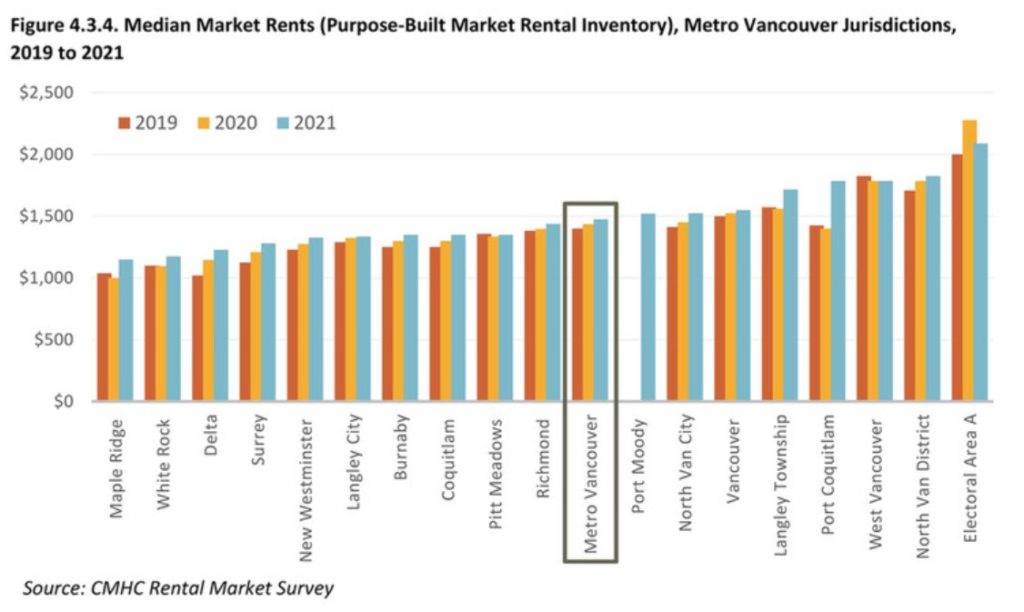
Which means upward pressure on rents is still a problem. Though, notably, New Westminster rents are not “in the top 10 in the country”, as they are not even the top ten in Metro Vancouver:
And here is why. New West cannot do it alone, our work to get us way over on the right side of those graphs above by building and protecting rental has not moved the regional needle, because we are only 3% of the population on half of 1% of the land area. When you look at rental inventory across the entire region this is the trend:
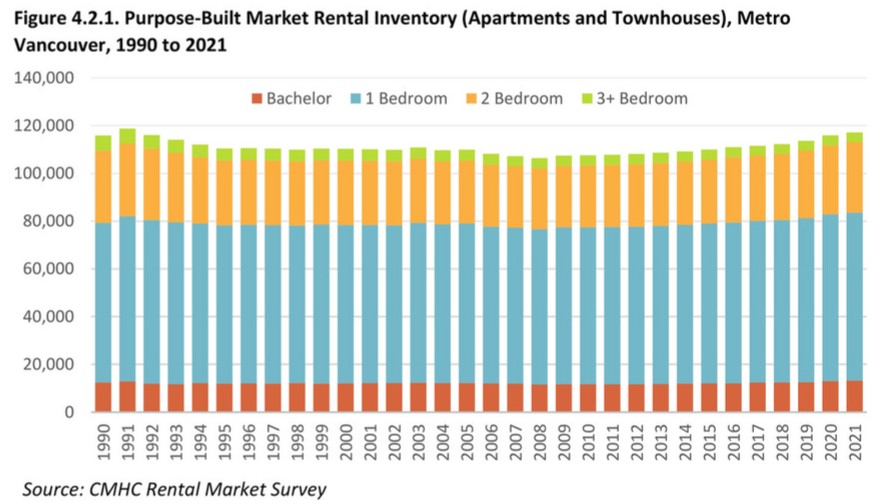
No meaningful change in raw numbers over 30 years. As the region’s population has gone from 1.5 Million people to 2.6 Million people, we have had no meaningful increase in the number of purpose-built rental homes. No wonder we are in a rental affordability crisis.
But cities don’t own all the blame here. This is largely a result of those destructive 1990’s Paul Martin budgets, when the Federal Liberal Government decided to get out of the business of housing, and of subsequent Provincial governments not stepping in to fill the gap. Without CMHC policy driving the building of new rental, with the province relying on the “the market” to fill rental need, with decades of being told home ownership is the path to financial success and tax structures that emphasize that, the market does what it does. The upward trend you see at the end is a result of the Province finally changing that two-decade practice, and (some) Local Governments shifting how we incentivize new building to make Rental viable again. But we have so much catching up to do.