No sign that I have been too busy to blog is more clear than the fact I have not had a chance to write about the election results yet. Things are settling a bit, and now that I can chew on the poll-by-poll results, I can start to throw some conjecture on top of my pre-conceived notions.
I have my own ideas about what went well during my campaign and what didn’t. I also put a lot of effort in during the campaign to get out of my own bubble and talk to people who didn’t know who I was and didn’t already support me. Yes, the NWDLC endorsement helped, as did the Citizen of the Year legacy. However, even I was surprised at the doorstep how large a percentage of voters cared about environmental concerns – the coal terminal, Kinder Morgan pipeline, and tree protection in the City came up more often than I might have expected. This last one really buoyed my confidence as the campaign went on. I also had an extremely successful fundraising program, which allowed me to buy a lot of ad space on paper and on-line. This definitely showed during the last week of the campaign, as people at the doorstep really started to know my name before I could introduce myself. “Campaigning” is from the Latin for “shameless self-promotion”.
However, identifying “my constituency” was a tough job. I think my support in the social media audience in the City (the “Twitterati”) was as strong as anyone’s, but by its very nature, this is small, distributed, and nearly impossible group to identify in poll data. I felt much more confident in identifying my opponents’ constituencies (e.g.: She’s do well in Sapperton, He’ll do well in Queensborough, etc) than I was able to self-evaluate. So let’s look at the data and see what we can imagine we see:
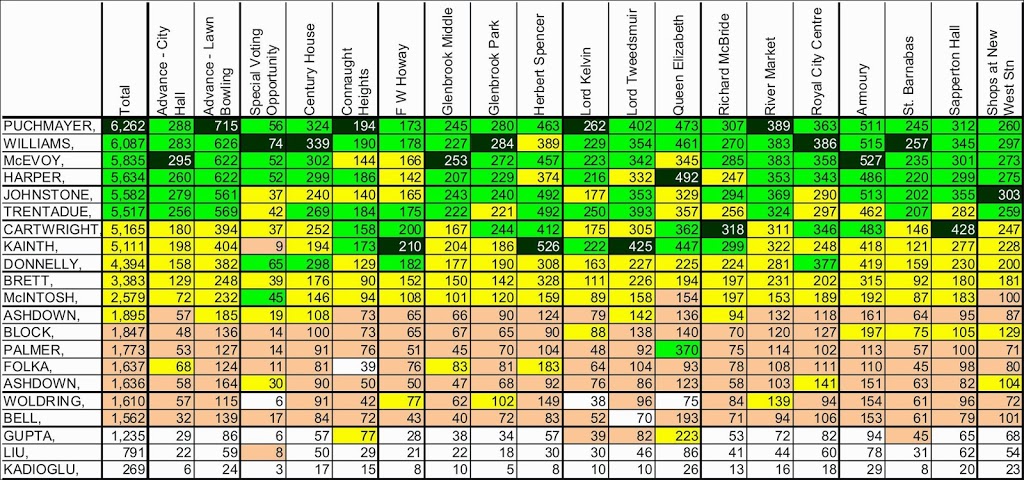
This table shows (unofficial!)poll-by-poll results. The winner of the poll is marked in dark green; the 2nd to 6th place finishers (i.e. the rest of the imagined caucus for that poll) are shaded light green; the 7th to 12th place fishers (let’s call them the shadow cabinet) are marked in light yellow, and the 13th to 18th place finishers (the also-rans) are shaded pink. The last three place finishers in each poll are not shaded. The next table is better for looking at overall trends, but this is better for looking at anomalies.
 |
| you are going to want to click to make visible |
It is clear the Puchmayr and Williams dominated this election. They led the total vote count by a handy margin, and won 9 polls between them. Of the 38 polls they were in (19 each), they were in the Top 6 in 37 of them. The anomaly being Williams finishing 7th at Herbert Spencer, apparently the victim of a surge in Kainth and Folka votes from that Queens Park/Glenbrook North catchment.
The other two Incumbents shared 4 poll wins, three for McEvoy and one for Harper. The former won three polls surrounding Queens Park, the latter we may start calling the “Mayor of Queensborough” with his solid win at Queen Elizabeth.
The Queensborough vote is also interesting in that only 3 of the people eventually elected finished in the Top 6 here, with Cartwright, Kainth, and (Queensborough resident) Palmer filling the top part of the poll. The other similar anomaly is F.W.Howay in Massey Heights, where again Cartwright, Kainth, and Donnelly finished toward the top. I can’t help but notice I was not in the top 6 in either of these polls. I read this as saying I got a push from being supported by the Incumbents, as the “protest vote” generally didn’t fall towards me. No surprise there, as I did not run a campaign of protest.
Speaking of protest, it appears the Great Sapperton Revolt promised by some during the lead-up to the campaign simply did not occur. Yes, Cartwright dominated the Pensioners Hall poll, and won the Richard McBride poll as well, but for the most part Incumbents did well in both of these polls, with almost all of them (4 for 4 in one, 3 for 4 in the other) finishing in the Top 6.
I have my own theory about the Cartwright result. She was a well-spoken and easy to like candidate who, in my opinion, sold well to the traditional Betty McIntosh voter. I suspect she drew much of the vote that Scott McIntosh was hoping to receive from the name recognition. This shows in Cartwright’s strong result in the polls where incumbents did less well, and in the two Sapperton polls where Betty usually did well. This may also be reflected in that McIntosh the Younger did not get a similar boost in those polls (his 10th and 11th place in those polls is where he finished in almost every poll).
Finally, I won a single poll – the one at the Shops at New West Station. I have no idea what that means – Who voted there? The residents of Plaza 88? SkyTrain users? People I met at SpudShack? If it was the Twitter/NEXTNewWest crowd, I would have expected Kainth to get a similar boost, but she finished pretty much at her average position in this poll. It’s a mystery to me what that poll means. Probably just another anomaly.
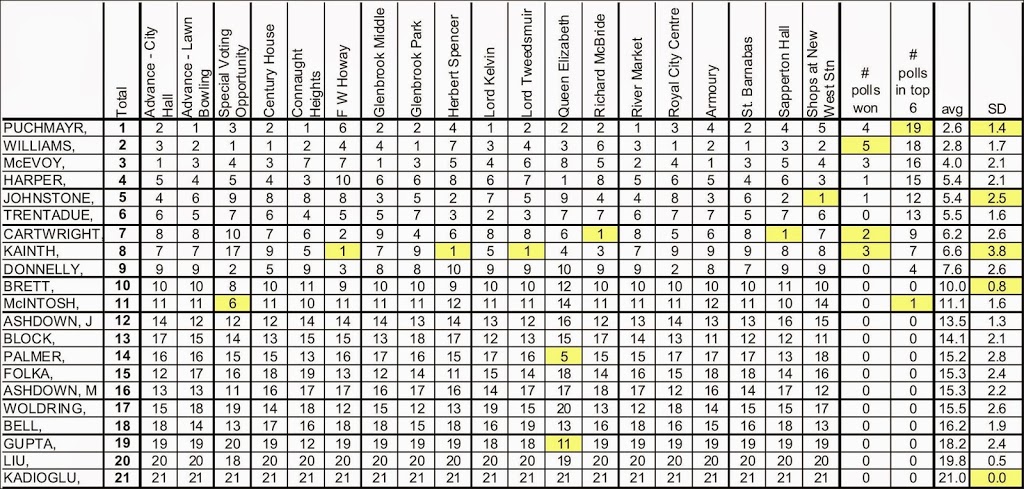
Another way to look at the numbers is to see what rank everyone finished in each poll; in this table, think of golf, as a low score is better:
 |
| yeah, click, in a second window, so you can refer back to it. |
At the right side, I added up every poll that the candidate won, and counted the number of polls in which they finished in the top 6. Then I calculated their average finish (which is only interesting in pointing out which polls the candidate finished higher or lower than their average), and the standard deviation (which showed some interesting results. The highlighted yellow squares are just numbers I wanted to draw attention to.
Again, the Puchmayr/Williams dominance is obvious. For us newbies, I won a poll, but Mary finished in the top 6 in one more poll than I did. It seems intuitive, but only those who got elected finished in the top 6 of more than ½ of the polls.
The Queen Elizabeth (Queensborough) poll isn’t as anomalous as one might expect, except that Palmer punched above his weight in his own neighbourhood, and Raj Gupta’s one-shot strategy of covering all of Queensborough with randomly-located signs definitely paid off, as he almost cracked the top 10, and wasn’t even close anywhere else.
Showing how important it is to get out of your “bubble” during the campaign, both Cartwright and Kainth won more polls than Harper, me, or Trentadue, but finished behind us because they had too many polls where they just didn’t show. The Standard Deviation column shows the consistency across polls. No surprise Kadioglu was the most consistent, finishing dead last in every single poll, but the consistency of Puchmayr is an example of what you need to do to win the election overall. I’m actually a little disappointed with my SD of 2.5, as I spent a lot of time every neighbourhood in the City. I spread my doorknocking around, especially early when I was purposefully trying to gauge and engage the populace in different parts of the City.
I think an interesting contrast is Kainth’s SD of 3.8 when compared to Brett’s notable 0.8, especially as I saw them as running very similar campaigns. They both had great sign strategies, spend a lot on newspaper and on-line ads, and had great social media presence. They also both have deep community roots and could conceivably draw from established constituencies. Despite these similarities, Kainth saw either very high or very low support where Brett was remarkably consistent, finishing pretty much 10th across the board.
Which proves, as I always expected, I know nothing at all about politics.
I voted at Shops at New West. Not sure who the other 302 people were, but now you know where one of those votes came from!