The City is having this on-going conversation about housing types. It is part of the consultation process for a new Official Community Plan. If you read this blog you probably care a bit about the future of the City, so you should take part. You can now do that without leaving the comforting warm blue glow of the computer you are looking at right now.
The OCP is a legally-required planning document the City produces, and it is usually updated every decade or so. The City is operating on a 1998 OCP that, despite regular updates and edits over the last 17 years, is getting very long in tooth. The process to update it has been going on for more than a year, and there have been several phases of public consultation, as open houses, as stakeholder meetings, and as special events.
Staff have gone out of their way to try to engage more people in this process so that resultant plan can better reflect the desires of the entire community, not just the easy-to-engage groups that are usually over represented in your regular City Open House. Now they have developed a new engagement tool, so you can sit at home on your computer or tablet and provide some useful insight to the process.
It comes at a time when the OCP is looking at housing types, and addresses what some have identified as a significant problem in New Westminster: we have a lot of apartments and an adequate supply of single family detached (SFD) homes; we have very little of the in-between housing types. Townhomes, row homes, du-, tri- and quad-riplex designs, and carriage/laneway housing. With the average SFD in New West selling over $800,000, young and growing families are running out of affordable options in our City, and it is the young, growing families that we need to sustain our community, our livability, and our community in the coming decades. If they leave (or are forced out by lack of flexible housing options), then our city will change in a way that few will like.
So the question to be asked right now is: How do those housing types fit in our community? Are there places this type of “infill density” makes sense, and places where it doesn’t? you can help answer this question by taking this on-line survey. But before you do, maybe I can explain a little more about how the survey works, and what you are being asked. So click this link, open a second window, and I’ll walk you through it.
When you open the survey, you can see there are 5 “pages”, and you are on Page 1, marked by a checkmark. As you go through each page, its page number will become a checkmark, so you can follow your progress.
Page 1 is just an intro with some factoids on it, and if you hit the “begin” button, it throws you to Page 2: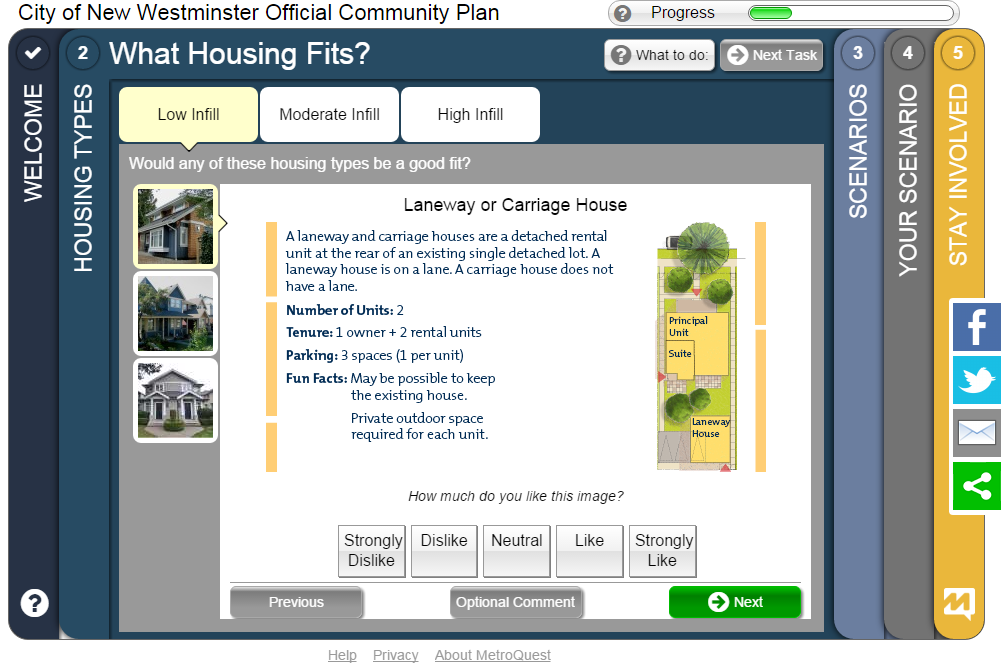 Here is where various housing forms are shown, divided up into three categories: Low, Moderate, and High Infill. In each of those three categories, there are examples of housing types, (4,3,and 2, respectively). For each of those 9 types, you can select what you think about it (from strongly dislike to strongly like, with “neutral” in the middle). You can also provide some comments for each by hitting the “optional comment” section at the bottom. You might have a specific concern about the function of any one type, or talk about the measures that would need to be in place to make that form work for you.
Not sure what these housing types really look like? The City has provided a couple of walking tour maps, one of Queensborough, another of North Vancouver, where some of these housing types are already built. You can print them off and go take a look, or just go into Google Maps and Google Streetview and have a look around. We live in the future.
If you provide at least “like” levels for 50% or more of the housing types, you get your check mark and can move on to Part 3: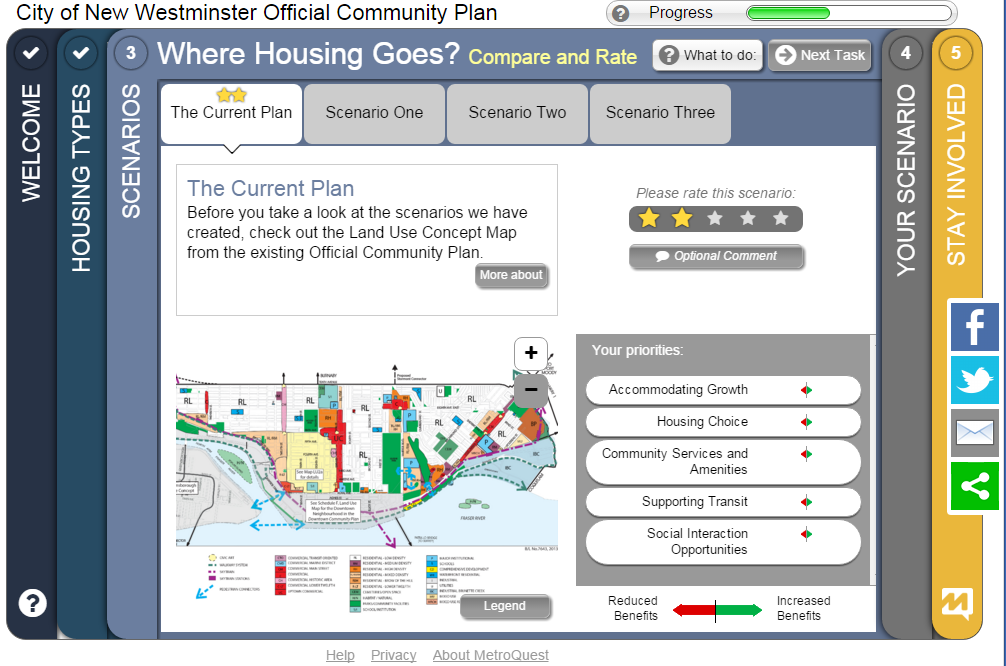 This page gives you a map of the 1998 OCP (which you can zoom into and look around), and provides you three “Scenarios” for a new OCP. None of these scenarios are necessarily part of a final OCP, but they are models used to gauge opinion and each address different neighbourhoods differently. At the roughest form, Scenario 1 would provide little more growth than we have today, Scenario 2 would provide more opportunities around transportation corridors especially, and Scenario 3 would provide the most opportunity to diversify our housing types, spreading the potential growth around a little more.
You can zoom in and scan around the Three Scenarios, provide a simple 1-5 star rating, and provide optional comments on what you like or don’t like about each Scenario. If you open the Legend, you will see the shades of beige reflect the “Low-Moderate-High” infill that was discussed on the earlier page, and that is where the detail really hits the ground here.
It is important looking at this to remember, if a neighbourhood or street are zoned for “medium infill”, that in no way means every house on that street is going to be knocked down and replaced with a triplex or row homes. Development simply doesn’t happen like that. Houses belong to individual homeowners, the City cannot tell them to knock their house down and replace it. Looking at the existing OCP from 1998 (The “current scenario” map), there are many areas where higher density is permitted than currently exists. For example, the extensive “RL/RM” medium-density area around the 22nd Street SkyTrain station is still single family homes 18 years after that OCP was adopted. Changes permitted on a lot-by-lot basis on an OCP ware not changes required by an OCP on a neighbourhood basis, and with growth occurring at between1-5% annually, these changes are very gradual. This is why we need to look decades ahead in these plans.
So poke around those three scenarios, see what you like or don’t, add your opinions, and give them some “stars”. This earns you a check mark, and lets you move onto Page 4: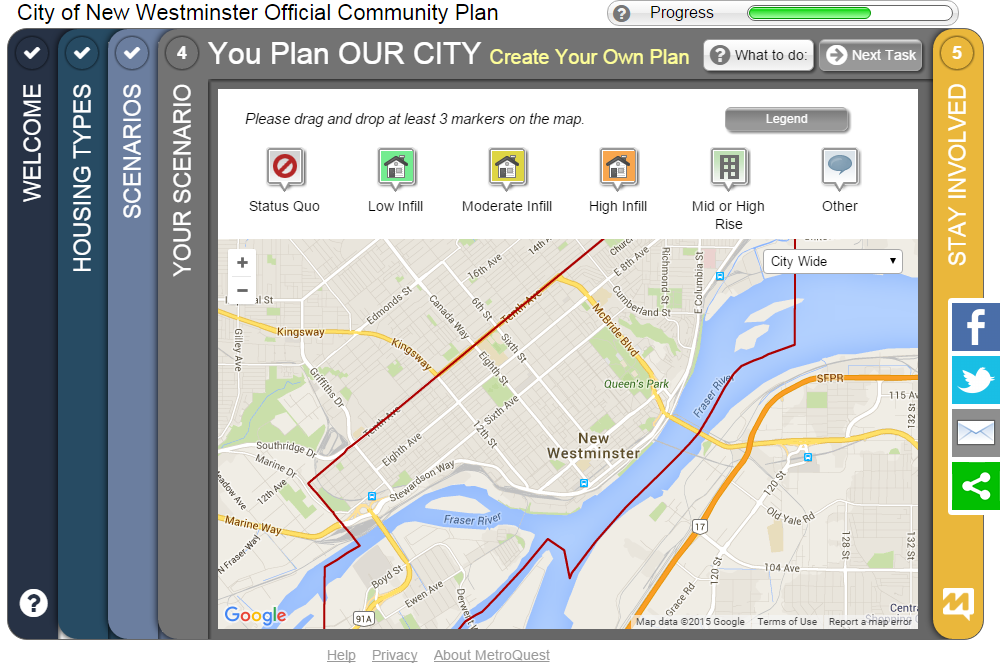 Here, you can provide your own plan for how the City should grow. Starting with a blank map of the City (if you use the little pull-down menu that says “City Wide”, it will zoom to specific neighbourhoods). You can drag-and-drop any of the square tabs from the top row, from “Status Quo” up through density to “High Rise”, and drop in on a block in your map. Kind of like SimCity but less immediate feedback. You can also add comments on any block if you wish:
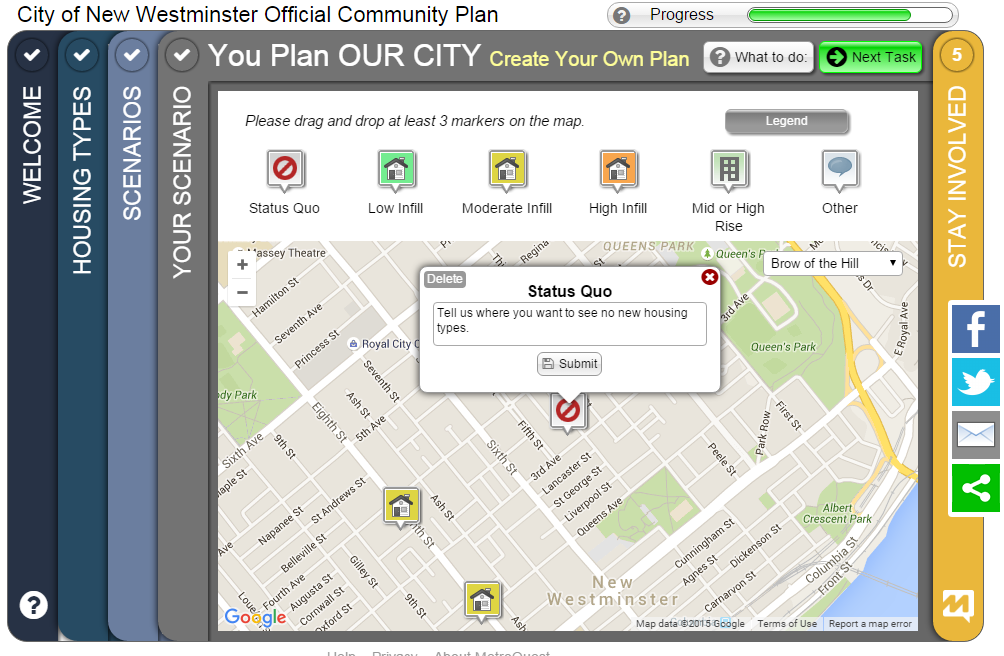
You can be creative about what you think the shape of New Westminster should be, recognizing that you are not looking at tomorrow, but 20-30 years in the future. Once you have dropped a few pieces, you earn your checkmark and move on: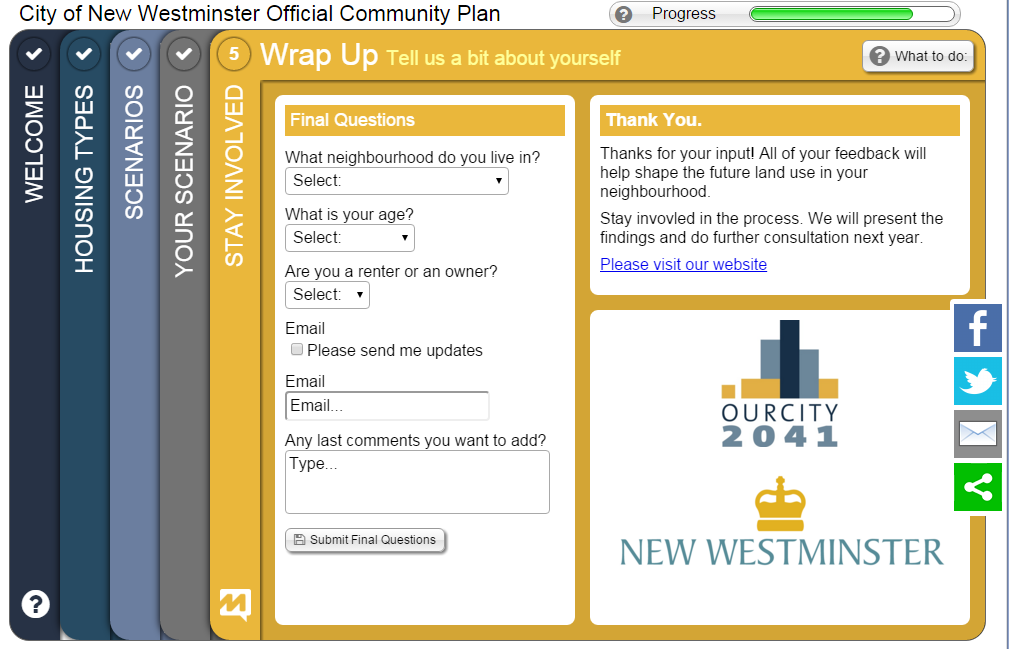
Here, the survey collects a bit of demographic data. It is simple, and anonymous, but helps with understanding what groups are being reached with this tool, and which ones are not. You can provide an e-mail to receive updates (if you want), and add any extra comments. And you are done.
So this Christmas time, you are sitting around with the family, tryped out on tryptophan, presents are unwrapped, log in the fireplace, and it is a few days before the New Years College Football black hole opens up and consumes you whole, spend a half hour playing working on the computer and providing the City the data it needs to make the OCP vision fit your vision.
Merry Christmas! See you in 2016.