My main argument last post was that New Westminster’s property taxes, on a per capita basis, are not out of line with the rest of the region, and are actually significantly enough below the average that the difference works out to a pretty nice chunk of money.
However, it was noted to me that we don’t actually pay property taxes on a per-capita basis, we pay per household. So I took the same sets of statistics from the BC Government site to see how much each City was collecting in taxes from Residential properties only (not business or industry), and compared it to the number of Households in each community, which is a statistic collected by Metro Vancouver for their own purposes.
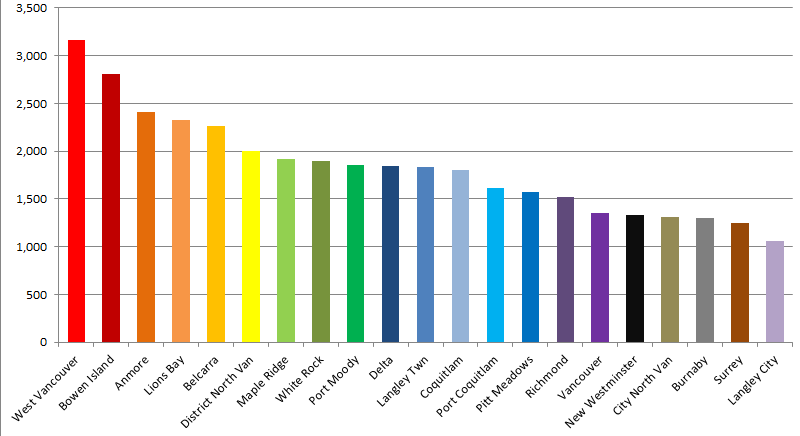
As you can see in this colourful chart, New Westminster slips down into one of the lowest-taxed communities in the Lower Mainland in this comparison. We have a relatively low number of residents per household (2.28, compared to a regional average of 2.73) likely because of the larger number of rental suites and apartments in New Westminster than other Municipalities.
Although the presence of taxes irritates some people, the issue really arises whenever taxes are raised, so how do we measure up in the constantly-increasing-taxes department? Every year Council discusses a potential tax increase to keep up with inflation, growth, wage increases and paying for new programs. Again, the Province’s annual reporting is a useful dataset for comparing these increases between Municipalities, in this case the table called Schedule 703, which lists the annual “Total Property Taxes and Charges” for all Municipalities. I calculated the % increase every year for all 21 Municipalities, and to facilitate comparison between Belcarra’s $2M budget and Vancouver’s $1.4B budget, I indexed all of the taxes to the 2005 baseline, which I arbitrarily set at $100.
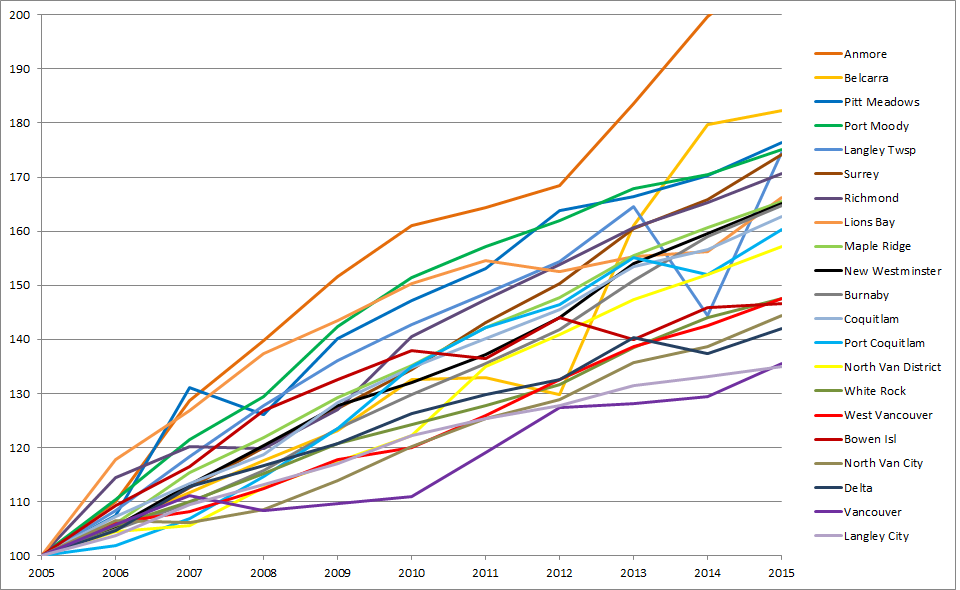
As you can see, between 2005 and 2015, New Westminster’s taxes went up about 65%, which puts us right about the middle of the pack regionally. Anmore was off the scale in their increases, and Vancouver was (perhaps surprisingly to some) one of the most conservative in their tax hikes. To answer your question, I have no idea why Langley Township has that big jog in 2014, except to say that’s what the stats report, and it was an election year in Jordan Bateman’s riding!
These numbers, however, mask that over those 10 years, there was a lot of regional population growth, so as taxes went up, so did the number of taxpayers. Your individual tax increase as a resident of one of these Cities is not represented here, so I took data from Schedule 201 to track the rate of population growth with the same set-2005-as-100 indexing, and the same line colours:
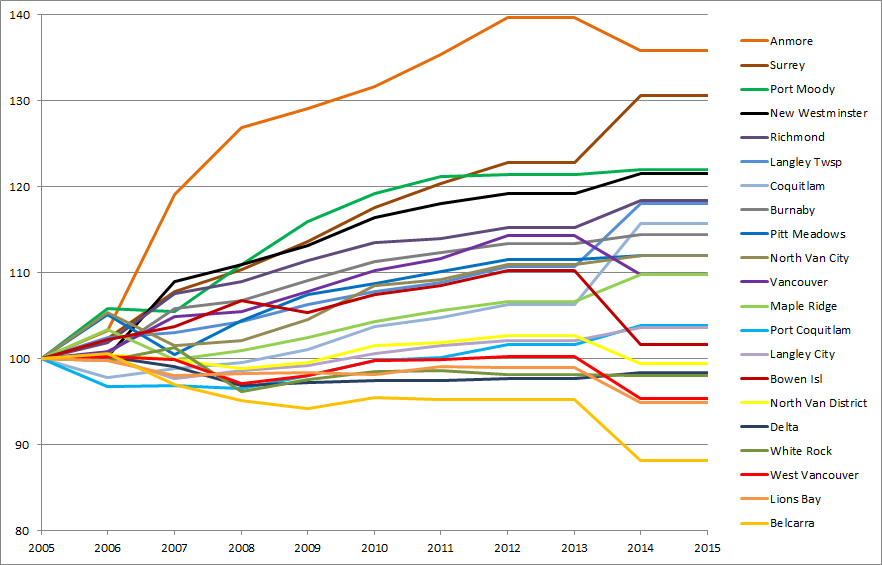
The data here is, unfortunately, a little choppy, as the BC Government does estimates between census years, and the 2014 Census leaves something to be desired. Why they reported no changes in population in 2013 or 2015, you will have to ask them. Perhaps most surprising are the 6 Municipalities that saw their population shrink since 2005 (we need to sit down and talk about the Regional Growth Strategy here, folks). As you can see, New Westminster was one of the fastest-growing communities, behind Surrey and Port Moody, and quite a bit faster than all of the municipalities to the north and west of us, even those with similar dense urban cores and rapid transit access.
So combining those two charts together, I calculated the “Total Property Taxes and Charges” (from Schedule 703) and divided by population (from Schedule 201), then again indexed the resultant taxes per capita to the 2005 rate, which I arbitrarily set at 100:
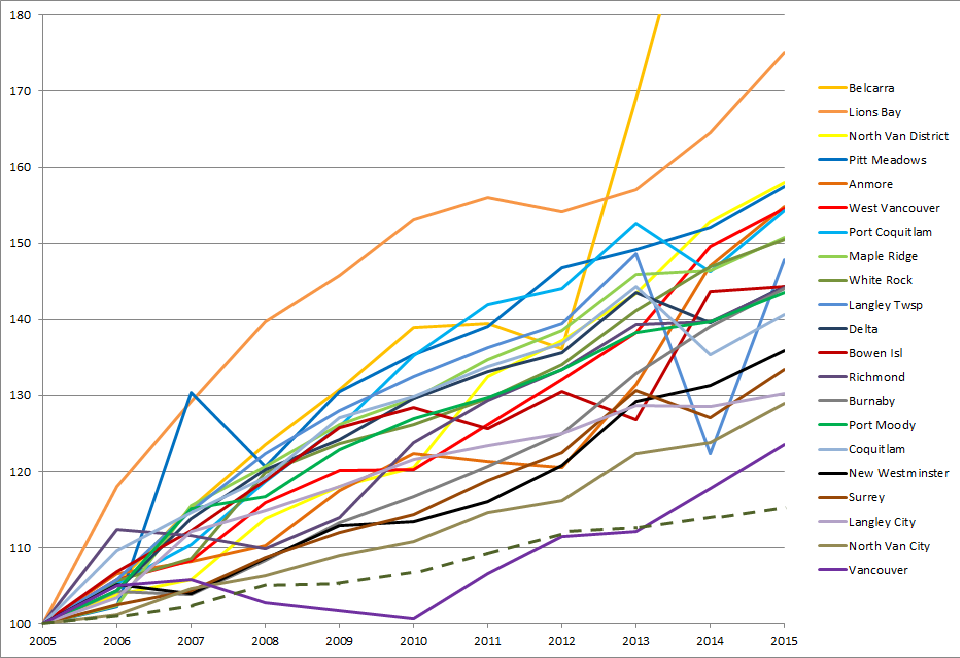
Not surprisingly, taxes didn’t go down per capita in any Municipality over the last decade, but Vancouver’s rapid growth combined with its relatively conservative tax increases make them look pretty good, and they were the only Municipality whose tax increases were (at least until 2014) on pace with the National Inflation Rate, which I added as a dashed line, mostly for Ed’s benefit. Notably, only 4 municipalities (Vancouver, North Vancouver City, Langley City and Surrey) have increased their taxes at a lower rate than New Westminster. It is interesting that these are amongst the most “urbanized” municipalities, and that taxes are increasing fastest in more rural/suburban municipalities, a correlation I have no theories to explain.
As a summary, New Westminster is far from the most-taxed municipality, and are trending towards being one of the lowest-taxed. Based on BC Government data, I am confident that our taxes, no matter how you count them, are comparatively low, and our increases to date are low relative to the other municipalities in the Lower Mainland.
Hi Patrick
Have you included the money we pay for sewer, water and garbage, as that is part of our taxes.
Is it possible to compare the shape of our infrastructure with other municipalities.
That would give us some idea of the value we get for our money.
Thanks for doing this
Doug Joel
Yes, I’ve dug through Utility charges before. It is a bit more complicated because of the different ways different cities do this, but here are two relevant posts with many caveats about data sources:
a recent update: https://www.patrickjohnstone.ca/2016/03/utilities-2016.html
a post from long beforE I was elected: https://www.patrickjohnstone.ca/2013/01/what-about-utilities.html