Last week there were a few stories in the regional media (traditional and social) about CMHC’s recent release of housing data. One story that got my attention was this graph posted on Twitter by census data guru Jens von Bergmann (@vb_jens):
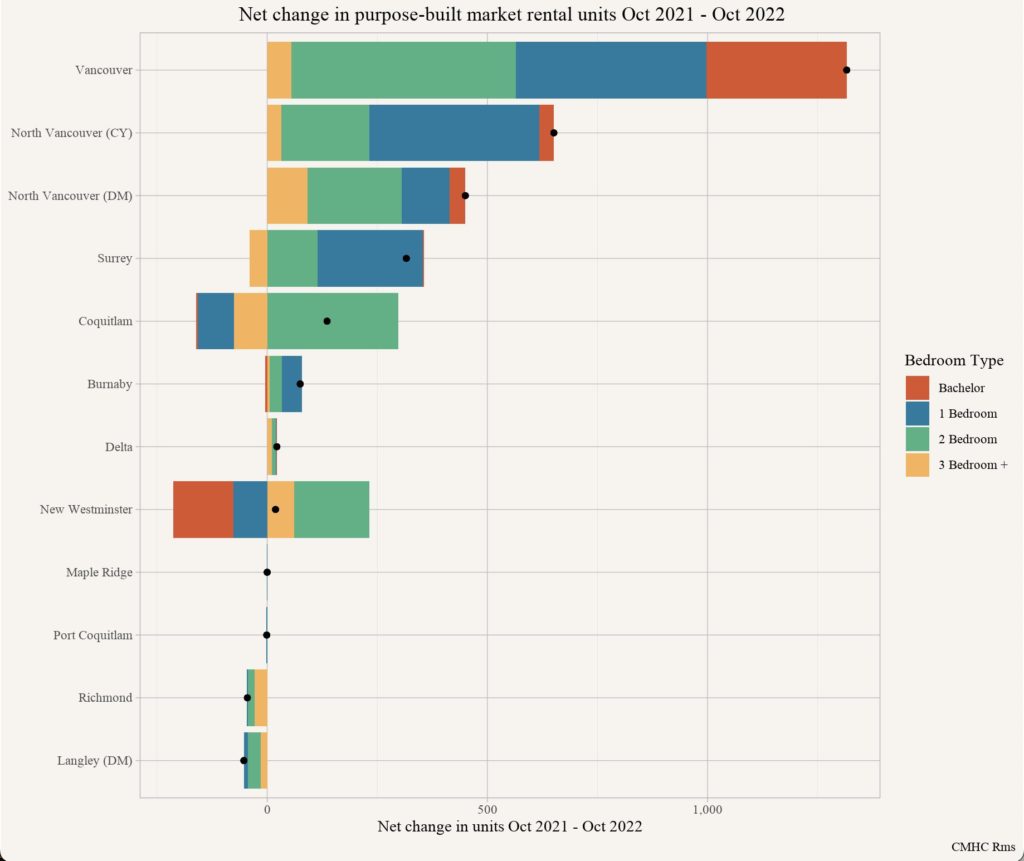
This appeared to show New West losing a large number of bachelor and one bedroom rental suites over the 2021-2022 survey period, while 2- and 3-bedroom numbers went up, resulting in a small net increase of units. A few people asked “what’s up with New West?”, and I honestly had no idea.
Not to bury the lede: there is no way New Westminster lost hundreds of rental units over this period of time. For this to happen, there would have to be either some massive conversion of rental units to condo (not something we permit in New Westminster) or major demo- or reno-victions (both of which are tightly regulated here, and we simply have not had any such applications).
So I had to look into this, and City staff looked into it as well, and conformed what I suspected. It seems like this was a data anomaly, thought it was not immediately clear what the source of the anomaly is. This did give an excuse to dig a bit into the data, which is available here.
I took the numbers for rental units for not just 2021 and 2022, but for the last 8 years, essentially since I was first elected to Council. Here are the raw numbers, and I highlighted the numbers that show a decrease in the last year that is reflected in the original post: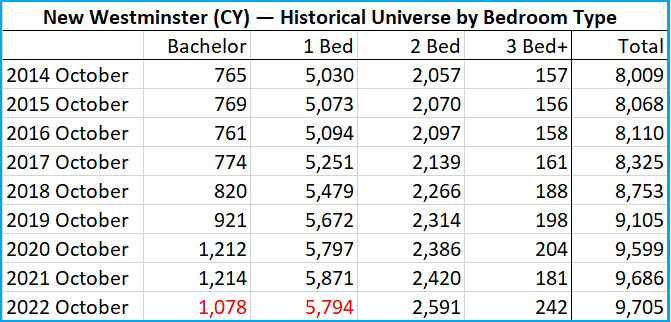
It appears that a couple of larger Purpose Built Rental buildings were misclassified in their unit counts when they were opened in 2019 and 2020, showing the significant jump in Bachelor and 1-bedrooms over those two years, and for some unknown reason, the more accurate data is being presented now. It’s a bit complicated how we can tell this, but the short version is that CMHC also provides unit counts by census tract and by construction period (e.g. “built in 2000 or later”). This allows us to look at how a couple of larger and recently completed PBR buildings were reported in the year they opened, and in there found an anomaly. It appears both 900 Carnarvon (Completed in 2020, 172 studio, 72 1-bed, 132 2-bed, and 22 3+bed) and 228 Nelson’s Crescent (Completed 2019, 0 studio, 85 1-bed, 77 2-bed and 24 3+bed) appear to not have been entered properly, as the number of new 2- and 3-bedroom suites added do not even add up to those provided by these two buildings (and they were not the only buildings to come on line during that period). This also explains some anomalous numbers reported last year about how New West was building way more bachelor and 1-bedroom rental units than our Family Friendly Housing Policy would allow – it is the same data error, now corrected.
As these numbers appear to have now been adjusted, it does show that looking at one year of unit completions from CMHC data may not be the best way to compare communities or track construction/approval trends, especially for smaller cities where one or two units opening (or being mis-reported) can skew annual numbers, and hide the deeper trend. To broaden the data a bit, I looked at the last 8 years (2014- 2022), non-coincidentally the time I have been on Council. I tried to re-create Jens’ chart with the unit count change over that 8 years, divided by 8 to give us an average annual unit change over that time:
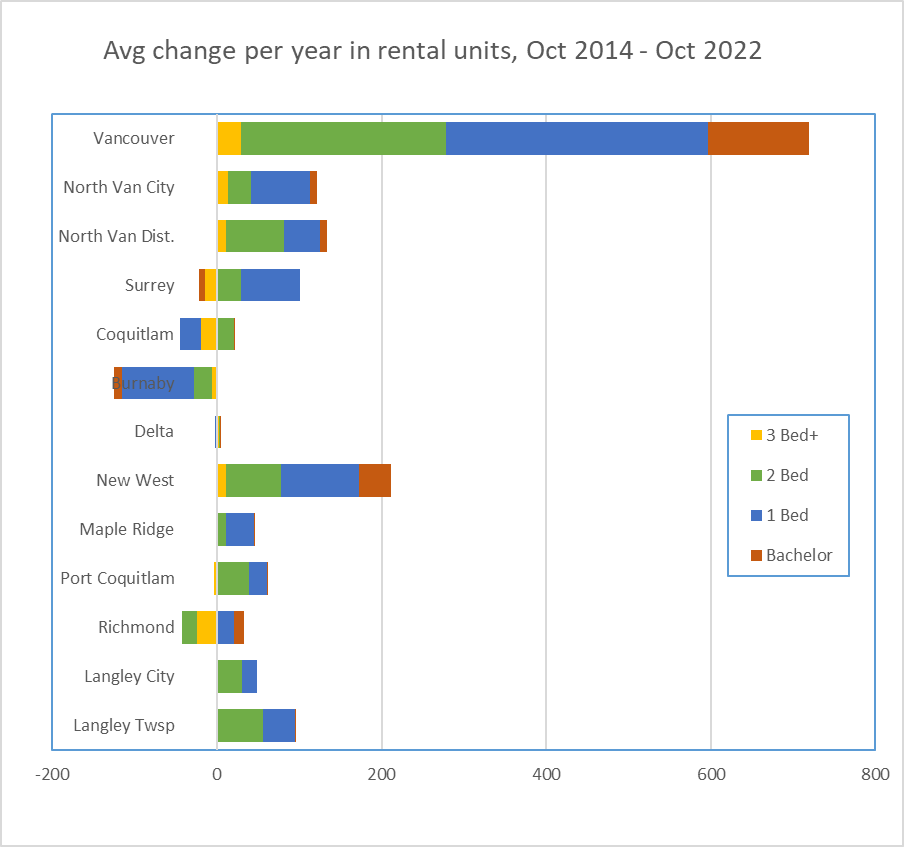
And you can see why I have been saying no-one (except Vancouver) is building more PRB than New West. Of course not all of these communities are equal in size, or in population growth (see more on that here), and these net count numbers are not adjusted for those pressures.
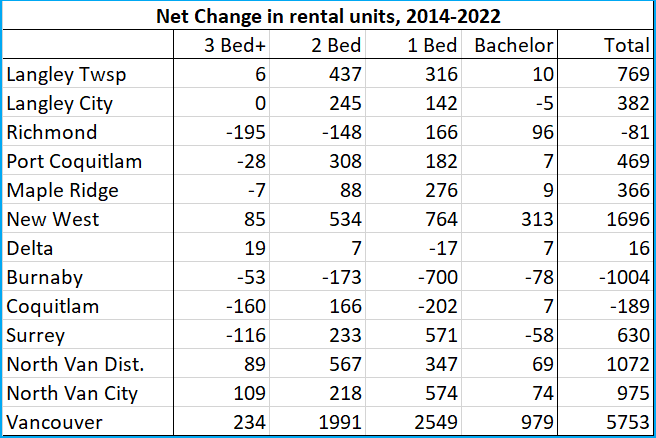
If you want to look deeper at the numbers, they are here , and you can select by City. The numbers I have used are under the “Rental Universe” tab on the left. And just for fun, and if you want to check my math, here are the total numbers I found for over the 8 years (not the per year average presented above):
In summary, one part of the housing crises that New Westminster has been very effective at addressing is the paucity of Purpose Built Rental. There were a couple of decades there from the hollowing out of Federal Housing programs to the early 2000’s where almost no new PBR was being built, and indeed it was being lost. By policy and intention, New West has turned that tide and brought more rental to the market, while preserving the older more affordable rental, with visible results: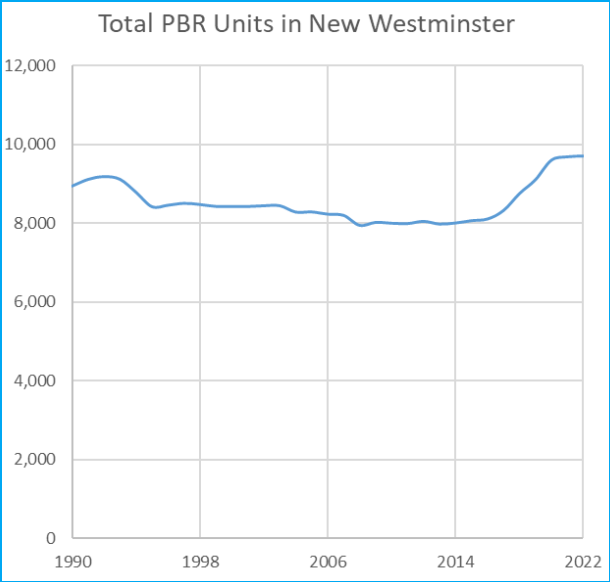
None of this changes that rents are going up at what looks like an unsustainable rate, and a rate disconnected from regional wages. Rental availability is fundamentally regional issue, not one New Westminster (with 3% of the regional population and 8% of the regional rental supply) can solve alone. Everyone needs to build more PBR, there is no new news there.