I could have sworn I already wrote this post, but looking through the archives, I apparently never did! It is the long-awaited follow up to this post, where I reported on the results of the 2017 TransLink Trip Diary and what is says about how New Westies get around.
The Trip Diary (2023 results here) is the most comprehensive survey of regional transportation use in the TransLink area. Unlike the census data that only asks folks their most common way of getting to work (or school), the Trip Diary counts all trips over a week, and asks that people report on all modes used, not just their most common mode, and also collects more data about trip distance, municipal-level data, and more.
That last post I did in 2019 (there were actually two, here and here), reported that between the 2011 and 2017 Trip Diaries, New Westminster had grown 8.9% in population, the number of trips taken by New West residents during the survey went up a little more than this, but the number of car trips actually went down. All new trips generated were by transit, walking or cycle. In the second post, I dug a bit deeper to show that the change in the number of car trips does not correlate with population change. Turns out there are many factors driving traffic and traffic congestion other than the simplistic rubric that population=traffic.
The data form the 2023 Trip Diary has been out for a while now, so I can update those tables to see how things have progressed, and there is both good and bad news for sustainable transportation. Here’s the chart:
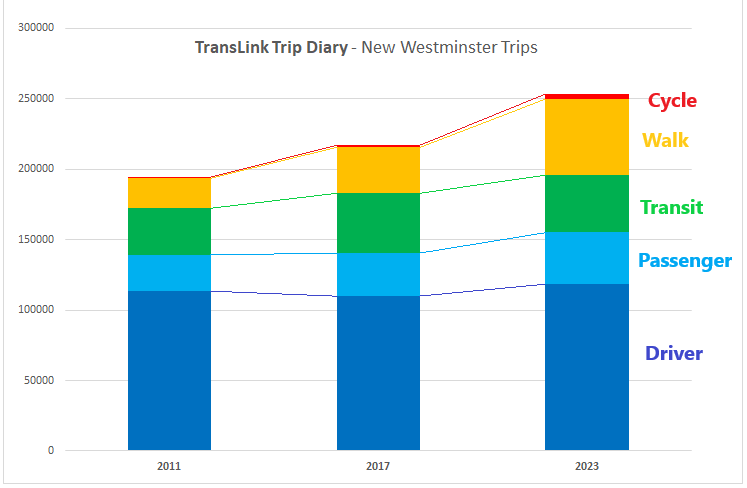
Though population continues to increase in New Westminster (30% between 2011 and 2023), and the number of trips over the same period increased by about the same amount, the headline is that the number of trips as a driver has only gone up 4%, and the driver mode is now less than 50% of all trips. We can now confidently say most New Westies don’t drive for most of their trips. But there is a lot of detail hidden in this chart.
The number driver trips did increase slightly from 2017 to 2023, which offset the decrease over the previous 6 years, while passenger trips have gone up steadily. This may have something to do with the rise of ride share services (which would translate to more cars on the road and worsening traffic), but may also represent an increase in carpooling (which would not result in more cars on the road).
The number of trips by Transit has gone up 19% over the same 12 years, even as it has gone down slightly over the second half of that period. No doubt the impact of COVID is showing up here, and though post-COVID ridership recovery was well on it way in 2023, it wasn’t until 2025 that ridership across most of the region returned to pre-COVID levels. Unchanged from 2017 is the headline fact that New Westminster has the highest Transit ridership of any City in the Lower Mainland (see below).
Where we see the biggest shifts are in Active Transportation – walking trips up 153% over the 12 years and cycling trips up 338%. Overall active modes doubled over the 12 years and were clearly the biggest growth area. New West has always been a walkable city, and is slowly becoming a cycling one (and yes, E-bikes are a big part of this, because hills). Here are the major modes compared across the region:
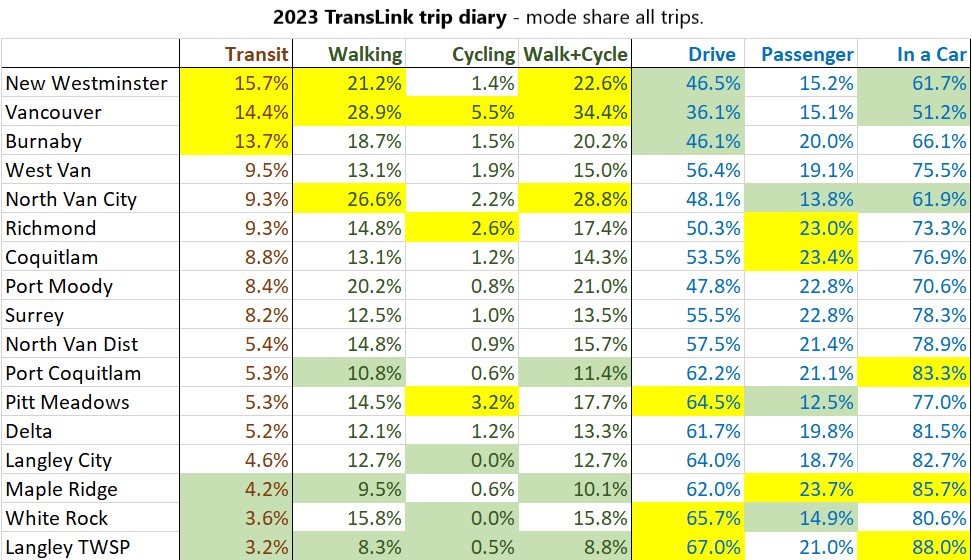
New Westminster, when compared to the region, has the highest transit ridership, is third highest (after only Vancouver and North Van City) in walking, is seventh out of 17 for cycling, has the third lowest (after Vancouver and Burnaby) number of drivers and the second lowest (after Vanouver) number of people in cars. As one would expect from a compact, dense, livable community with exceptional transit service.