It is 2022, which means 2021 Census data is trickling out. If you are interested in this kind of data, you should probably be over at censusmapper or Mountain Doodles where Jens does cool things with maps and data visualization to make census numbers fun. But before you go, I want to talk a bit more about what the census can tell us about the regional housing situation.
I have written a few blog posts in the past that compare census data to the regional growth trends projects in the Regional Growth Strategy – the master document of regional planning for Metro Vancouver, and the one that all municipal Official Community Plans must align with. In those posts I compared the decade of population growth that the regional government planning folks predicted back in 2011 to the actual population growth shown in the census. Turns out (surprise!) growth is not evenly distributed around the region, and though the overall growth of the region is close to the projection (when you account for census undercount, which is an interesting phenomenon), but there are great regional variations between those communities that met or exceeded their regional growth projections and those that fell far short.
However, the population count is not something cities directly control (despite some fanciful promises candidates may offer). The region grows for many overlapping demographic, economic and socio-political reasons, and cities can either accommodate that growth (by supplying homes, employment spaces, utilities, infrastructure) or choose not to (and face housing price inflation, labour shortages, and failing services). The Regional Growth Strategy also includes projected dwelling counts for every community, and Cities though their policies and practices, have much closer control of this. It also happens that dwelling count is a major factor in housing affordability – the idea that increasing supply puts downward pressure on price is not controversial outside of some Landscape Architecture schools.
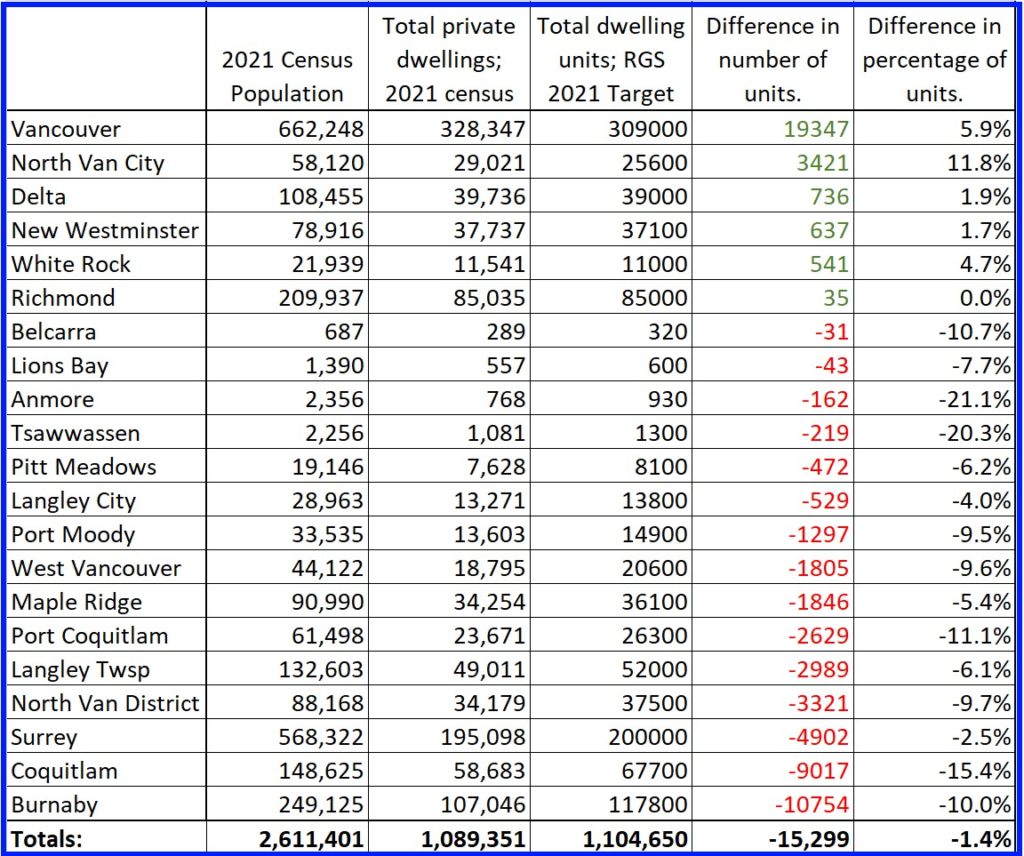
The 2021 dwelling count data was recently released by Statistics Canada, and we can now compare the decade-old RGS projected numbers for 2021 to the census numbers for 2021. I’ll start with a table, because I am not the data visualization genius Jens is:
I don’t think anyone would be surprised to see only 5 of 21 municipalities built more housing units than the RGS projected, though some may be surprised to see Vancouver exceed its targets by almost 20,000 units. As is probably expected, North Van City exceeded growth projections by the highest amount proportional to its population, and Delta, New West and White Rock round out the Municipalities that built more housing units that projected (and Richmond was within statistical error of it target). However, during a decade of overlapping housing crises, while everyone agrees the affordability of housing is the primary local government issue, every other Municipality in the Metro Vancouver fell short of the very commitment they made to the region to get new housing built.

Of course, not all munis are equal in size, nor are all munis equal in their ability to accommodate growth. A significant part of the Regional Growth Strategy is to emphasize new growth near transit and established transportation networks, to increase residential density near work / study / shopping areas to reduce transportation burdens, and to prevent the erosion of the ALR and and the Urban Containment Boundary. This is why the RGS set different targets for different municipalities, and came up with 2021 targets that every muni could agree to when they signed off on the document.
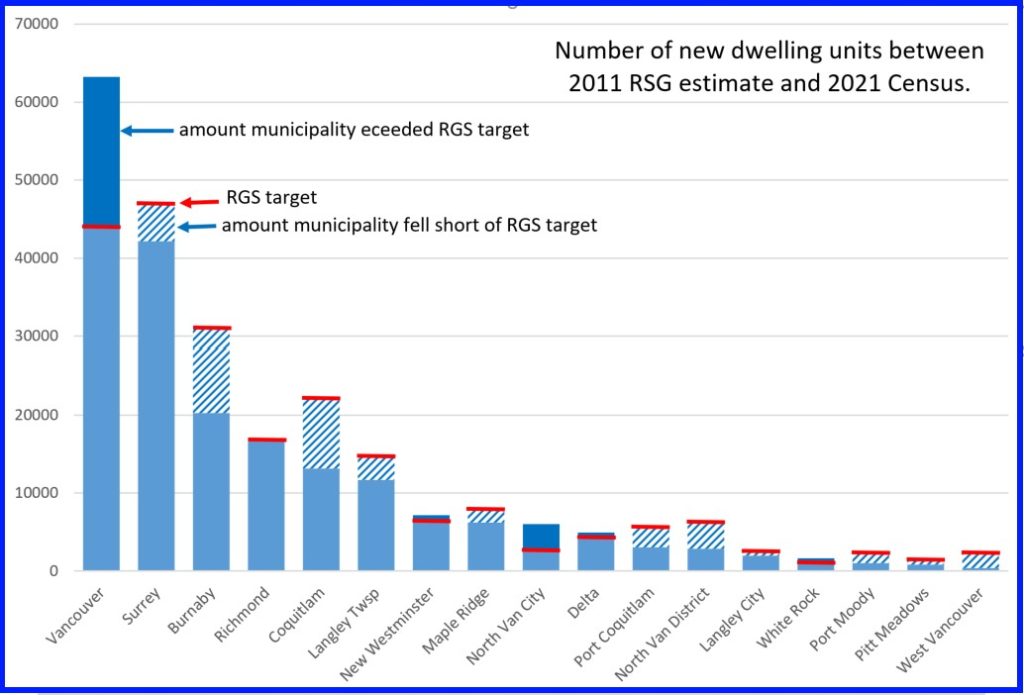
So I compared the projected increase in dwelling units from 2011 to 2021 to the amount that each municipality exceeded or fell short of the 2021 target based on 2021 census data, and you can see how the growth was not only shared unequally, but how different municipalities had different commitments to the agreed-upon plan. It is here that the two recalcitrant North Shore districts and the Tri-Cities really stand out.

Note this is not total dwelling units, just the increase between 2011 and 2021. It also shows that the apparently-rapid growth of new towers in Burnaby and Coquitlam are not enough to keep up with the demand that was projected in the region a decade ago. And that Sea Bus apparently is the great catalyst to urban growth?
The RGS is being updated right now, the decade-old document projecting to 2040 is being replaced with one projecting to 2050. All of the Municipalities are expected to sign off on it, though there are some rumblings Surrey is going to push back because they felt the other cities were not sufficiently diffident in granting them a major re-draw of the Urban Containment Boundary so they can replace forest with warehouses. One of the concerns raised by New Westminster through that process was that municipal projections/targets are being replaced with sub-regional ones that clump municipalities together, further reducing the accountability local governments have in addressing our serious housing crisis. And with strong anti-growth voices rising regionally during this local government election period, I am less confident that the order of government most able to bring in new supply is going to get the work done.
Hey Mr. Eby; we should talk.
Thanks Patrick.
A friendly qualification, if I may: I think that the certain professor in the Landscape Architecture department you’re referring to above wouldn’t deny that, ceteris paribus, adding supply puts downward pressure on prices. The problem is the ceteris paribus clause: all things being equal, additional supply should move the market closer to a more affordable equilibrium point; but all things are not equal, Condon would argue, as land speculation related to market-oriented densification drives up the cost per buildable square foot such that market-oriented densification does not put downward pressure on prices when land is treated as a speculative commodity.
Anyhow, I’m sure you’re quite familiar with the details of Condon’s main argument here. I don’t necessarily agree with everything that Condon has to say about this issue, but it at least seems conceptually possible to imagine an increase in supply in something that is being treated as a speculative commodity in different ways as not necessarily putting downward pressure on prices. In my mind, it should be treated as more of an empirical question rather than one that can be decided from the armchair either for or against. But I have yet to see convincing empirical evidence that adding housing supply through market-oriented development brings prices down to some kind of more genuinely affordable equilibrium point between supply and demand (though I’m always open to reading and considering new things).
Something that puzzles me is why we often talk about housing supply as though it is homogenous in nature in some of these discussions (such as various popular reports and articles on supply gaps). I think that supply is heterogenous, not just in the obvious sense of different types of dwelling structures, but in the further sense of placing differential rates of downward pressure on prices within the broader housing system based on its property tenure structure. A multi-unit building with rent geared to income or affordable home-ownership opportunities in a community land trust model is a type of supply that will place much more downward pressure on prices within the overall system compared to, say, a market-rate condo tower built on land that was purchased after a significant speculative price increase coupled with pre-sale flipping and speculative investment. In fact, it seems plausible to me imagine a situation in which the latter placed almost no downward pressure on prices (and perhaps even an upward pressure if lower-income units were demolished to make way for this building amidst broader gentrifying dynamics). The multi-unit community land trust building, by contrast, places downward pressure both directly through the units themselves being affordable and indirectly through reducing demand on other units in the region. More broadly, I don’t know why we don’t talk more about the differential effects of different tenure types on overall housing prices.
The long and the short of it is that I wish we talked more about the heterogenous nature of our housing supply because, once we do so, we move beyond the mere question of how much supply should be built to the further (and perhaps more important) question of by whom and for whom housing supply is built. The more that I think about it, the more that I become convinced that for our housing supply to be more genuinely socially-beneficial (in terms of affordability and other dimensions of adequacy) that much more of it must be produced through more democratic and non-market development processes. In some ways, I feel like the supply gap, whatever it may be, can only be solved through fixing the democracy gap in housing (in terms of giving ordinary people more control over the housing supply as opposed to our supply being structured primarily by concentrations of capital in the market). But I’m constantly trying to learn more things here and grow in my understanding in this area.
Anyhow, I appreciate the blog post here and your blog in general. I hope you don’t mind that I have written a little essay in the comment here!