I don’t usually dip into media criticism here – there is an old saying about politicians not pissing off people who buy ink by the barrel – but every once in a while an article comes out that needs a response.
In this case, a predictable Douglas Todd article mentions New West. For those who don’t know him, Todd is Post Media’s go-to guy for anti-immigration and anti-urbanism opinion. As in this article, he often taps Patrick Condon, a UBC Landscape Architect who feigns “housing expert” status by pining for Vancouver’s pastoral past.
The reason I highlight this story is that I wanted to test the central premise – that increased growth and increased density means increased taxes. Todd is an opinion writer, not a journalist, because a journalist would do a bit of research to test their idea against data, while an opinion writer is comfortable relying on anecdotes that fit the narrative he is trying to craft.
I’m not a journalist, but I do love data. So I dug through news articles and budget documents from 20 Lower Mainland municipalities (all but Anmore – because their data was hard to find, and after a bit of digging, I decided meh Anmore) to determine what their tax rate increases have been over the last three years, since the beginning of this council term. I do this all the time anyway because I see it as part of my job. I really should know where we stand in comparison to other cities, even if I am the first to acknowledge, it isn’t a competition. I also took the short term rate of growth data from the Metro Vancouver Population Projections report for 2024. Plot the two against each other, and this is what you get:
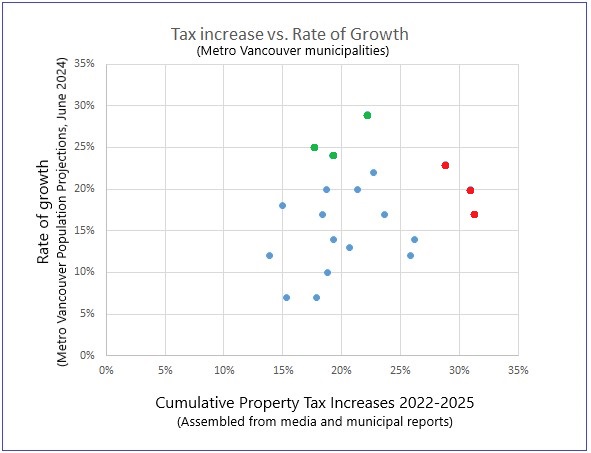
I don’t want to get all Stats 101 on you (the R-squared here is 0.07), but that distribution is pretty close to a circle, meaning there is no correlation between rate of growth and tax increases. The highest tax rate increases over on the right in red (Bowen Island, Langley City and Surrey) are cities pretty close to the middle in growth-wise and the three fastest growing cities up top in green (New West, North Van City, and Langley Township) are mid-to-low in tax rate increase.
Another common Todd/Condon argument is that density of population leads to tax increases. Data on population density is easy to find, so here goes plot number 2:
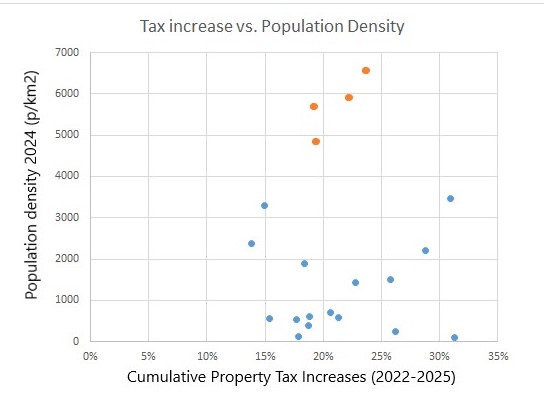
Again, the cluster of four highest-density cities up top (Vancouver, New West, White Rock, and North Van City) are about the middle of the tax increase range, and the tree highest and three lowest tax increase cities are across the spectrum of density, with none of them in the top 4 growth wise. With an R-squared of 0.003, the data here just doesn’t correlate.
The data does not tell the whole story, as it never does in these comparisons, because these are 20 different municipalities with different pressures and priorities. Some cities are intentionally running their reserves down to avoid tax increases, while others are building reserves. Some are making up for previous council underfunding of services, others are paring back on services. Langley City increasing taxes at a high rate doesn’t tell you that they have gone from the lowest-taxed jurisdiction in the region to the third-from lowest, or that West Vancouver at one tenth the density of New Westminster and with the lowest rate of growth in the entire region is still the highest-taxed municipality in Greater Vancouver, despite its relatively modest tax increases in the last few years. There are stories to be told in this data beyond the simple scatter graph; the anecdotes that Todd relies on belie those details.
His narrative is that density and growth are bad, and he will find any ill the public has concerns about, and blame it on density and growth, facts be damned.
The last time Douglas Todd wrote about New West, he lamented there are no cafes on Carnarvon Street, when there are at least 4 places to get coffee in the 500m stretch of Carnarvon he was describing. I just don’t know where Mr. Todd gets his bad information about our City. He sure never calls me.
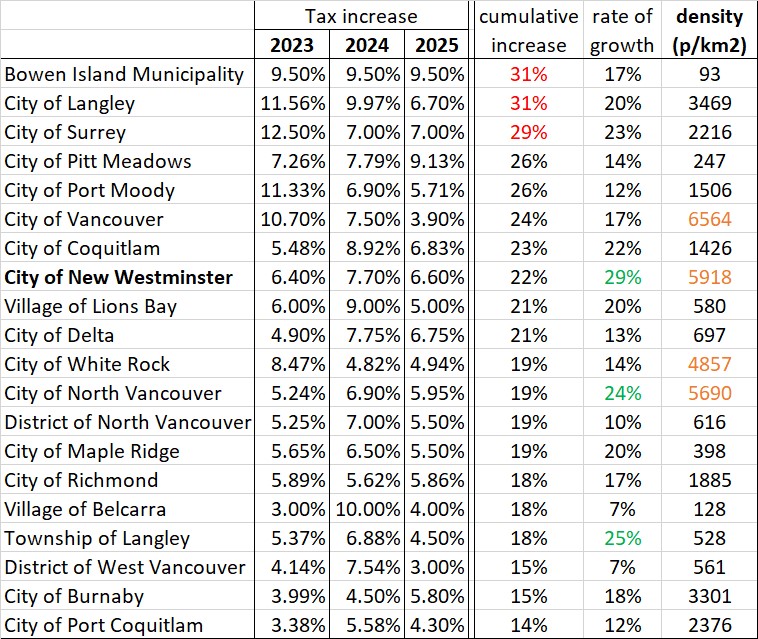
If you want to read more into the data above, here’s my table. If you find a wrong number, or have Anmore tax data and really want me to include it, let me know!