As we are deep in to budget times at the City, I wrote a couple of previous posts comparing the amount of tax collected by New Westminster, and the rate of tax increases in New Westminster relative to the other Cities in the Lower Mainland.
If you are a homeowner in New West, you also paid your annual utility bill recently, and you may have noticed the rates for utilities are going up faster than your taxes. So it is worthwhile comparing between municipalities, as the way they manage their utilities has an impact on the taxes you pay, and the cost of living in your community.
First off, I removed the very rural municipalities from this analysis, mostly because the comparison of apples to apples is difficult. Anmore, for example, has no municipal sewer service, so every resident has their own septic field. Water services on Bowen Island are limited to parts of the community, and the level of service provided to Lions Bay and Belcarra is very different than in major communities.
Even within the “bigger” communities, there is variety. The Township of Langley provides about half of its water through its own groundwater wells, White Rock has its own groundwater supply for 100% of its needs, where pretty much everyone else who charges for water gets it from he GVRD. Large numbers of Langley residents and smaller numbers of Richmond, Pitt Meadows or Maple Ridge residents still use septic fields. Trash collection services vary widely across the region.
I have done my best to compare the cities based on the numbers they made available on their websites (as of March 1, 2016 – yes I wrote this pose a few weeks ago and just haven’t had a chance to put the graphics together). All the numbers shown are the published 2015 rates, except for two Cities that have already published their 2016 rates and purged their 2015 rates from their respective web sites, which I label in the diagrams below. So the numbers you see don’t reflect the numbers on your bill this year because I am comparing 2015 values, because that is the data available.
To start with Water Services, it is important to note that some municipalities meter their water, some charge a flat fee. If there is a flat fee available, I listed that. If only a metered rate is available, I calculated the amount they would pay if the household consumes the Lower Mainland average of 350 cubic metres of water per year.
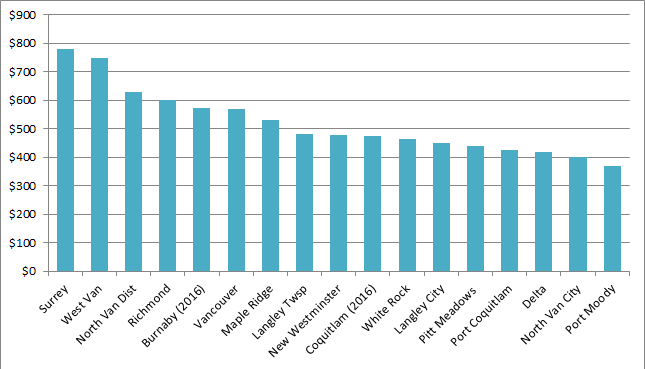
As you can see, New Westminster is about the middle of the pack, and slightly less than the regional average of $519. Surrey is especially high as their flat rate is somewhat punitive to encourage voluntary metering, whereas West Van is fully metered and charges pretty high rates (all of those single family homes on large lots, high slopes, and hard rock result in significant infrastructure cost for their utility).
The sewer utility comparison tells another story. New Westminster is the second most expensive city in Greater Vancouver for sewer rates:
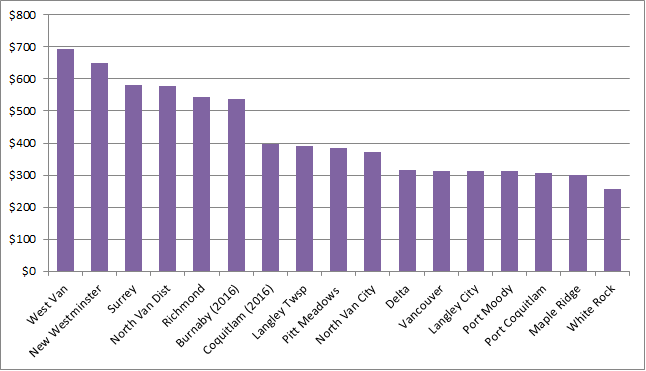
This can be partially blamed on the age of our infrastructure (we need to put more into reserves sooner to plan replacement/upgrade) and a large amount on us still having a large proportion of our sewers not source-separated. We send a lot of storm water to the treatment plant, and that is really, really expensive way to deal with it. The alternate is to accelerate our source separation program, which also happens to be very, very, expensive. There is a whole blog post to be written on this point alone, so I’ll leave it be for now.
Finally, garbage and recycling programs vary probably the most between municipalities. As some Cities have bi-weekly trash collection, and vary greatly in the volume of different waste types they collect, I tried my best to compare to the “baseline” in New Westminster, which is 120L trash and green bins, unlimited recycling bins.
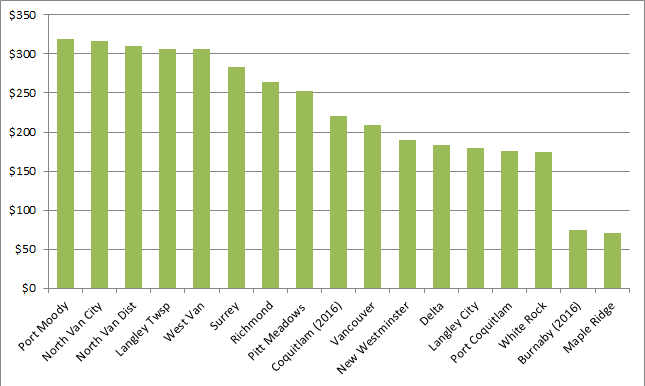
As you can see, New West is slightly below the middle of the pack for solid waste services. This reflects two competing trends. Our city is compact, which should reduce the cost for trash collection, but we have one of the largest percentages of residents not living in the Single Family Detached, where trash is collected commercially and not by the City, which hurts our economy of scale somewhat.
Put these all together, and here is where all Municipalities compare on utility rates:
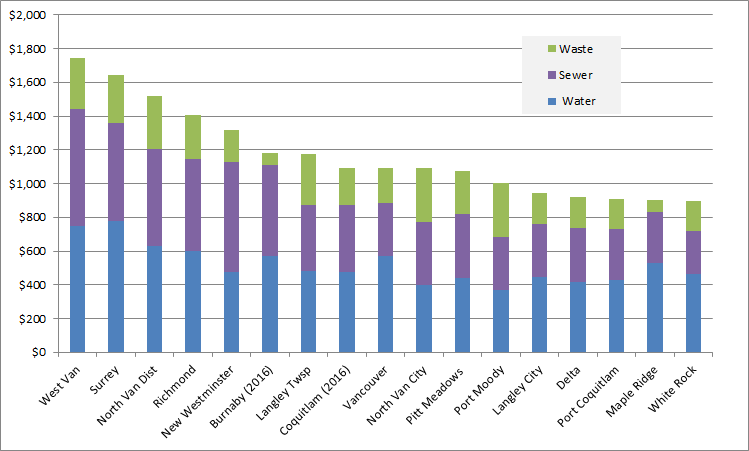
We are the 5th most expensive Municipality out of 17, firmly in the top third, almost completely driven by our higher sewer rates. As there is a complex interplay between tax rates and utility rates, it is interesting to add our average residential tax per household number from this old post to the amount we pay in utilities, to show a closer approximation of real costs between Cities:
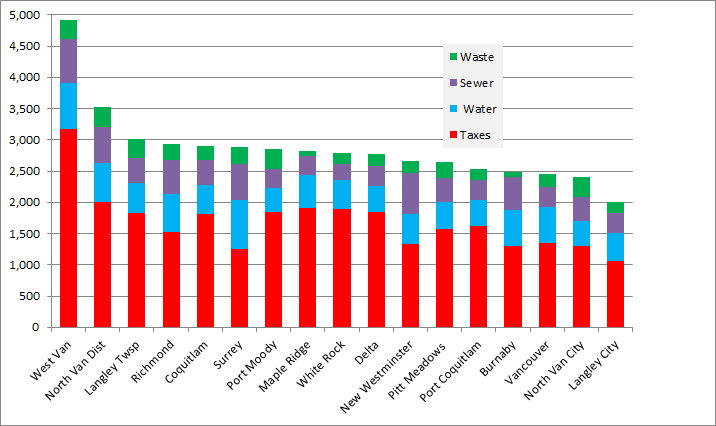
Not surprisingly, West Vancouver with the highest taxes and the highest utility rates, is standing tall compared to all others. It is more interesting to see Surrey with its very low taxes jump up to the middle of the pack because of higher utility rates (driven in this analysis, by the punitive “non-metered” water rates, a Surrey resident can probably save $250 a year by getting a meter, which would put it down around Pitt Meadows overall). New Westminster, as expected, is somewhere down on the low side of average, 11th of 17 municipalities.
So what does this all mean? Not much, especially as this is a bit of a jumble of data – a combination of sources with great citations, but combined in a way that would get me laughed out of accounting school. Overall, though, it does suggest that New Westminster is not running its City anomalously less or more efficiently than any other city in the region. New Westminster does not have the costs or services of West Vancouver, but spends more than Langley City. Outside the few anomalies at the ends of the charts, it is probably not surprising that similar cost drivers overwhelm wildly varying political philosophies, and most Cities in the region have found a way to balance the needs and desires of their residents within very similar funding envelopes.
Great detail, thanks. Does any of this promote the case for regional amalgamation, at least partially?
Pat, a comment on economy of scales of garbage collection: our building is a residential tower with 98 units. As you have pointed out, this type of housing is a large percentage of the city! Before signing a contract with WasteManagement, we reached out to New Westminster’s engineering services. The gentlemen came on-site for a consultation, and practically talked himself out of the job! Essentially, he explained that our city’s engineering/waste collection is set up for single family detached — and they have bins that won’t fit where commercial bins fit, they also don’t like to deviate from the routine of driving through a block and picking up individual bins. At the same time, the city does not even have collection for all types of recyclables (apparently, the city won’t pick up bins of corrugated cardboard from towers).
So it’s a bit of a “catch 22” situation — the city is not interested in serving the high-rises… but also the SFD pricing is high because there are so many high-rises?
Would love to see this comparison for Commercial ratepayers and also need to understand how owners if strata properties are charged for this basket of services. There was acknowledgement that solid waste for strata properties is largely handled by commercial service providers. That option isn’t possible for water and sewer services. Are condos flat rated like SFH’s?