The topic of policing is coming up across the region in various forms, most of them related to elections. Last week, two non-incumbent people running for Mayor in the two largest Metro Vancouver municipalities are promising to increase the number of police officers to address a perception of increased crime. I have also heard some discussion recently about New West not increasing its police force to keep up with population growth. So I thought it would be good to write a blog that looks at the data, as a precursor to what is likely to be a deeper discussion in the community about policing.
When I say “the data”, I mean the information provided by police themselves and reported to the Province of BC. The Province has a page dedicated to collecting and reporting out all kinds of police information from across the province that you can find here. The part I am most interested in is report linked at the bottom of the page entitled “Police resources in British Columbia, 2020“. It is the most recent and comprehensive comparison of police forces across the province, and though I’ll add data caveats below, it seems like as definitive a source as one can find.
In comparing Metro Vancouver policing, there is one thing that needs to be addressed up front: of the 17 municipalities with more than 5,000 residents, 12 are served by municipal RCMP forces, and 5 are served by Municipal Police. When you dig into details, the service model is actually much more complicated than this, as there are Regional Task Forces that are shared between multiple jurisdictions and may include Muni and RCMP staff, and every city receives some services from some task forces while most also lend staff to these task forces. There are also other forces such as Transit Police and Federal RCMP detachments operating in the region. The overlaps are complex, and the report itself has a lot of text explaining these complications. Read that report if you want those kind of details.
A commonly heard point is that Municipal police cost more, but provide better service and better local accountability. This is the concept behind Mayor McCallum’s argument for establishing a Municipal force in Surrey. There are a couple of ways to look at policing cost, but these two make sense: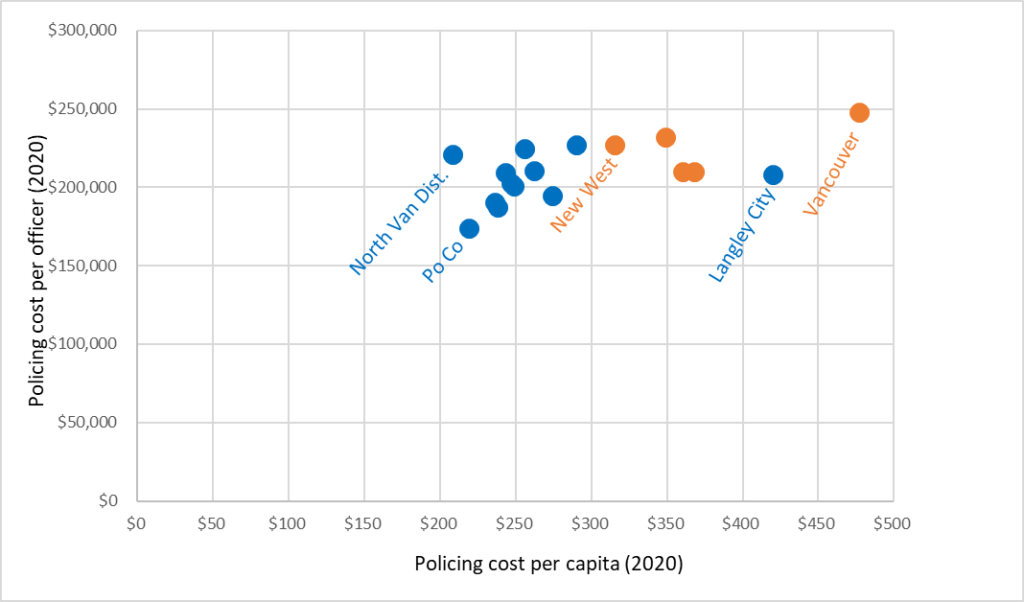
The orange points are Municipal forces, the blue are RCMP. You can see the policing cost per capita does tend support the notion that local cops cost a bit more. You also see there is a wide range of per capita costs regardless of the provider – Vancouver and Langley City residents pay almost twice as much as North Vancouver District residents do for police. You can see New West has the lowest costs of any Municipal force, but is still more costly than most RCMP forces. The cost per officer to run the police force does not vary quite as much, and you can see New West is middling-to-high compared to our cohort, but not completely out of scale with the regional average.
This brings us to the number of officers per capita, or (the easier wat to count it) the number of residents per police officer. I think the most interesting way to look at this number is compared to the Case Load. That stat is the number of criminal offences per officer, which is an imperfect but useful proxy for “how busy is the average cop?”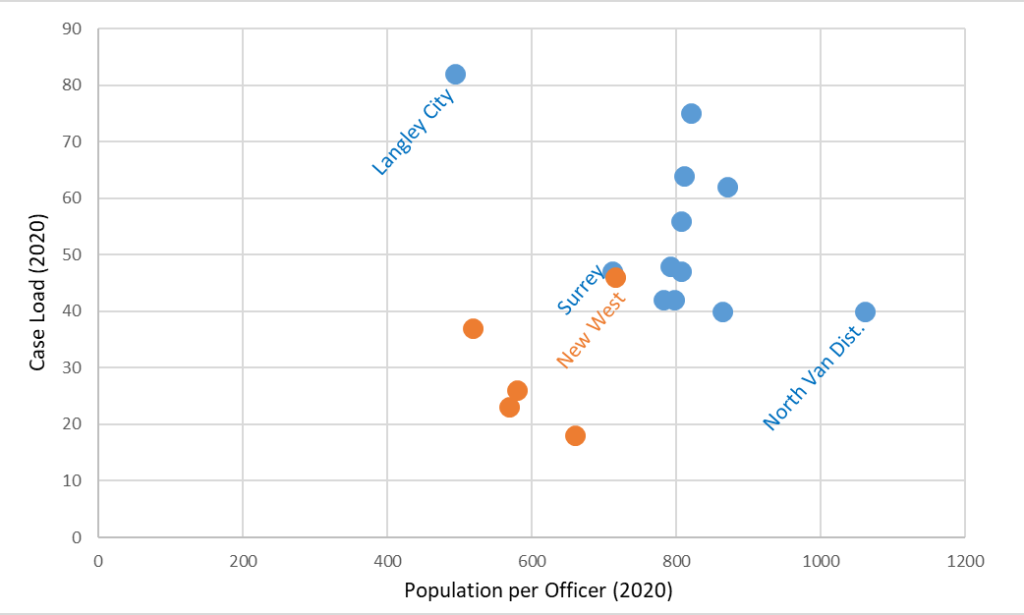
You can see here that New West is about smack dab in the middle of the region in both of these counts. Our numbers are remarkably close to Surrey, which is a very different city with an RCMP force (these stats were collected before the Surrey Municipal police force was set up). You also note that Municipal forces general have fewer people per police (more police per capita) and lower caseloads than RCMP forces, with New West again leaning towards RCMP levels more than fitting in with the Municipal Force cluster.
Of course, this discussion leads to a discussion about growth, and whether the police forces are keeping up with regional population growth. The data here is a again from the BC Government report, including the 2020 population data. I gathered the 2011 population data from another BC Government dataset you can find here if you want check my numbers.
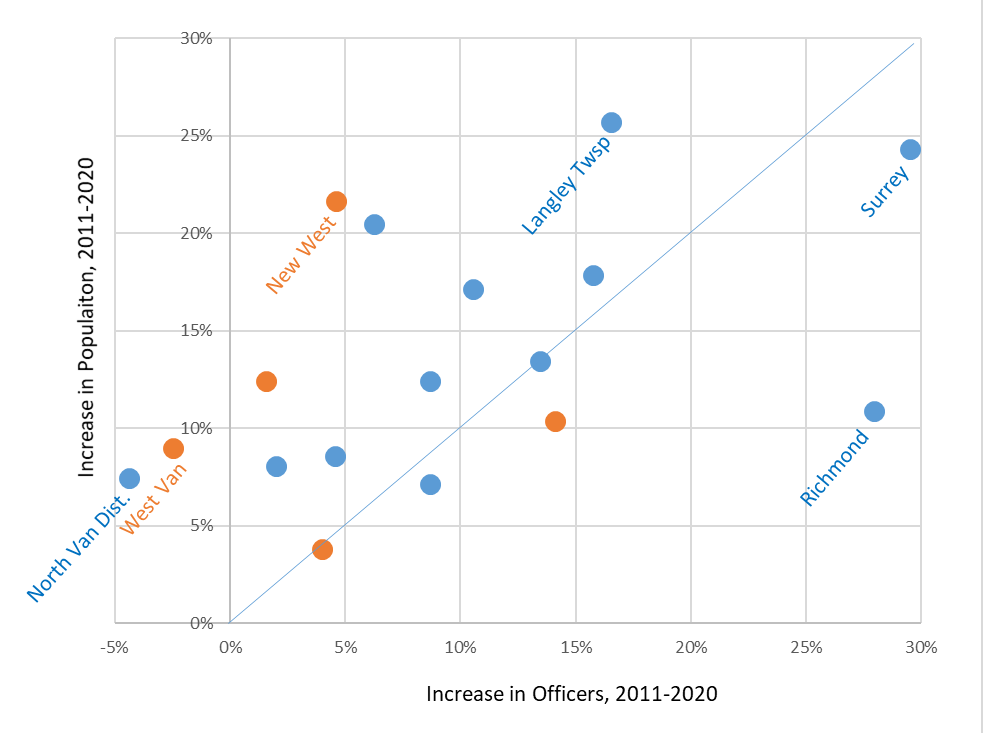
You can see that by percentage of growth over the decade, very few police forces have added members at the rate that population has grown (the dots on or below the blue diagonal lines being the few that did), and two North Shore municipalities have fewer police now than they did in 2011. You will also note that there isn’t a clear divide between RCMP and Muni forces here. It is clear that the increase in Police in New West (going from 108 to 113) has not kept up with the 22% population increase. It is also interesting that Surrey and New West are so far apart in this graph, when they were overlapping in the last – the relationships between officer count, case count, and growth are obviously complex.
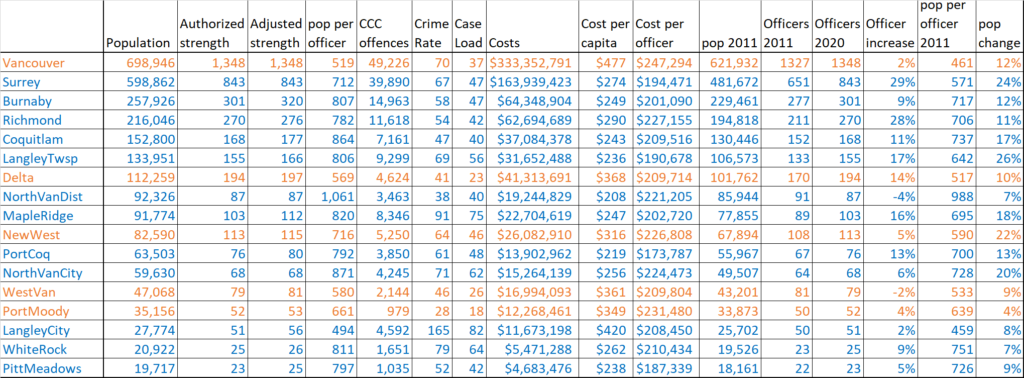
So those are the numbers (table form below for those who wish to nit-pick), and I am sure that this kind of data will lead to principled and well informed discussions in the community. I just want to make the point that is often missed in these discussions: City Councils generally do not determine police officer counts. In RCMP-serviced communities, I have no idea how those decisions are made. For a City with a Municipal force, that is the job of the Police Board working with senior policing staff, backed by provincial service standards and based on the unique needs of the community. If you are interested in leading the discussion on police officer counts in New Westminster, your opportunity is now, as the province is currently receiving applications for Police Board members right here in New Westminster. Apply here, the closing date is September 9th.
Finally, it is important to note some data caveats. These are 2020 numbers, the most recent the province has available. The actual number of sworn officers in your community is likely lower than the numbers here, because these stats are “Authorized Force” and assume that all funded positions in the police force are filled. This is rarely true in the best of times, but in the last few years we have had events that made it less true, such as the regional shifts related to Surrey ramping up its Municipal Force and the COVID-related Great Resignation affecting many sectors of the economy. Also, there was a dip in crime in 2020 related to COVID (this is discussed in the report), and though we might presume this dip was systemic and equal across the region, this data neither confirms nor refutes that.
BONUS CONTENT!
In the comments, a reader suggested comparing Case Loads between 2011 and 2020 would be interesting. The table I downloaded from the province didn’t have case load data from 2011, but you can find CC Case counts in the “Jurisdiction Crime Trends” table on the same page. From that and the Authorized Strength already reported, you can calculate Case Loads from 2011 an 2020. The results are interesting, if a bit unclear. And again, I want to emphasize the 2020 data is likely anomalous due to COVID, so I also did the math comparing 2011 to 2019, which might be the most recent “representative” year. Sorry, the best you get is a table: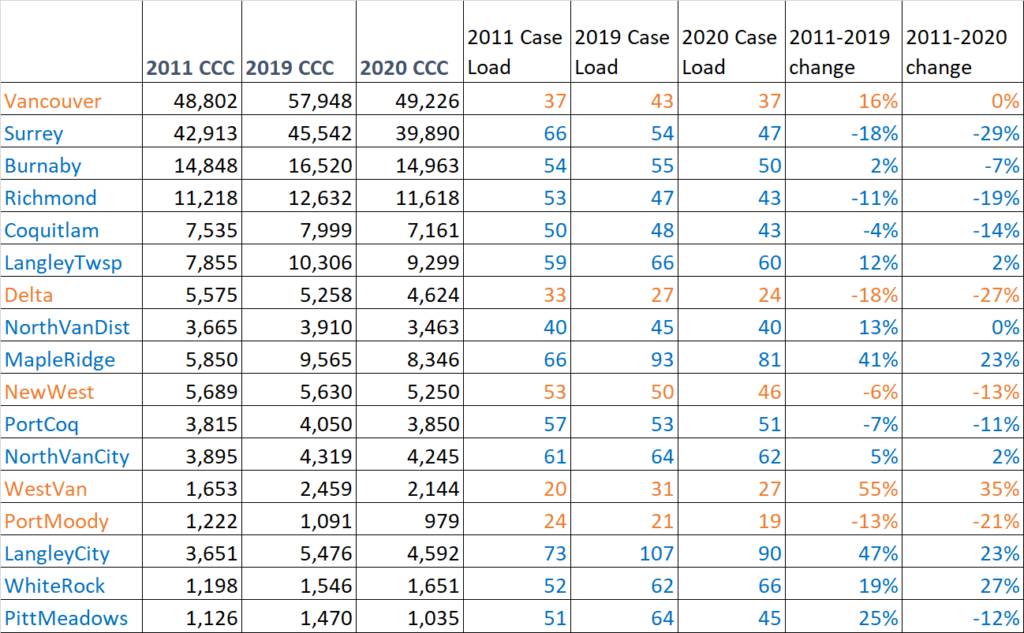
So Case Loads are generally down, but there are some municipalities where they went up, some by quite a bit – West Van and Maple ridge share a strange similarity here. You can also see an almost universal drop in 2020, except in White Rock. My first impression is probably that the majority of cases are likely more complex now than they were a decade ago, but once again, you can read form the numbers what you will! I’m just reporting here.
How much have case loads changed in the same 2011-2020 period? Population Growth in my opinion is irrelevant as you somewhat mentioned. But caseload growth is completely relevant.
Interesting. I took a look at the data available, and you can get the Criminal Code Cases for 2011 and 2020 under the “jurisdiction crime trends” table at the same government website. From that an the Authorized Strength number already reported, you CAN calculate Case Load changes over the decade, and it is surprising. So I’ll add it to the above. Thanks for the idea, Brian.