Council – Aug 29, 2022

Summer is not over. Another week until kids go back to school, and the Autumnal Equinox is still weeks away, but the summer hiatus at City Council and staff is over, and we were back in business with a full Council Agenda. This week’s Council meeting began with a special Presentation:

2022 Planning Institute of BC Excellence in Policy Planning Award: Seven Bold Steps for Climate Action
The City’s Planning department won this award last month at the annual PIBC conference. But this presentation was about thanking the people who helped make it happen. When the Council was elected, and told staff we were serious about Climate Action, that we were ready to be challenged to approve a really bold climate action plan for the City, staff responded with this really great piece of work. We knew at the time (a notion reinforced now by the award) that it was region-leading, as bold as anything happening at the Municipal level in Canada.

When I ran for Council, when the current Council ran in the election in 2018, we all talked about Climate Change, and about the need for us to take action to address our corporate and community emissions to meet the challenge of the Paris Agreement. And we got elected making that promise. But even six months after election, the mandate delivered is questioned, which is why it is important that the community continue to call on the Council to do this work. When the Bold Step plan came to Council, several groups came to support Council, imploring us to say “yes” to bold action. So we wanted to take this chance ot share the Award given to Council with a couple of those community groups who came to Council back in 2019 to push us forward –to tell us this work mattered to the community. Who made it easier for us to say “yes” to climate action.


We then moved the following item On Consent:

Amendments to the 2022 Schedule of Council Meetings
We are making some changes to the Council Schedule in light of the upcoming UBCM conference, the election, and the anticipated need for a Finance Workshop in November to get the new Council up to speed. That means this is the semi-penultimate Council meeting of the term.

Appointment of City Officers:
There is a bit of staffing change going on in the City, like every organization on earth right now. Several positions in the City have very specific legislated duties, job positions that come with specific responsibility and delegated duties under the legislation that empowers the Municipality to be a Municipality. These are two positions where Council must approve the appointments so the staff can act under those responsibilities.

Budget 2023: Fees and Rates Review:
The budget process at the City is a long one. In order for staff to project forward to next year’s budget, they need to know the fees and rates that make up about 1/3 of our revenue. So an early step in every budget year is updating the applicable Bylaw to codify and change in fees or rates for everything from swim lessons to parking passes to building inspections.

Every department reviews their rates annually, and try to balance three things: Inflationary increases so rate increases are gradual and we don’t get behind on CPI; Reviewing the cost of delivering the service so (ideally – not always) fees cover those costs; and a comparison to fees charged in adjacent communities to make sure the City is not out of touch with what is charged elsewhere. This year staff are recommending most rates and fees go up about 2.4%, to reflect CPI, though some fees are not going up (QtoQ Ferry, Inter Municipal Business Licences, EV charging costs) and some are going up more than 2.4% based on previous policy decisions (e.g. Parking fees are mostly going up to align with the 5-year plan for Parking rates approved by Council after much discussion back in October of 2018). You can read the reports for all the juicy details!

Construction Noise Bylaw Exemption Request – New Westminster Interceptor – Columbia Sewer Rehabilitation
That sewer work on Columbia Street is not over. They got out of the way to give our downtown retailers a break during the all-important summer festival season, but the tying in of the sewer lines is still a necessary project for the long-term viability of the sewer system. There will be some disruption between now and December.

Delegation Bylaw Update to facilitate Acting Director Roles
More about some of the re-organization happening with retirements and other staff changes at City Hall, This to update who is delegated to do delegated duties when the delegate is off duty. And we codify it by Bylaw, as required by Legislation. This seems kind of bureaucratic, and it is, but legislative function requires clear responsibility and chains of delegation so everyone is accountable.

Electronic Message Centre for Ryall Park / Queensborough Community Centre
The Queensborough Community Centre used to have a “static” sign on Ewen Ave, and a few members of the Q’boro community have been asking for a digital sign that can highlight events and share other City info. Staff looked into whether a partnership with a third party provider was viable, and it turns out the traffic counts there are just not enough to make this attractive to advertisers. We already have money in the Capital Budget to install a digital reader board sign, so we are moving ahead.

Official Community Plan Amendment and Rezoning Applications for Infill Townhouse: 102/104 Eighth Avenue and 728 First Street – Preliminary Report
This is a preliminary report on a townhouse development in Glenbrook North that would see 10 townhouses where there are currently two houses (one a duplex). This one needs an OCP amendment along with a rezoning, so it is going to consultation, and will end up at a Public Hearing, so I’ll hold my comments until then.

Recruitment 2022: Appointment to the Social and Cultural Vibrancy Grant Committee
We have community members serve on volunteer committees to help us evaluate applications for Grants. We put out a public call for applications due to a vacancy, and Staff have recommended a person for the SCV Grant Committee, who we now official appoint.

Temporary Use Permit: 97 Braid Street (Royal Columbian Hospital Parking) Phase 2 – Consideration of Notice of Issuance
That big parking lot for RCH construction workers by the Braid Skytrain Station operates on a Temporary Use Permit, which is expiring. They need a few more years to complete Phase 2 of the RCH Project, so we are issuing another TUP.

Temporary Use Permit for Group Living Facility: 311 Louellen Street – Consideration of Notice of Issuance
The owner of this large house in the Brow of the Hill would like to operate a residential support facility, which would require a Temporary Use Permit for three years. This is within the OCP use, but would need a TUP to address zoning issues. This report is just notice that Council will consider the TUP in a future meeting. If you have feedback, let us know!


The following items were Removed from Consent for discussion:

Fall 2022 Outdoor Pools Operating Schedule Update
With the closure of the Canada Games Pool and the Edmonds Pool in Burnaby, we are extending out Outdoor pool season well into October. This is an update on the schedule, and a reminder of a few operational constraints. Staff limitations is part of the equation, but there are also operational constraints at Hume (lack of lighting, an older boiler that probably can’t keep the pool warm as the weather changes) that may limit the usefulness of the pool. And, of course, the use will likely be impacted by weather, and we just can’t predict that.

We have also heard a few concerns about the booking system that changed during COVID, with parts of it still being used to manage capacity more fairly as we emerge out of the worst of the pandemic. To be truthful, I have heard very positive reviews and some negative reviews. Staff is going to take some time in the off-season to engage a bit with the user group and do a review of the system and report back to Council with some potential changes or improvements.

Massey Theatre Renovation Update
The City made a significant commitment to the Arts community when it committed to saving the Massey Theatre from demolition along with the old NWSS. The Land Transfer from the School District was a bit of a challenging negotiation (as it was a complex three-way conversation with us, the province, and the School Board about current and future land needs), but we now have the land secured and a long-term partnership with the Massey Theatre Society for operating the space. They have been doing incredible work already in expanding into the programmed space of the “Little Gym” and old music room spaces. This is a partnership that will serve the local arts community for decades.

But now comes the tough part. The Massey is an old building, and as it was not part of the School District’s long-term planning, it was hard for them to justify spending their limited capital finding on upgrades or updates. Now that the City has taken ownership and has been able to do some more comprehensive evaluation of the building, we need to prioritize capital costs to assure the building remains viable, safe, and functional.

The planning now is to look forward to where the building needs to be in 25 years, and what we can do to bring the building up to Building Code compliance, operational efficiency, and modern accessibility standards. The current budget (~$14 Million) is likely not enough to complete this work, and the business case and building evaluation do not support maintaining the “Big Gym” and cafeteria space on the north side of the building, so it will be demolished as was the original plan (though we took a bit of extra time to do detailed studies to assure demolition was the best option).

That said, we also need to be thoughtful in taking a phased approach to renovation and upgrades. Doing it all at once might be cheaper and quicker, but supporting the ongoing operation of the MTS means any closure of the Theatre needs to be short and predictable to allow ongoing and consistent programming. We also need to be mindful of the external presentation of the space (the accessibility, the greenspaces and parking around, etc.) as this work is ongoing. We have great partners in the MTS, and this partnership will help guide us through the next 5 (or more) years while we keep our commitment to preserving the Theatre. But ultimately, these decisions will be made by the next Council, as there are budget implications of all of these decisions. For today, we are just approving the steps to get us to a final project scope decision in January of 2023.

Master Transportation Plan Amendment and Monitoring Report
Our Master Transportation Plan is seven years old. The principles are still strong, but there are a couple of areas where it needs an update. The first part of the report is an update on the 123 policies and actions from the plan (61% ongoing actions that are the new normal, 11% completed actions, 21% underway but not yet complete, 11% either not started or abandoned) and an update on the 12 measurable “Key Performance Indicators” about how the MTP is going (6 are on track, 5 are behind pace, one is waiting for updated data).

New Mobility is a catch-all phrase for new technology like e-bikes, e-scooters, automated vehicles and electric cars. Our 2015 MTP does not speak to these, and we are adopting some updated policies to address them. Some of this is engineering changes to make micromobility safer, part is advocacy to senior governments to address the gaps in current legislation, along few other policy direction like addressing end-of-trip facilities and storage. And, yeah, we are looking for opportunities to bring an electric bike share program to New West.

Curbside Management is another area where we need an update. Changes in how retail and service industries work (exacerbated during COVID), and more demands for accessible curb space and providing space and comfort for vulnerable road users mean the priorities for the curb have changed, we need a set of priorities established to help make decisions around curbspace allocation.

Finally, we are asking staff to bring back a report on potential MTP updates to introduce Vision Zero principles. This will be a decision for the next Council, and I will be talking a lot about this in the future, as I have a lot to say about the need to take a more comprehensive approach to road safety in the City.

We than had a bunch of Bylaw Readings, with the following Bylaws for Adoption,/u>:

Zoning Amendment Bylaws Repeal Bylaw No. 8353, 2022
This Bylaw repeals the two Bylaws that received previous adoption but, due to an administrative error, were given public call for comment prior to the Third Reading instead of prior to the First Reading as is required with the recent changes to the Local Government Act, as has been discussed at some length. Once Repealed, we can adopt them again.

Zoning Amendment (1321 Cariboo Street) Bylaw No. 8345,2022
This Bylaw changes the zoning language to permit the construction of a 15 unit Purpose Built Rental building in the Brow of the Hill, as was discussed in a Public Hearing on June 30, 2002. It was adopted unanimously.

Development Cost Charges Bylaw No. 8327, 2022
This Bylaw updates our DCC rates to catch up to changes in the cost of necessary infrastructure upgrades related to growth in the City, as discussed back in May. It was adopted unanimously by Council.


Finally, we had two Motions from Council:

Advocacy for Inclusion of Sexualized Violence Prevention as part of the Serving It Right program, Councillor Trentadue
That Council request the mayor write to Minister Farnworth and Parliamentary Secretary Lore advocating for the inclusion of ‘sexualized violence prevention training’ within the Serving It Right curriculum to provide foundational education to people with the front-line opportunity to take action to prevent sexualized violence and respond appropriately and with care when incidents occur.

This is in support of good work happening in Victoria to call for more protection of service industry staff.

Low Carbon Energy Systems Councillor Nakagawa

THAT the City of New Westminster recognize both the significant difference in the lifecycle emissions associated with different gaseous fuels including RNG, blue and green hydrogen and biomass, and the limited supply of truly low-carbon RNG; and
THAT the City of New Westminster direct staff to prioritize electrification over gas when proceeding with work on acceleration of the Energy Step Code, and in particular explore ways to exclude RNG from future Low Carbon Energy Systems; and
THAT the City of New Westminster consider electric heat pumps systems the preferred option for space and water heating in buildings and intend to encourage the use of limited RNG resources for their highest and best use and not for residential or commercial heating; and
THAT the City of New Westminster include the above in our Community Energy and Emission Plan (CEEP) and our Corporate Energy and Emissions Reduction Strategy (CEERS); and
THAT the City of New Westminster write a letter to the BC Minister of Environment encouraging that this definition be adopted provincially, and encouraging the Province to evaluate the highest and best use of RNG considering its limited availability.

The City is already working to incent the move from fossil fuel to low-carbon energy systems for new buildings in the City, through leveraging the Step Code and our updated Community Energy and Emissions Plan. However, there is a “fuzzy” bit in most legislation around “Renewable Natural Gas” as a transition between fossil fuels and full electrification. This is, of course, heavily promoted by the legacy gas industry. This motion moves the city in our internal policies and in our senior government advocacy toward rapid electrification in place of this stopgap that doesn’t actually reduce emissions.

And that was a meeting! Back to the door knocking!
Police Numbers (update!)

The topic of policing is coming up across the region in various forms, most of them related to elections. Last week, two non-incumbent people running for Mayor in the two largest Metro Vancouver municipalities are promising to increase the number of police officers to address a perception of increased crime. I have also heard some discussion recently about New West not increasing its police force to keep up with population growth. So I thought it would be good to write a blog that looks at the data, as a precursor to what is likely to be a deeper discussion in the community about policing.

When I say “the data”, I mean the information provided by police themselves and reported to the Province of BC. The Province has a page dedicated to collecting and reporting out all kinds of police information from across the province that you can find here. The part I am most interested in is report linked at the bottom of the page entitled “Police resources in British Columbia, 2020“. It is the most recent and comprehensive comparison of police forces across the province, and though I’ll add data caveats below, it seems like as definitive a source as one can find.

In comparing Metro Vancouver policing, there is one thing that needs to be addressed up front: of the 17 municipalities with more than 5,000 residents, 12 are served by municipal RCMP forces, and 5 are served by Municipal Police. When you dig into details, the service model is actually much more complicated than this, as there are Regional Task Forces that are shared between multiple jurisdictions and may include Muni and RCMP staff, and every city receives some services from some task forces while most also lend staff to these task forces. There are also other forces such as Transit Police and Federal RCMP detachments operating in the region. The overlaps are complex, and the report itself has a lot of text explaining these complications. Read that report if you want those kind of details.

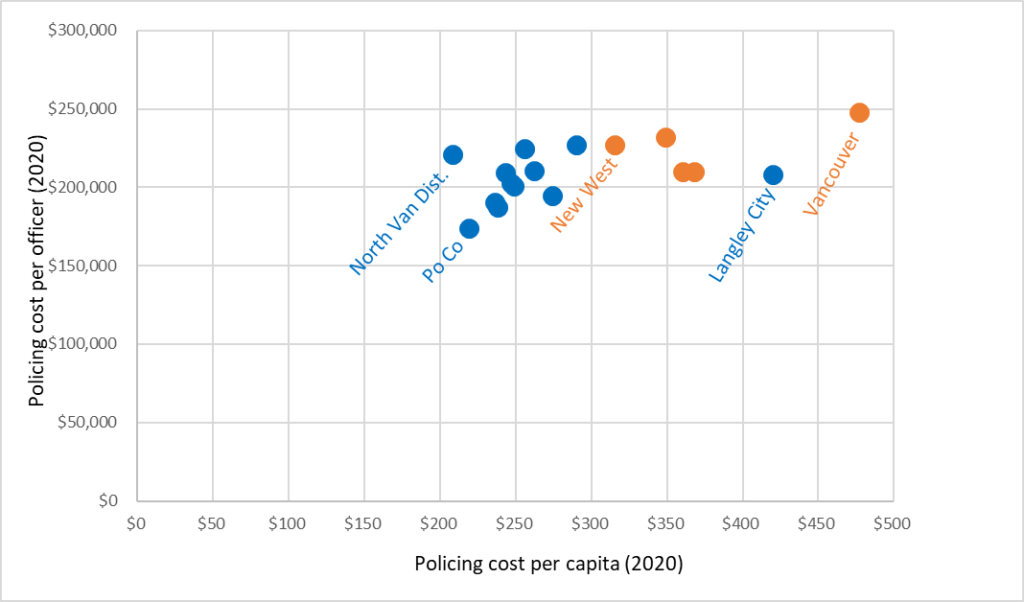
A commonly heard point is that Municipal police cost more, but provide better service and better local accountability. This is the concept behind Mayor McCallum’s argument for establishing a Municipal force in Surrey. There are a couple of ways to look at policing cost, but these two make sense:

The orange points are Municipal forces, the blue are RCMP. You can see the policing cost per capita does tend support the notion that local cops cost a bit more. You also see there is a wide range of per capita costs regardless of the provider – Vancouver and Langley City residents pay almost twice as much as North Vancouver District residents do for police. You can see New West has the lowest costs of any Municipal force, but is still more costly than most RCMP forces. The cost per officer to run the police force does not vary quite as much, and you can see New West is middling-to-high compared to our cohort, but not completely out of scale with the regional average.

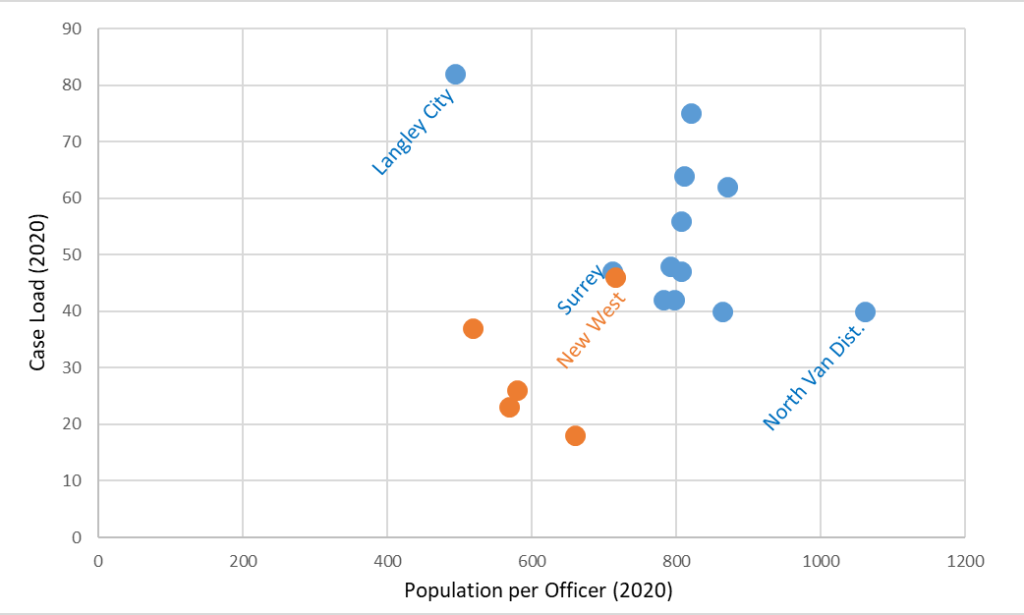
This brings us to the number of officers per capita, or (the easier wat to count it) the number of residents per police officer. I think the most interesting way to look at this number is compared to the Case Load. That stat is the number of criminal offences per officer, which is an imperfect but useful proxy for “how busy is the average cop?”

You can see here that New West is about smack dab in the middle of the region in both of these counts. Our numbers are remarkably close to Surrey, which is a very different city with an RCMP force (these stats were collected before the Surrey Municipal police force was set up). You also note that Municipal forces general have fewer people per police (more police per capita) and lower caseloads than RCMP forces, with New West again leaning towards RCMP levels more than fitting in with the Municipal Force cluster.

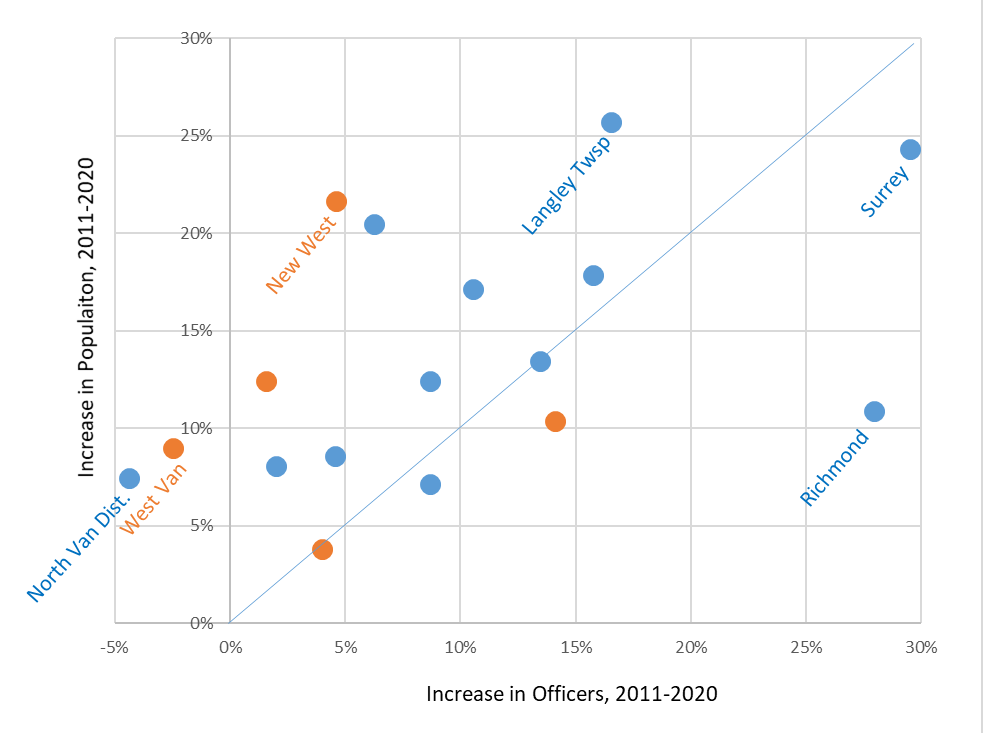
Of course, this discussion leads to a discussion about growth, and whether the police forces are keeping up with regional population growth. The data here is a again from the BC Government report, including the 2020 population data. I gathered the 2011 population data from another BC Government dataset you can find here if you want check my numbers.

You can see that by percentage of growth over the decade, very few police forces have added members at the rate that population has grown (the dots on or below the blue diagonal lines being the few that did), and two North Shore municipalities have fewer police now than they did in 2011. You will also note that there isn’t a clear divide between RCMP and Muni forces here. It is clear that the increase in Police in New West (going from 108 to 113) has not kept up with the 22% population increase. It is also interesting that Surrey and New West are so far apart in this graph, when they were overlapping in the last – the relationships between officer count, case count, and growth are obviously complex.

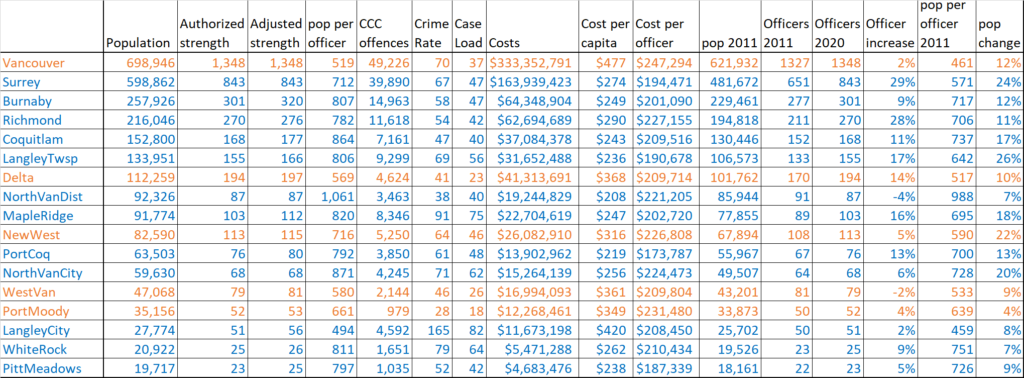
So those are the numbers (table form below for those who wish to nit-pick), and I am sure that this kind of data will lead to principled and well informed discussions in the community. I just want to make the point that is often missed in these discussions: City Councils generally do not determine police officer counts. In RCMP-serviced communities, I have no idea how those decisions are made. For a City with a Municipal force, that is the job of the Police Board working with senior policing staff, backed by provincial service standards and based on the unique needs of the community. If you are interested in leading the discussion on police officer counts in New Westminster, your opportunity is now, as the province is currently receiving applications for Police Board members right here in New Westminster. Apply here, the closing date is September 9th.

Finally, it is important to note some data caveats. These are 2020 numbers, the most recent the province has available. The actual number of sworn officers in your community is likely lower than the numbers here, because these stats are “Authorized Force” and assume that all funded positions in the police force are filled. This is rarely true in the best of times, but in the last few years we have had events that made it less true, such as the regional shifts related to Surrey ramping up its Municipal Force and the COVID-related Great Resignation affecting many sectors of the economy. Also, there was a dip in crime in 2020 related to COVID (this is discussed in the report), and though we might presume this dip was systemic and equal across the region, this data neither confirms nor refutes that.

Raw numbers used in the charts above. Sources listed and linked to in the text above.

BONUS CONTENT!

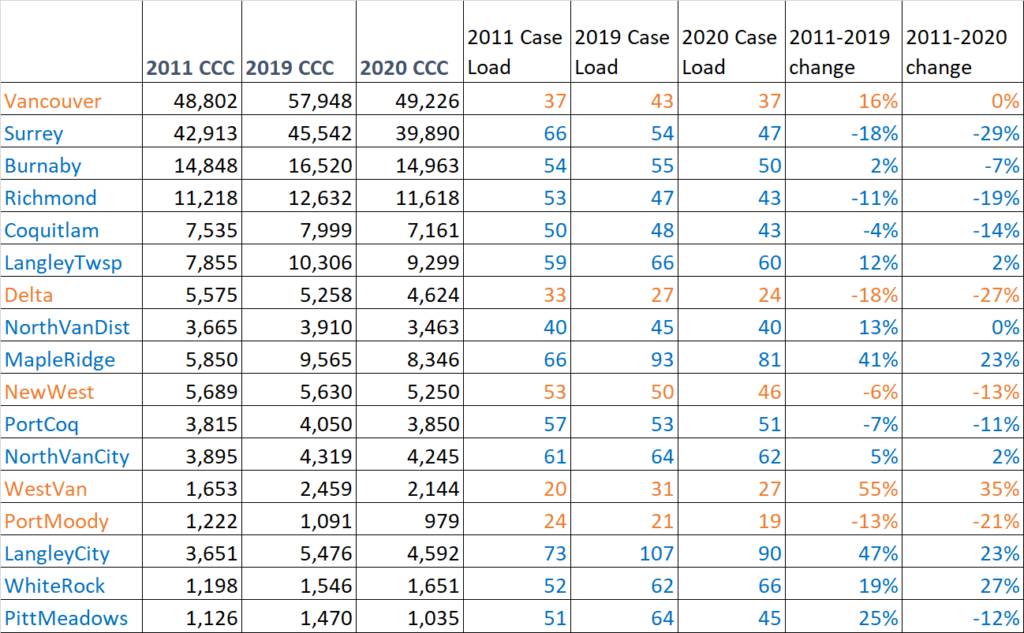
In the comments, a reader suggested comparing Case Loads between 2011 and 2020 would be interesting. The table I downloaded from the province didn’t have case load data from 2011, but you can find CC Case counts in the “Jurisdiction Crime Trends” table on the same page. From that and the Authorized Strength already reported, you can calculate Case Loads from 2011 an 2020. The results are interesting, if a bit unclear. And again, I want to emphasize the 2020 data is likely anomalous due to COVID, so I also did the math comparing 2011 to 2019, which might be the most recent “representative” year. Sorry, the best you get is a table:

So Case Loads are generally down, but there are some municipalities where they went up, some by quite a bit – West Van and Maple ridge share a strange similarity here. You can also see an almost universal drop in 2020, except in White Rock. My first impression is probably that the majority of cases are likely more complex now than they were a decade ago, but once again, you can read form the numbers what you will! I’m just reporting here.

Bad Data. Again.

The Fraser Institute are up to their old tricks: shabby data gathering resulting in inaccurate results. I’ve demonstrated this before, and even sent them a letter outlining the big mistake they made last time they did this (not coincidentally four years ago, just before the last municipal election), and they have blithely made the same mistake again. So here I am to correct the record. Again.

The Record shingled this story into my social media feeds, and it speaks to this report prepared by the Fraser Institute. The report attempts to compare “spending per capita” and “revenue per capita” across the 17 largest municipalities in Greater Vancouver. I’ve said before, this is not a competition, but on the face of it, this isn’t the worst way to look at whether residents in various municipalities are getting value for their tax dollar. There are a few problems with over-simplification (I’ll talk about those further down), but as a first pass it is an interesting easy-to digest media byte.

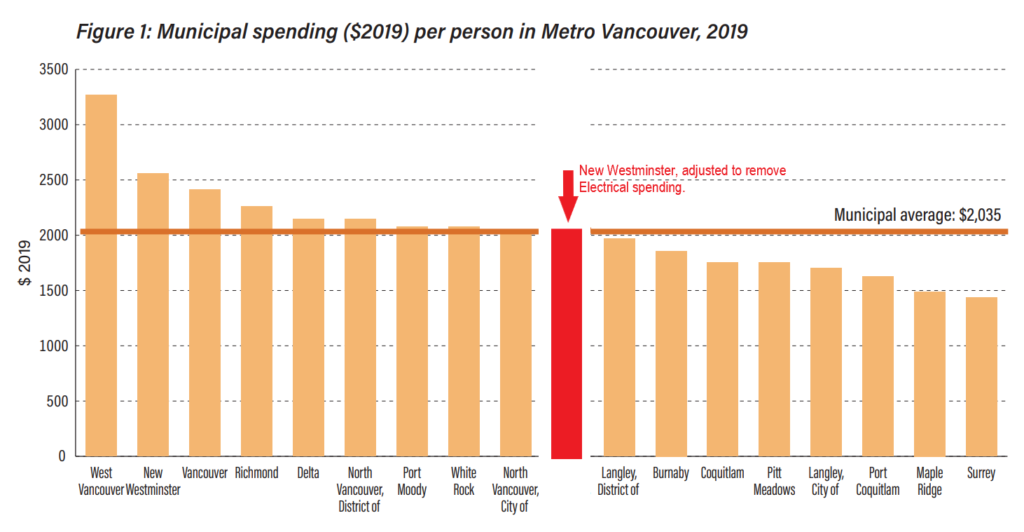
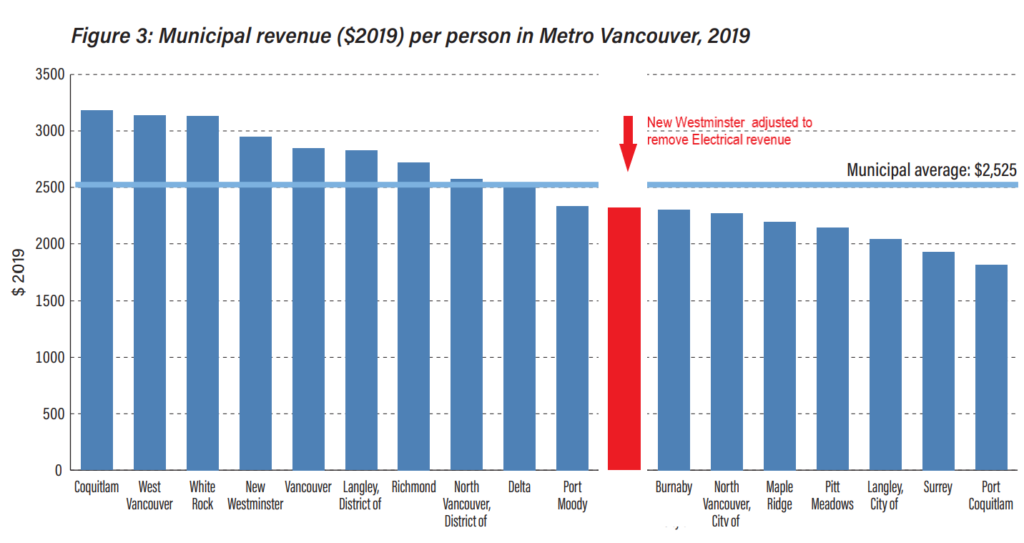
The problem is, New Westminster, unlike any of the other 16 municipalities listed, has an electrical utility, and the data used by the FI rolls that Electrical Utility into the overall revenue and spending amount. Residents of every other city pay for electricity, but it is not included in these comparisons. This is not an insignificant difference. New West Electric pulls almost $50 Million in revenue ($622 per capita), and spends more than $40M ($505 per capita) every year.

So, much like I did last time, we can adjust for this significant factor, and shift the FI charts to reflect an apples-to-apples comparison. You see New West, when fairly compared, does not have the second highest spending in the region, but is tied with North Van City for 8th place, firmly in the middle of the pack:

Table from Fraser Institute report, modified to show how New West compares when the $40.6M in annual Electrical Utility spending is removed, allowing a true apples-to-apples comparison with other municipalities that do not have an electrical utility.

And when fairly compared, New West does not have the second highest per capita revenue in the region, but instead tenth, slightly below the regional average:

Table from Fraser Institute report, modified to show how New West compares when the $50 M in annual Electrical Utility revenue is removed, allowing a true apples-to-apples comparison with other municipalities that do not have an electrical utility.

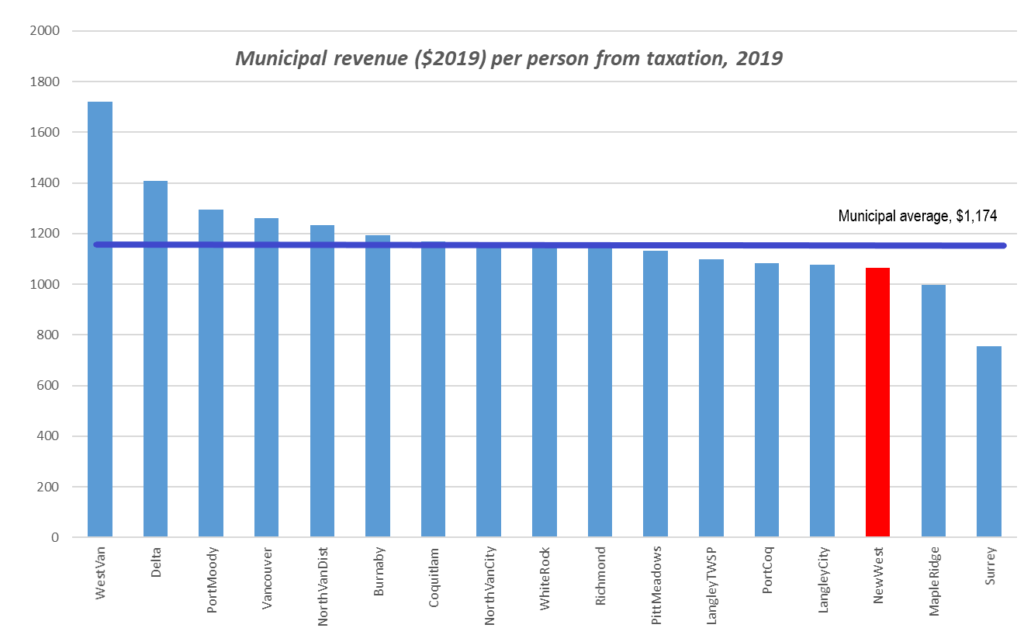
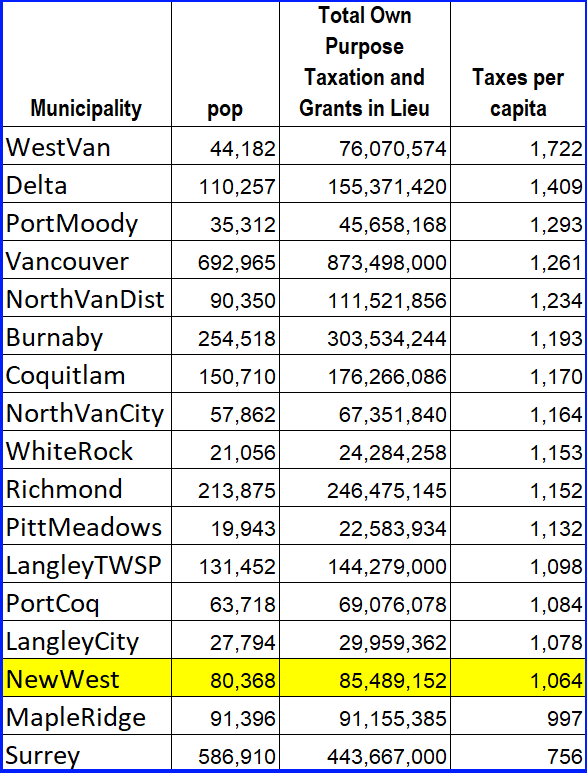
The FI also conflates all revenue sources. This is problematic, because they vary greatly across the region. Municipalities have different fees for services and different ways of managing utilities. Also, as this is a data snapshot for only one year, factors like one-time senior government grants or sale of properties in any given year can really juice the numbers and make apples-to-apples difficult. When fans of FI reports talk about City spending, they are usually worried about taxes, so it is fortunate that the same government database from which the FI draws their numbers breaks down the revenue sources. It is easy to separate out Property Tax revenues from the pile, and compare on a per-capita basis. When you do that, you see New Westminster is one of the (and I totally buried the lede here) lowest-taxed municipalities on a per capita basis in the Lower Mainland:

Comparison of Revenue from Taxation across the lower mainland. Population Estimates same as used in Fraser Institute report cited above, taxation data source is BC Government Schedule 401_2019, column D “Total Own Purpose Taxation and Grants in Lieu”. available here: https://www2.gov.bc.ca/gov/content/governments/local-governments/facts-framework/statistics/statistics

And in case you are interested, here is that data in tabular form:


Now onto the detail part for those still interested.

I find the lack of adjustment for the electrical utility fascinating, not only because I pointed it out to them last time, but also because they do make and adjustment for the West Vancouver Blue bus system – a single-municipality expense and revenue stream. If you compare the FI data to the government database, you find West Van expenses are actually higher (by $417 per capita for spending and $910 per capita for revenue) than the FI report. They make that adjustment for West Van blue bus, but not for New West Electrical. This seems inconsistent.

Looking at the government database also demonstrates the problem with using snapshot data for one year. Line items in spending like “loss on disposition of assets” sound technocratic, but it is writing off value of assets either destroyed or sold off, and it varies across the region year by year as you might imagine. Add to this annual amortization adjustment, and cities with lots of physical assets (like Vancouver) and those that have invested recently in important infrastructure are disproportionately cast as spendthrifts. On the revenue side, one-time grants for big projects may be counted in this year data, but not reflect overall revenue generation ability. In 2019, Coquitlam sold $60 Million in assets – more than every other municipality combined – but that is not an annual (or sustainable) trend and does not reflect any long-term economic comparison between Coquitlam and any other municipality.

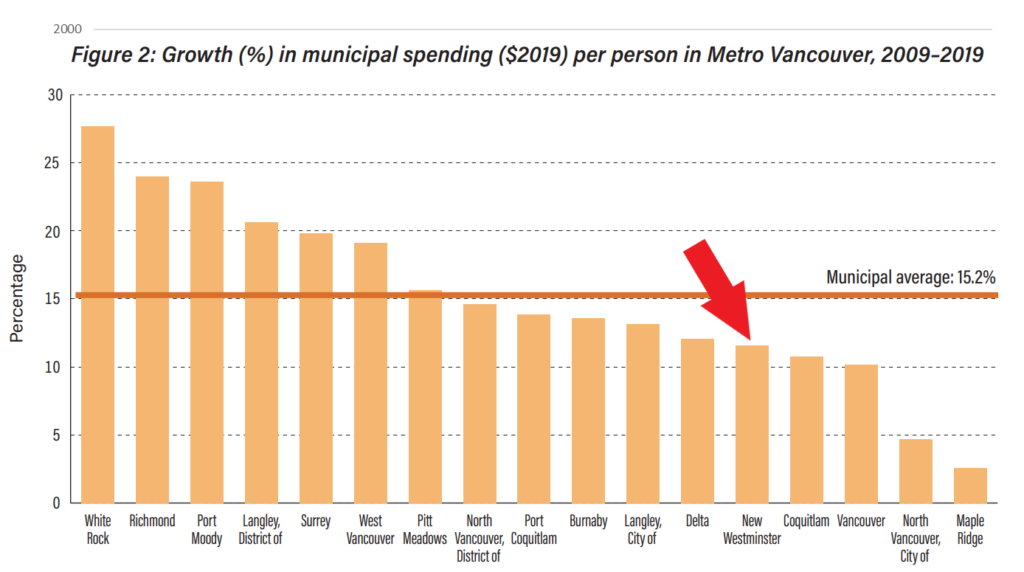
So the comparison is sloppy. And as much as I would like to counter some critics with the table that shows New Westminster spending growth over my time on Council as one of the lowest in the region (and, notably, much lower than the 18% cumulative inflation of the 10 years ), the way the FI presents data is so poorly explained that I don’t even feel good using it to tell a story that makes New West look like the kind of fiscally responsible municipality the FI would allege to support:

Table copied directly from the Fraser Institute report cited above. The only thing I added was the red arrow.

I just want the FI to do be fair, and the local and regional media to do a little bit of preliminary analysis before they credulously print their press release. After years of this kind of sloppy work the FI deserve to be treated with more scrutiny.

Reaching out

Hey Folks.

Not much updating going on here. Council is on the summer break but I am busier than I have ever been, because I am running for Mayor. Every day is filled with meetings, scheduled or impromptu, in person and on-line, with campaign team folks, with other candidates, with community stakeholders. I have been helping with platform discussions and writing and design, planning out comms for September, helping coordinate events and fundraising, helping line up volunteers for the work ahead. We have a great team and a lot of tasks, and the Mayor candidate tends to get pulled into a lot more of them. Yesterday I got through 4 of the 7 things on my morning To Do list, today my list is longer. And this note wasn’t even on it…

It can be exasperating at times, barely keeping up, but most evenings (when there isn’t another event) I drop it all at 5:30 or so, and meet a volunteer for a couple of hours of door-knocking. By 8:00 I am recharged and excited again, because meeting people and talking about the city – what we do well, what we need to do better – is just about my favourite thing in the world. People in this community are so positive and forward-looking. It’s joyful work and those conversations are like a breath of fresh air.

I don’t generally use his Blog for campaign stuff. You can find campaign info at my campaign site, at my Facebook site, and of course I’m always Twittering, I only rarely put campaign stuff on here and that won’t change. But I’m talking Campaign on my blog today because I want you to go here right now: communityfirstnw.ca/donate_patrick

There are a lot of people who read this blog who I don’t have other direct contact with. I meet people on the doorstep who tell me they read this and appreciate the work I have done to try to make the work of Council easier to understand and more transparent. It takes a lot of time and I don’t get paid extra to do it, but it is part of the commitment I made when I got elected to Council 8 years ago.

If you are reading this, and have been reading this, you know who I am and what I stand for. At a time when politics is increasingly cynical and polarized, I still believe we can talk through the challenges in our community in an open and transparent way, we can hear different voices and stand behind decision making. We can also change our mind when given new information or better data. We can make this a better City and a better world by doing these things.

If you think this too, and appreciate the work I have done to bring the community into City Hall, then I ask that you donate to my Campaign for Mayor so I can keep doing this work.

Why You? Because new campaign finance rules mean I cannot receive any business or union donations. Nothing from CUPE, nothing from BIA members, nothing from the development companies. Every donation must come from an individual, and no individual can donate more than $1250. I am not even allowed to donate more than $1250 to my own campaign. This means I am not allowed to pay for my own lawn signs, or for a campaign office. I can pay for newspaper ads or pamphlets, but not both. I need those who support me to donate to my campaign, and our team needs to pool funds to get those things done. We need you.

As always, if you have a question or concern, drop me a note. I might not have time for an ASK PAT response right now, but I try to reply to every email I get. Please consider helping me out if you are able, then get back to enjoying the summer. And now I’m off to the New West Farmers Market to judge a Pie Contest. But that’s another blog…