The last Council Meeting of 2018 was an eventful one, as you can see in the Agenda here. We started with two pretty lackluster Opportunities to be Heard:
Development Variance Permit DVP00657 for 41 Duncan Street (490 Furness Street) (Child Care)
Variances are required for this childcare project because the measured set-backs between the childcare building and the edges of the lot they are constructed on are reduced (in part because of the development plan for the overall site, in part to give better playspace. No-one sent any correspondence and no-one came to speak to the variance. Council moved to approve the variance.
Development Variance Permit DVP00656 for 618 Carnarvon Street (Sign Bylaw Variance)
A sign bylaw variance is required because the measured area of the sign, not the printed copy, but the entire field of paint, exceeds the Bylaw No-one sent any correspondence and no-one came to speak to the variance. Council moved to approve the variance.
The following items were Moved on Consent without discussion:
2019 Child Care Grant Recommendations
This is an annual $40,000 grant program to support capital improvements to non-profit childcare operations in the City. Council moved to grant a total of $39,321 to eight Child Care projects in the City representing over 400 child care spaces, with the remaining $679 to be allocated through the Child Care Action Team to subsidize education or training to non-profit childcare providers in the City.
2019 Heritage Grant Recommendations
This is an annual $25,000 grant program to support heritage initiatives in the City. There were 3 applications totaling $15,992, and the committee recommended granting them all. Council agreed.
800 Boyd Street (Queensborough Mini Storage): Consideration of Development Permit for Issuance
The landowner at this Queensborough property wants to expand the existing self-storage place to include a third building, and needs a Development Permit to do it. It has been supported by the Residents Association, and their public open house to receive comment on the application was attended by zero members of the public. The Design Panel also approve of the project. Council move to approve the Development Permit.
Q to Q Pilot Ferry Service – Update
This is an update on the QtoQ ferry service, which is seeing much less use than in the summer (as expected). There are a consistent 120 trips a day during the week, indicating a base level of service for commuters (what we kind of hoped would happen), with between 200 and 300 rides a day on the weekends, depending on the weather. Staff are going to do some more monitoring, hoping that they can adjust operations to best suit the needs of the passengers and hopefully save a little on operational cost.
Of bigger concern, there are a few operational concerns with the Port Royal dock, and the Port of Vancouver does not approve of the efforts the City wants to implement to make it work better, because of navigational risks for the log boom operators next door. So we have some more work to do.
Small Dog Off-Leash Area Trial in Moody Park
After some public engagement and a short trial, Parks are ready to install a permanent “small dog only” off-leash play area in Moody Park. Through the public consultation, it is pretty clear that some portion of the dog-loving public is not going to like the approach the City takes, no matter what that approach is, as there are many divergent views on every aspect of dog parks. Of course, a larger facility in another part of the park might be desired by most users, but there is limited space in Moody Park, and having two separate dog areas in that constrained and very busy park is just not fair to other park users.
The following items were Removed from Consent for discussion:
2019 Amateur Sports Fund Committee Grant Recommendations
This grant fund is a legacy of the 1973(!) Canada Games, along with some Casino funding added in 2000. There is an endowment with the interest paid out as grants to support amateur sports programs in the city. We had $323,000 in requests, and $35,000 budget. Council moved to approve the recommendation that the entire $35,000 budget be allocated to 10 sports organizations in the city, representing almost 2,700 athletes.
2019 Arts & Culture Grant Recommendations
This is an annual $30,000 grant program to support independent Arts & Culture programs in the City. The Grant Committee reviewed requests totaling just over $39,000. Council Moved to approve the recommended granting of a total of $30,000 to 13 different programs.
2019 Community Grant Recommendations
This grant program is meant to support projects which contribute to the community livability of the city, and grant recommendations made by a volunteer committee of New West residents. There is a $75,000 budget for this grant program. There were 24 applications totaling $105,000, and the committee recommended providing grant to 19 projects totaling $63,393, and the transfer of the $11,000 surplus to the Youth Counselling program under the Partnership Grant (see below).
2019 Environmental Grant Recommendations
This is an annual $20,000 grant program to support environmental initiatives in the City. There were $32,000 in requests, and Council supported the committee recommendation to grant a total of $20,000 to 6 programs.
2019 City Partnership Grant Recommendations
This grant program is meant to assist incorporated not -for-profit organizations with delivery of major services to the community. The services must assist the City to fulfill its vision statement and requests are reviewed by a Review Panel. The best way to think about partnership grants is that these are things some might expect a City (or senior government) to do, but it is easier and less expensive for us to grant money to others and let them do it.
Hence, this is the biggest grant category – established programs tend towards here, and it takes on the character of a “catch all”. In this lies the trouble. There is a $485,000 budget for this grant program, but there were 23 applications totaling $1,061,755. Clearly, hard choices need to be made here.
One concern this year is that several organizations that asked for 3-year grant commitments rely on that stability to not only create consistent programming, but also to allow them to leverage other grant sources – both goals we want to see from partnership grants. But if every grant is promised for three years, we have no room for new (and potentially really beneficial) programs to develop.
Alas, this is mess, not because of the work of the review committee, but because we as Council have not done the work to provide clear guidance and priority to inform their work. In the end, Council moved to refer these recommendations back to the committee for more work with a bit of guidance. More to come in January.
Committee Governing Documents
This is an update to the terms of reference of a bunch of our Council Advisory Committees, to explicitly open spaces for representatives from a First Nation, to open up opportunities for co-chairs to make committees work better if needed, and to allow Council to remove representatives that don’t actually show up.
We got into a bit of a debate here about some of the wording, which might have sounded bureaucratic to some, but I think speaks to our cautious approach to reconciliation. The wording of opening up a seat for a “representative of a First Nation” is potentially more limiting than we intended. I think our intent was to incent participation on our committees by people with indigenous experience, but the term “First Nation representative” may be read to mean representative from the governance of a First Nation as a stakeholder as opposed to a community member who can add to our conversation. Nothing wrong with the former, but I think we also want to encourage the latter. At a second level, the term “First Nation” is generally thought to not include Metis or Inuit, which may preclude the urban aboriginal residents we want to hear form. Short version: we can’t make these gestures without considered intent, otherwise they risk becoming token gestures that don’t actually move us towards a meaningful dialogue. So we will do a bit of a review of our language here and make sure the language fits our intent. Let’s make sure we are doing this right.
Rent Bank Program: Update and Request
The Rent Bank is working. It is providing no-interest emergency loans to prevent a small catastrophes from making a people homeless – as serious concern in our tight rental market, as we can stop the vicious cycle of homelessness right at the start. The City provides administration funding for the program (the cooperating Credit Unions provide the loans). It also acts as a point of contact for people facing homelessness, so even if they do not qualify for the emergency loan, they may find out about other programs that can provide them support at a crisis time in their lives. The program in its short history has prevented a couple of dozen people becoming homeless – helping them, but also saving the provincial government a lot of money.
Council moved to increase our funding to help with this administration, and to ask the Province to help fund the program now that it has been demonstrated to be viable and something that is likely saving the Province orders of magnitude more money.
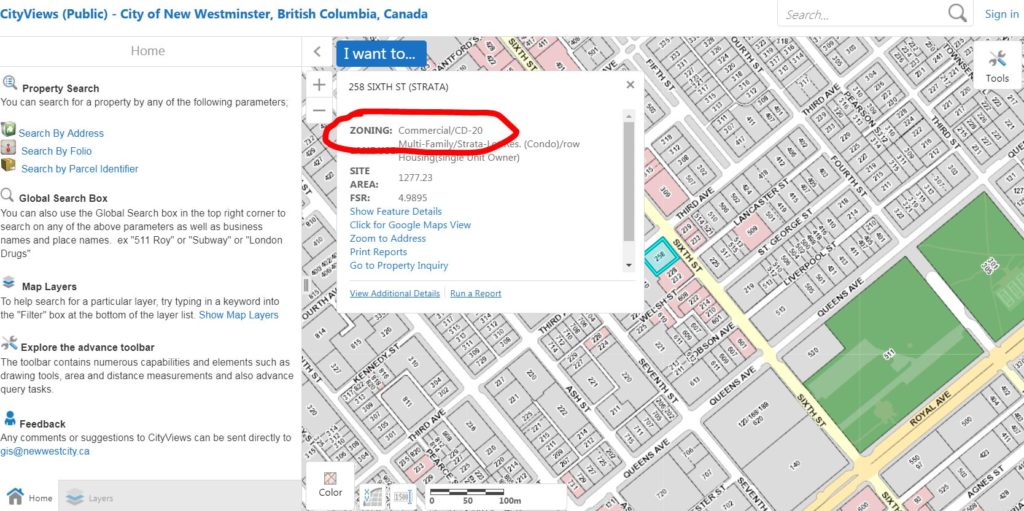
Development Services Fees and Rates Amendment Bylaw: Retail Sale of Cannabis – Bylaw for Three Readings
This is a Bylaw we adopted back on November 19, but it had the wrong Schedule B attached at the time due to a clerical error. Staff caught the error, so now we are going to amend it to include the appropriate schedule.
Proposed BC Energy Step Code Requirements for New Part 3 Multi-Residential and Commercial Buildings
The Province has been working on updates of the building code to make buildings in BC more energy efficient in order to meet our long-range energy and emissions reduction goals. There is a lot going on here, but the very short version is that the province has termed it the “Step Code”, with the idea that Cities can phase implementation towards higher “steps”, with the top step being zero energy buildings – those that are so efficient they can be heated by waste energy already in the house (like the back of your fridge and the human bodies in the house). The idea being that this buffers homebuilders, the construction industry, regulators and inspectors from an all-at-once change, and instead we can phase in improvement over time.
The City is already implementing a Step Code strategy for single family homes, and all buildings up to three stories and 600m2, we are now moving into the larger-building sector (condos and purpose built rental). By 2020, new buildings will have to hit Step 3, unless they have a Low Carbon Energy System, in which case they will be required to hit Step 2. The result is basically the same from greenhouse gas emission sense – either they switch to non-carbon energy sources, or they useless energy.
We are also going to look at requiring homebuilders to apply energy ratings on their new buildings, so owners will know what they are buying. Like knowing the fuel consumption of the car you buy or the KW/h usage of your clothes dryer, you really should know what the energy costs of your new house or apartment is.
Update on the City’s Snow and Ice Response Preparations
This is a timely update on the City’s snow and ice response plan, following up on requests last year and the year before to review how snow removal from sidewalks and pedestrian areas are managed in the City. The City is going to do more to get the information out about residents’ responsibility to clear their sidewalks, and to address the issue of lane-ways creating pedestrian barriers.
However, I don’t think we are going far enough. Since we adopted a Master Transportation Plan that prioritizes active transportation (walking and cycling), then public transit, over personal automobile use, it seems incongruous that we spend so much money and resources keeping roads free of ice and cleared of snow, but rely on the neighbourliness of our residents to do the same for our sidewalks and bus stops. This is also in opposition to our Age-Friendly Community Strategy, and our goals to become a more accessible City.
Therefore, I moved that we ask staff to let us know what the practicalities and costs are of the City taking over the responsibility for sidewalk plowing, at least in a set of pedestrian priority areas (in the same way that we prioritize roads). If we can’t afford it, I want to know what that cost is. If we need to move priorities to make it happen, I need to have the data to support that.
September 6, 2018 Arts Commission Recommendation re Cultural Services
The Arts Commission has a recommendation about how we structure Cultural Services in the City. This will likely be a part of our strategic planning process for the coming term, and will no doubt interact with the Arts Strategy which we discussed during the Open Workshop portion of today’s meeting. More to come here…
We then had one item of New Business:
Draft Inclusionary Housing Policy for Rezoning Application Negotiation
The City now has the authority to require that any development above a certain size to include an affordable housing component, in the form of below-market rental. We have the ability to make this a condition of OCP amendment or rezoning. There are a lot of details here, and this is sure to cause a lot of public conversation – and raise a bit of concern among the development community.
The City has already negotiated two below-market affordable housing projects as parts of larger developments – 159 units in Victoria Hill completed in 2017, and 66 units on Carnarvon Street about to break ground now. But the need is increasing, so this policy will allow us to move beyond the ad-hoc process we currently use. This is a preliminary report, and these will be public consultation on this. I am looking forward to learning more as we go along.
We then adopted the following Bylaws:
Council Indemnification Bylaw No. 8075, 2018
As discussed last meeting, this Bylaw that outlines when Council members are and are not indemnified in relation to their Council work was adopted by Council.
Five-Year Financial Plan (2018-2022) Amendment Bylaw No. 8062, 2018
Also discussed last meeting, this amendment to the Five-Year Financial Plan to include some financing for the replacement of the Canada Games pool was adopted by Council.
Engineering User Fees and Rates Amendment Bylaw No. 8071, 2018
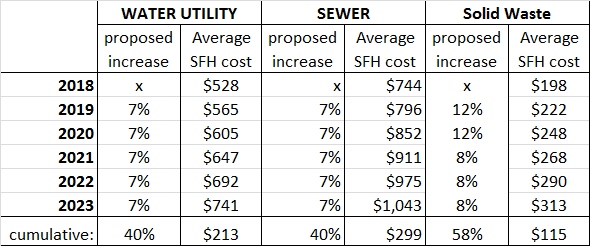
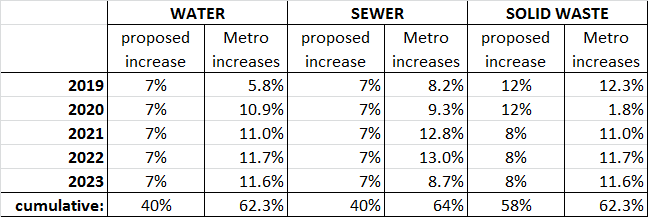
Discussed at some length, this Bylaw that formalizes the utility rate increases for 2019 was adopted by Council.
Development Cost Charge Reserve Funds Expenditure Bylaw No. 8072, 2018
As discussed last meeting, this Bylaw that allows us to build things with the money we collected from the development community through DCCs was adopted by Council.
Parks and Recreation Fees and Charges Amendment Bylaw No. 8066, 2018
This annual update to our Parks and Recreation fees, as discussed last meeting, was adopted by Council.
Whew! It was a content-dense last meeting of the year. I am taking a bit of a vacation, so will probably not be blogging much for the next few weeks. If you want t know where I am, find me on Instagram or Facebook, as I will try to send updates from the vacation. I hope you have a good holidays, and your 2019 is full of the best kinds of excitement!
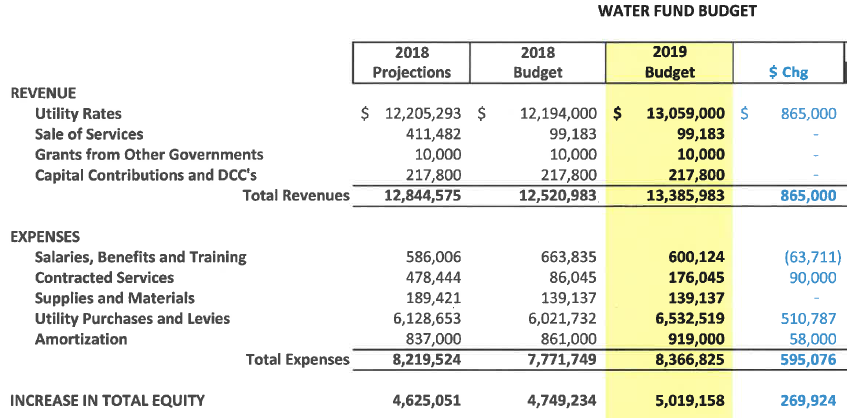
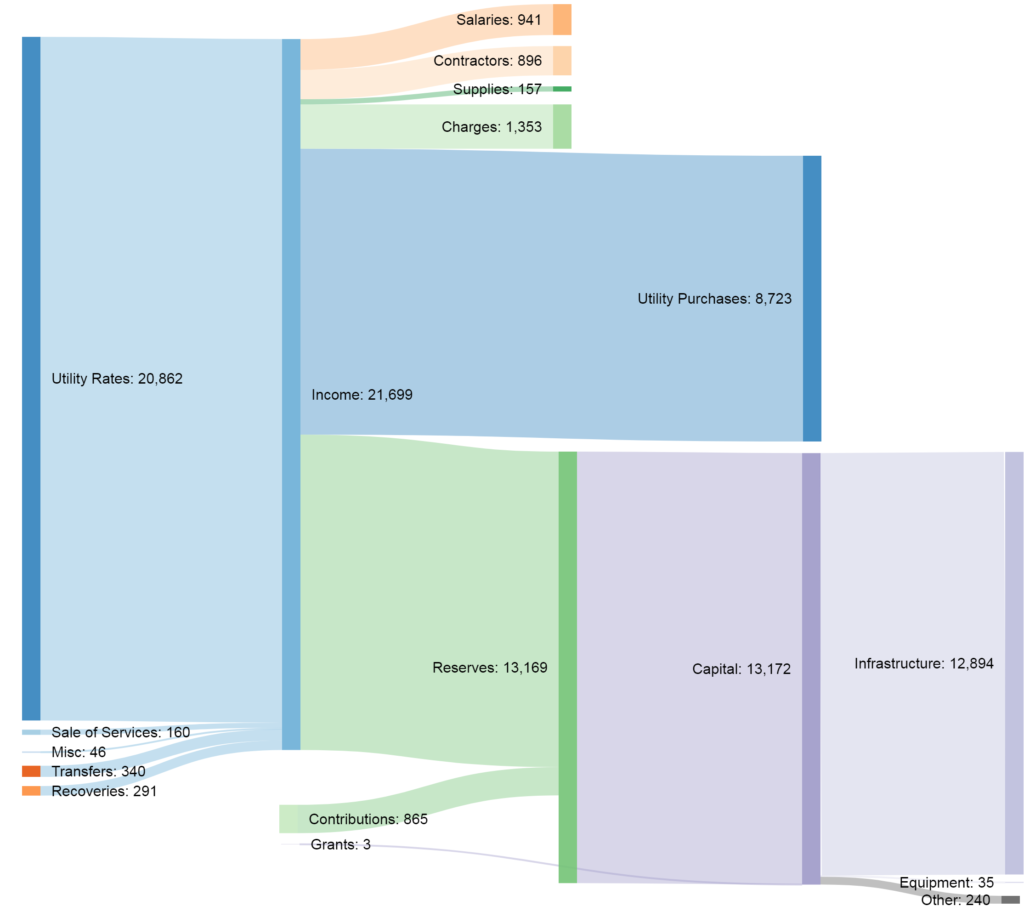 Immediately, you will notice we are spending much more money (proportionally) on infrastructure here than in the water utility. This is largely due to the ongoing sewer separation work that New Westminster has to deal with. You can see it is almost all spent on actual infrastructure ($13 Million!). You will note also that the gap between what we are putting into reserves and taking out is large – about $2.7 Million in 2019. We are also expected to receive another $865K in grants to help pay close that gap. Again, more on this later.
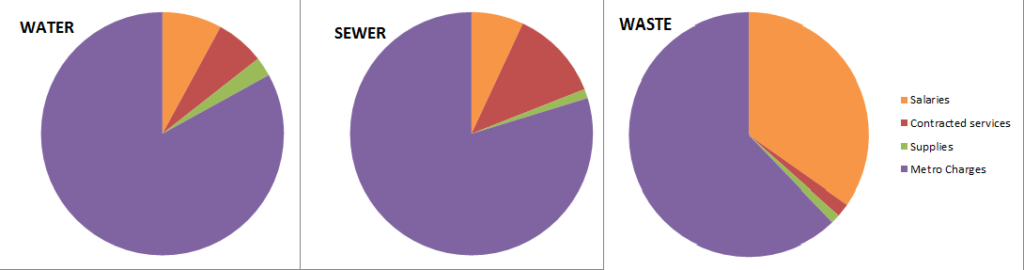
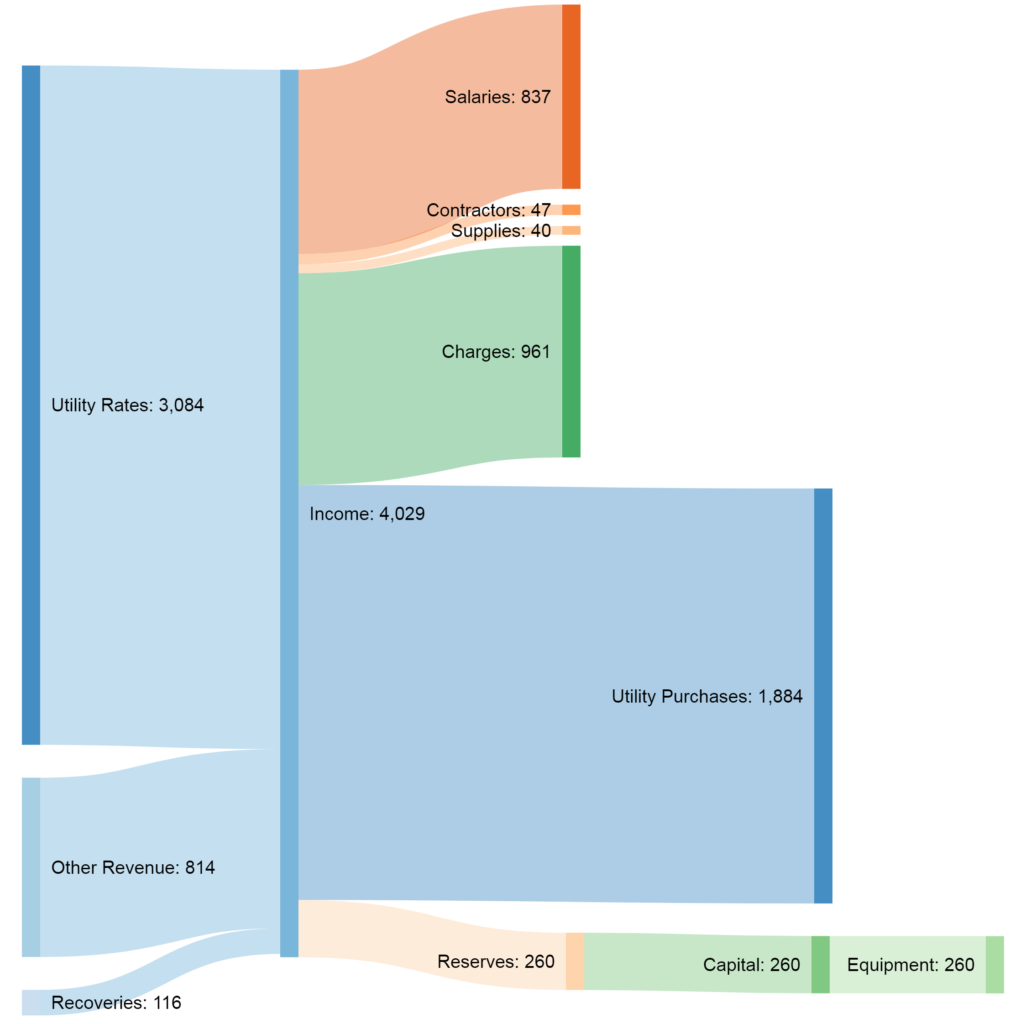 Two things stand out here: the capital budget is much smaller (it is all equipment), and both salaries and Charges is much bigger. This has to do with the nature of the work, collecting garbage requires people, and I suspect the largest “charges” expense is fuel to keep the garbage trucks rolling.
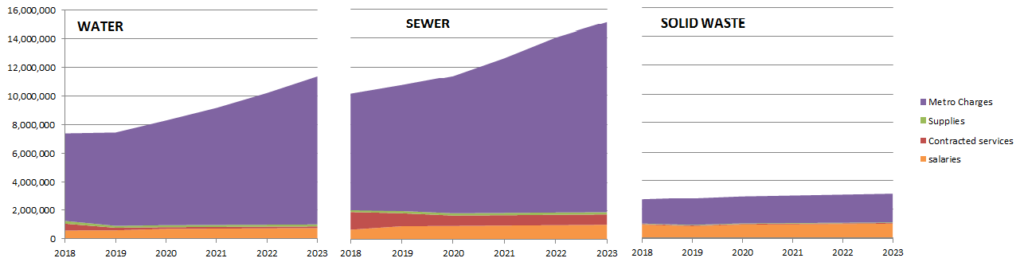
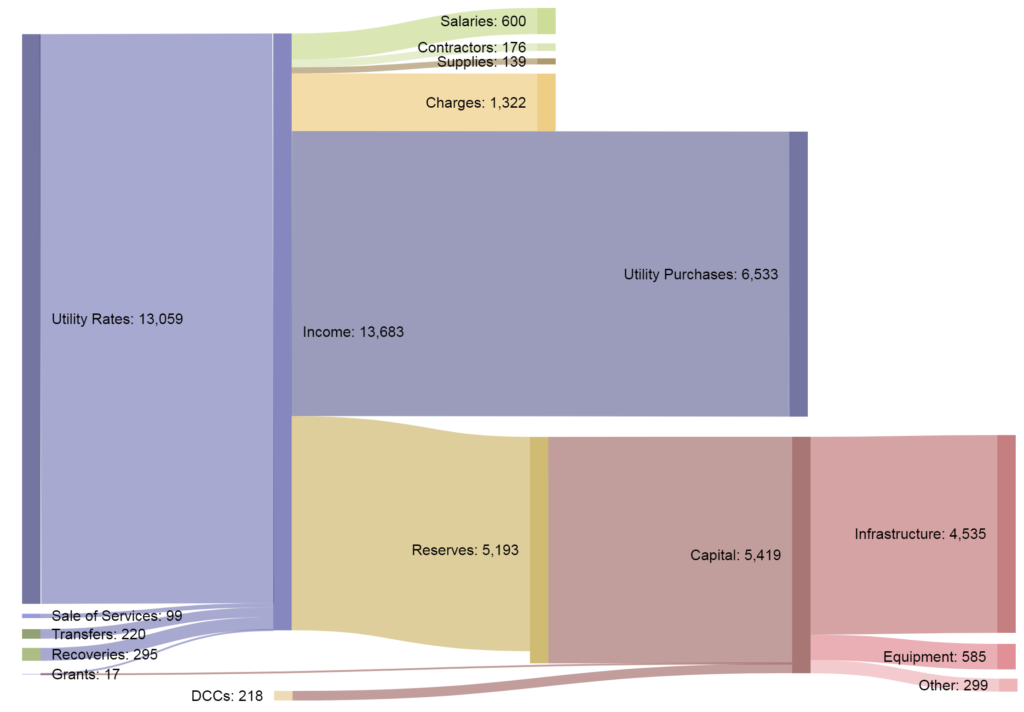
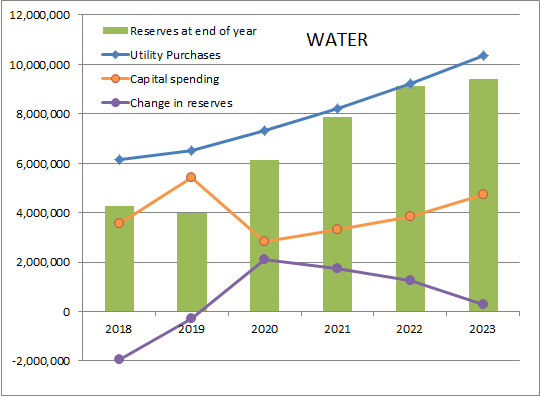 This graph shows how the main Water Utility cost drivers are going to change over the 5-year plan. The rates we pay to Metro for water going up steadily, capital spending increasing at a lower rate, and the trend for our reserves is moving from a small annual loss (remember the gap in the flow chart above) to an increase, then trending back to even. You can see by the green bars that our reserves are currently just over $4 Million, with the goal of them settling in at just under $10 million.
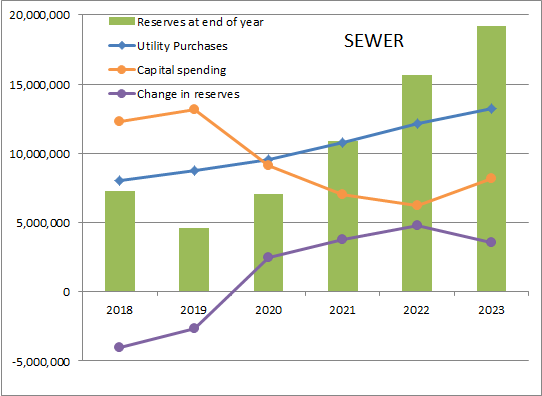 The same graph for the Sewer Utility shows Metro rates steadily increasing, capital spending going down, and our reserve contributions again going from negative to a more sustainable level.
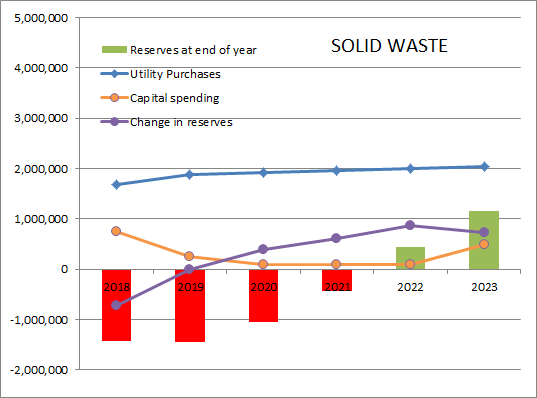 Finally, our Solid Waste accounts show Metro rates only increasing moderately, and our capital spending going down for a few years while the trend for reserves will hopefully go from a deficit position to a small positive reserve.