Our January 28th meeting started with a well-attended public hearing, which I am not going to talk about here, because the topic deserves another blog post on its own. So, other than the Public Hearing and resultant Bylaws, we started our regular Agenda with approving the following items on Consent:
Alternative Approval Process for Electric Utility Infrastructure Loan Authorization Bylaw No. 8041, 2018
We need to build a new electrical substation in Queensborough. The electrical utility needs to borrow up to $30Million to do that. Since it will take more than 5 years to pay that loan back (as it will be paid back out of the profit we make in electrical sales), we need authorization from the public to draw that loan. I hate the Alternative Approval Method, but it is the only tool given to us under the Community Charter to get this important infrastructure built, so here we are.
If you are opposed to the City’s electrical utility borrowing to build a substation, and are an eligible voter (New West resident or property owner, Canadian Citizen, over 18, etc.) you will have a 30+ day period to submit your opposition to the City. Come to the front desk at City Hall and fill out the form before March 11 at 7:00pm.
Recruitment 2019 Appointments to Advisory Committees, Commissions, Boards and Panels
This is the official release of the residents and stakeholders selected to serve on council Advisory Committees and other boards and panels in the City. If you applied for any of the above, look for your name here! If you don’t find your name, please don’t take it personally, we literally have hundreds of applications, and most of them were really good. It is hard to say “no thanks” to someone who is willing to stand up and take part in their community this way, but committees of 30 don’t work. Please apply again next year, as we are always trying to balance out experienced committee members with new brains to keep things fresh.
If you were named to ACTBiPed, Access Ability, the Electrical Commission, the Intelligent City Advisory Committee, I’ll see you at City Hall!
Recruitment 2019: Appointment of Council Representatives and Co-Chairs to 2019 Advisory Bodies of Council
This is some last-minute shuffles of Council Advisory Committee chairs and co-chairs, as the new Council figures out their schedules and attempts to find some kind of balance.
Recruitment 2019: Youth Advisory Committee (YAC) Rescindment
One of the appointments to the youth Advisory committee has to change, on account of the Terms of Reference.
Disposition of City Owned Lands: Road Allowances in the Queensborough Eastern Neighbourhood Node
The City is proposing to sell off two slices of roadway that are not, strictly, roadway, as they have never been opened up and paved and otherwise made road. These are both part of a larger vision for the Queensborough Triangle – a piece of land that has been under development review for a number of years. The City first advertised this land being potentially for sale through a public RFP in 2017, and staff entertained a few offers. They are now ready to move forward on the sale
2019 Community Grant Recommendations – Additional Information
Coming off of our approval of community grants, there were two items that were removed from the regular approval process to get more information about the applications and applicants. We moved the staff recommendations to provide some funds to a tumbling club, and to move New West TV to a different category and find a more appropriate way to support them.
2019 Festival Grant Recommendations
We spend a lot of money on Festivals in this City. But that said, the #1 positive thing people say about New West these days is that they love that so much is happening in this City. Every one of these Festival Grants is supporting a program or event that is primarily NOT run by the City, but by other organizations in the city, large and small. The City provides engineering and support services (though we need to account for them here as “in kind donations”), and we give a little bit of cash, concentrating the latter on supporting new up-and-coming events over more established events which we encourage to adopt more of an self-supporting model over time. Alas, New Westminster is a small City, and all of these organizers and events compete for limited sponsorship dollars.
Support festivals! Show up, spend money in their booths, send out social media messages about the event. And if you own a business, think about sponsoring the events that make New Westminster the funnest City in the lower mainland.
The following items were Removed from Consent for discussion:
Amendments to Economic Development Advisory Committee (EDAC) Terms of Reference
The Terms of Reference of the EDAC is being adjusted to make the committee work better in the context of the new Economic Development Plan for the City.
Bylaw Notice Enforcement Housekeeping Amendment Bylaw No. 7960, 2019 and New Municipal Ticket Information Bylaw No. 8077, 2019: Bylaws for Consideration of Three Readings
Included in this report is a bit of information about the two types of power our Bylaw Officers have: the Bylaw Offence Notice (BON) process which is limited to a $500 fine and is basically an in-house operation that is adjudicated at City Hall, and a Municipal Ticketing Information (MTI) process, which is adjudicated by the courts, but can include a fine up to $1000. The City almost exclusively uses the BON model since it was introduced to the City in 2009.
Every time we make and adjustment to a Bylaw that changes the type of offences or fines, we also need to amend the Bylaw that regulates these fines so the two are congruent. These amendments pile up to make the Bylaws unwieldy at times, and internal inconsistencies sneak in. So staff does these housekeeping edits to fix some of those inconsistencies.
While we are at it, we are boosting the fines for refusing to allow inspection of property (the cost of the City going to a Justice of the Peace to get an Entry Warrant is going up), and are adding Transit Police to our Bylaws to give them more flexibility to enforce City Bylaws around transit stations (i.e. smoking).
Happy to report we are also increasing fines for motorists that do things that impact pedestrian safety such as driving or stopping on a sidewalk or failing to yield for a pedestrian (which aligns well with our Master Transportation Plan). I support this move, but think we are actually not going far enough
[Trigger warning – War on Cars rhetoric coming!] According to the BC Injury Research and Prevention Unit, and corroborated by research out of the City of Vancouver, the #1 cause of pedestrian injury and death is vehicles failing to yield in a crosswalk where the pedestrian had the right of way. Pedestrian collisions result in more than 2,000 injuries and 50 deaths on average every year in BC – all of those preventable and the majority to no fault of the pedestrian. I think a $125 fine for this violation is not high enough, compared to a $200 fine for blocking traffic or for fixing your car while it is parked in front of your house. I also feel the fines for other significant pedestrian hazards, such as parking too close to a crosswalk or an intersection, are too low. As an aside, I also suggest the word “jaywalking” needs to be removed from our Bylaws. The term itself is pejorative towards vulnerable road users, and has racist and classist roots that do not fit well with modern thinking about the residents of our city.
I appreciate the changes being made, and supported the recommended changes. But I wanted Council and staff to recognize that one of my goals for this council term is to prioritize pedestrian safety through education and enforcement so we can meet the goals of the MTP. This will include review of enforcement activities and fines related directly to creating safer pedestrian spaces. [Off my soap box].
Official Community Plan Implementation: Work Program for endorsement
We want to do it all. New Westminster, despite our visions and dreams, is still a relatively small municipality, and we need to allocate and prioritize resources based on our relatively small tax base. This includes prioritizing the workload of our planning staff. It is a busy time in the city, the OCP implementation is coming along at the same time as we are pushing the envelope on rental protection and affordable housing and development is happening at a pace that requires careful review. This report is about our Planning staff setting priorities for their work plans for the next couple of years, and giving Council a change to weigh in on whether the priorities are aligned with Council’s expectations.
We ended up sending back this report with a few recommendations about what our priorities are, specifically some of the policy work around creating infill density guidelines for duplexes and triplexes was identified as something some on council don’t want to delay on. I was a little challenged, because setting priorities is hard, for staff and for Council, and we cannot afford to do it all. We are going through some strategic planning work on Council right now, setting goals for the term, so perhaps that process will help inform this a bit before it comes back to Council. But the question will ultimately be – do we do a little less, or do we add more resources?
Queen’s [sic] Park Traffic Calming Review
Our engineering staff do these neighbourhood-level traffic reviews on a regular rotating basis, and Queens Park (the neighbourhood, not Queen’s Park the Park) came up in 2017-2018. After public consultation, on-site analysis and data-gathering, more public meetings, and engineering analysis by an external consultant, some modest proposals are presented to help address what are, in the grand scheme of things, pretty modest traffic management issues.
Not surprisingly , the 85th percentile speed on some of the wider roads exceeds the posted speed limits.
I did raise some questions about whether road narrowing was considered in a few places where road widths are really wide (i.e. Second Street at Queens Ave is 18m wide – crazy wide for what is ostensibly a two-lane road), and though it may cost more than simply installing a 4-way stop, it may improve the pedestrian experience while adding to the “friction” of the road that results in lower travelling speeds.
There is also an interesting trial proposed here – closing the bottom of Park Row to deal with high speeds on that road, and a difficult intersection and pedestrian space where Second Road, Park Row and Royal Ave all meet. I generally like the idea, but recognize that the impact on local residents and on Bonson Road (which is really just an alley) will take some monitoring.
Among our Bylaw readings was Adoption of the following:
Engineering User Fees and Rates Amendment Bylaw No. 8080, 2019
This Bylaw that updates the fees we charge for various engineering fees was Adopted by Council. Consider yourself CPI updated.
Finally, we had a single piece of New Business:
Sanctuary City
Council agreed with Councillor Das’ motion asking staff to report back on the feasibility of establishing New Westminster as a Sanctuary city. This seems an easy and appropriate step towards making our City more inclusive.
That was the end of a long night, and I will follow up with a post about the Public Hearing.
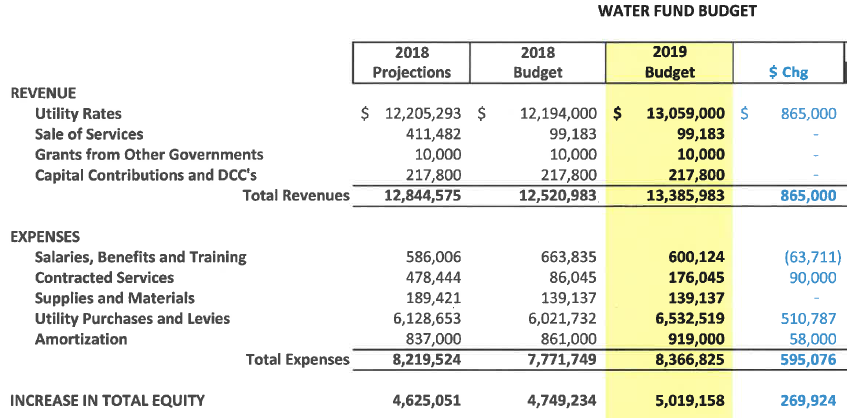
 Immediately, you will notice we are spending much more money (proportionally) on infrastructure here than in the water utility. This is largely due to the ongoing sewer separation work that New Westminster has to deal with. You can see it is almost all spent on actual infrastructure ($13 Million!). You will note also that the gap between what we are putting into reserves and taking out is large – about $2.7 Million in 2019. We are also expected to receive another $865K in grants to help pay close that gap. Again, more on this later.
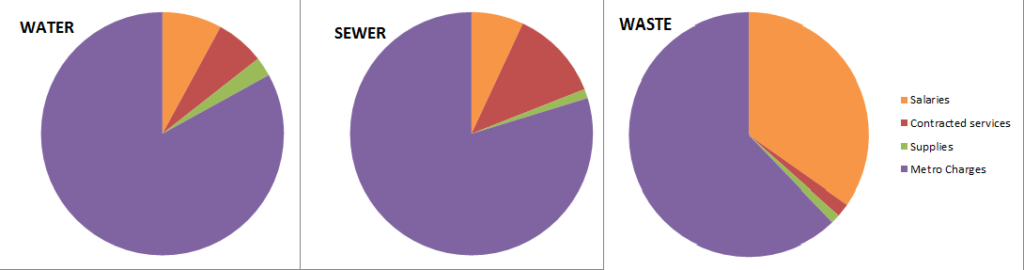
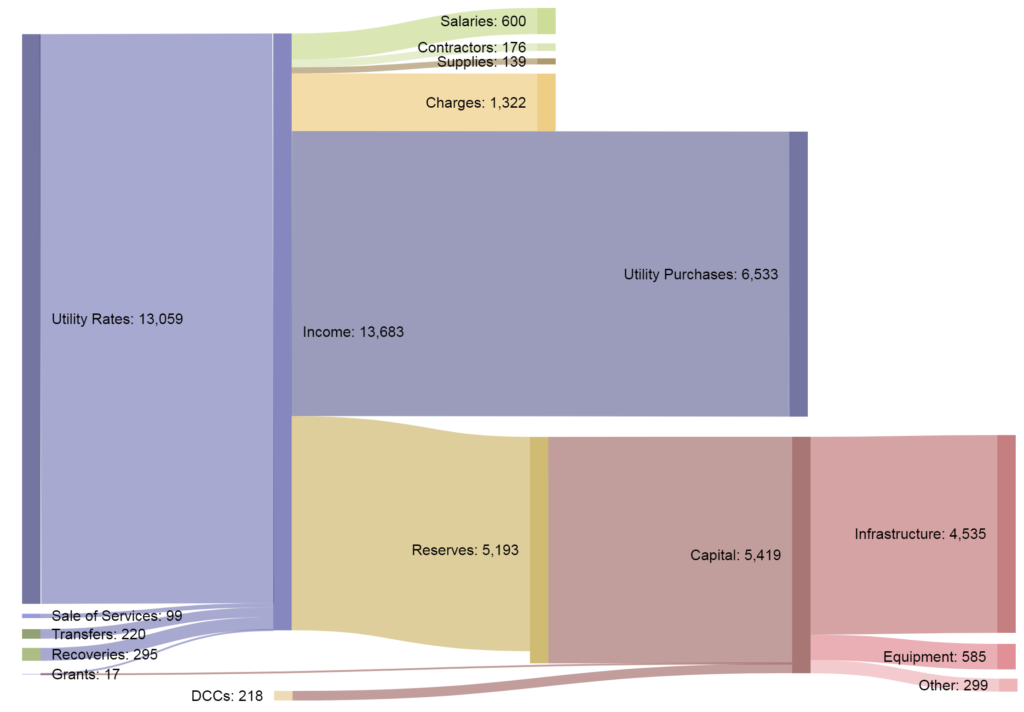
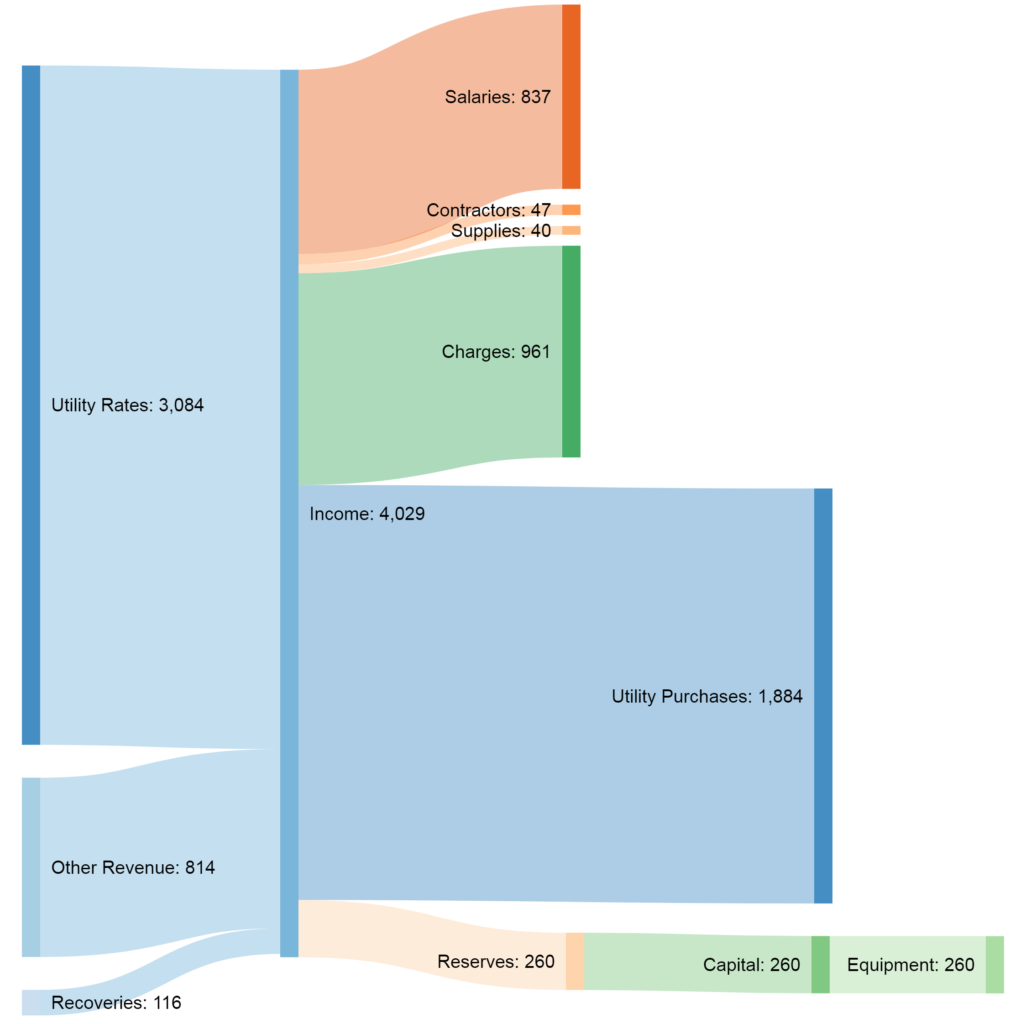 Two things stand out here: the capital budget is much smaller (it is all equipment), and both salaries and Charges is much bigger. This has to do with the nature of the work, collecting garbage requires people, and I suspect the largest “charges” expense is fuel to keep the garbage trucks rolling.
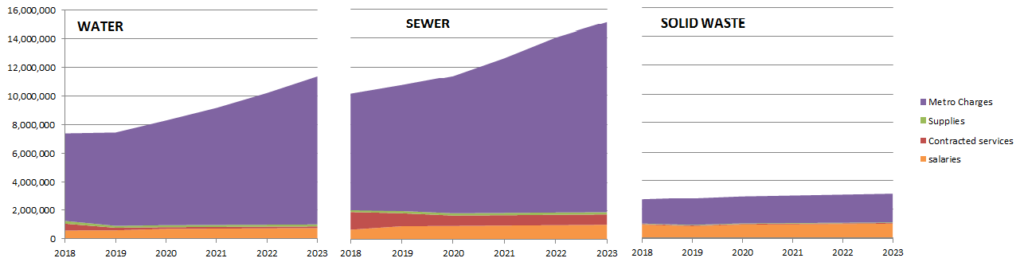
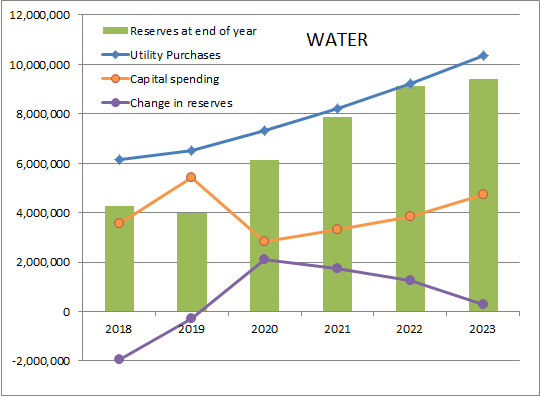 This graph shows how the main Water Utility cost drivers are going to change over the 5-year plan. The rates we pay to Metro for water going up steadily, capital spending increasing at a lower rate, and the trend for our reserves is moving from a small annual loss (remember the gap in the flow chart above) to an increase, then trending back to even. You can see by the green bars that our reserves are currently just over $4 Million, with the goal of them settling in at just under $10 million.
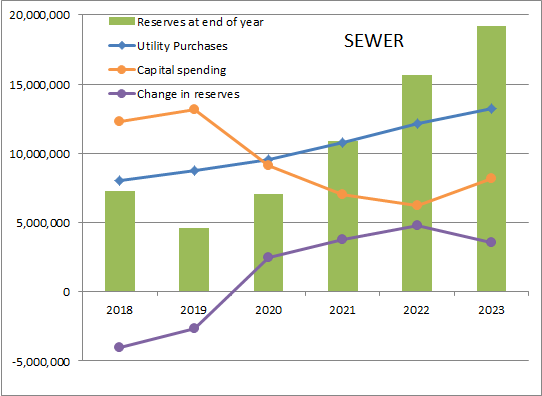 The same graph for the Sewer Utility shows Metro rates steadily increasing, capital spending going down, and our reserve contributions again going from negative to a more sustainable level.
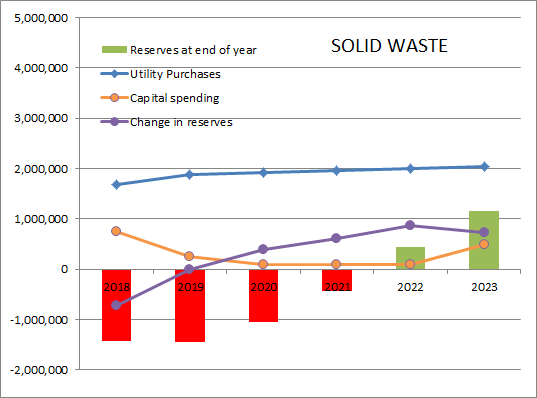 Finally, our Solid Waste accounts show Metro rates only increasing moderately, and our capital spending going down for a few years while the trend for reserves will hopefully go from a deficit position to a small positive reserve.