Doubling Down on Dumb Growth.

There was a meeting last week of the Province’s Cities: the Union of BC Municipalities annual conference. People who run cities get together to talk about innovations, ideas, problems, and solutions. Pretty much like any other “convention”, except that there is another aspect to the meeting. Cities also have the opportunity to communicate with the Provincial Government. This happens through closed-door meetings where Civic politicos or staff meet with Provincial Ministers and their staff to hash out issues of an intergovernmental nature; where the UBCM passes “resolutions” of their members to ask the Provincial Government to take action on some topic; and in the Provincial Government presenting speeches to the collected City folk, to tell them what great things the Province has in store for Municipalities.

This year, the Premier (whom I like to refer to as McSparklestm) gave the Keynote address, and as is typical, offered a number of baubles to Muni leaders to show that the Province cares about families cities.

For those of us living in the Metropola of Vancouva, there has been an awful lot of talk recently about the biggest challenge the region is facing: how to move people about. As the Biggest Bestest Bridge Ever is getting rolled out, our regional Transportation Authority is bleeding from the eyes. Such is the ongoing funding crisis at TransLink that they are cutting rationalizing bus service, hiring security guards to intimidate people away from overloaded night buses, scrapping plans to invest in expanded service, cutting their bike program, and will not even be able to drive buses over that shiny new bridge…

So I waited in a cat-like state of readiness anticipating that Premier was going to show a little leadership and give the Province’s biggest Cities the relief they have been waiting for – a new funding model for TransLink, a new Governance model for Translink, a new idea of some kind in regards to TransLink. Anything. Just deal with it.

However, the word “Transit” did not appear once in her Keynote Speech to the Province’s Municipal Leaders, just as the word Leadership rarely crosses her mind. Instead, she doubled-down on building up last century’s transportation infrastructure. She doubled-down on Bridges and Roads. She doubled-down on dumb.

How bad? Almost a billion dollars in road infrastructure spending, not including the $2 Billion or more that any eventual Deas/Massey Tunnel will cost. Not a penny for TransLink or transit anywhere in the Province. I’ve said this before, and I‘ll say it again: Dumb.

The Premier announced they are going to start planning for a replacement of the Deas/Massey Tunnel, hoping to have it completed “in 10 years”. She has no plan, doesn’t know what to build, doesn’t know what it will cost, doesn’t know if it will be tolled, doesn’t know anything- but she announced that it is time to start the conversation (recognizing she won’t be arond long to complete the conversation). She want to start the planning.

Here, I’ll save her some time. You are not twinning or expanding the tunnel. It may seem cheap and easy to toss a third tube down adjacent to existing ones, but it would be anything but. The infrastructure used to make and install the tunnel is long gone (the basin built for the purpose now a BC Ferries works dock just west of the tunnel), and the design from 1958 would surely not pass 2012 seismic standards, and dropping a third tube without disturbing the existing ones or the armor rock on them would be difficult.
Further, the tunnel is currently a limiting factor on ships traversing the Fraser River. Ocean-going cargo ships are restricted in draft on the River now by the clearance at the tunnel. The Panamax Tankers envisioned for the Vancouver Airport Fuel Delivery Project could not reach their terminal unless they are less than 80% laden, and even then only at high tide. If the Federal Government are going to agree to any Deas Island crossing (and they will have to as per the Navigable Waters Protection Act), they will no doubt insist on a bridge to open up PortMetroVancouver to more flexible freight movement on the River. Any “upgrade” here will involve the removal of the Deas/Massey Tunnel, full stop.

There is also no chance of a bored tunnel (as the Canada Line takes under False Creek) working in this location. The geology there is loose river sediment at least 500m down – making it like tunnelling through jello: a geotechnical nightmare.

So it will be a bridge. If near the same location as the tunnel (as would be required to fit Highway 99, we are looking at a 800-m long main span, similar to the Pattullo Bridge, but built on technically challenging foundations due to the loose sediment. Any other location (to the east, as there is no way Richmond will be ploughing neighbourhoods to allow the bridge to move west) will mean a longer span and lesser connection to Highway 99.

But how big? The new bridge will need to be larger than the current 4 lanes to meet Premier McSparklestm 1950’s mindset that the “congestion problem” in Delta can be solved with new highway lanes. As the counter-flow system currently has three lanes with Rush Hour flow, a 6-lane bridge will also likely not be up to the task…. will 8 be enough?

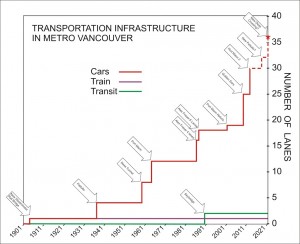
For the sake of argument, let’s say the Deas/Massey Tunnel is replaced with a 8-lane bridge, just slightly ahead of the Premier’s 2022 deadline, to align with the Province’s and MetroVancouver’s growth predictions for 2021. Also presume that the current funding stranglehold doesn’t scupper TransLink’s planned 6-lane Pattullo replacement, the exponential growth of traffic lanes across the River is pretty clear:

Just between 2000 and 2021, the number of road lanes crossing the Fraser River within MetroVancouver would double from 18 to 36 with not a single increase in rail or transit capacity crossing the river in the same time.

The real economic choke point in the crossing of the Fraser is the 100-year old New Westminster Rail Bridge, with its single rail line being that flat purple line on the graph. TransLink forecasts big increases in Transit ridership across the River (well, it used to, it is unsure how the current funding crunch will impact these projections), but is currently operating the only two lanes of rapid transit (Skybridge is green line) at near capacity, will not have the money to even put buses on the World’s Widest Bridge, which will have 10 lanes, but not one of them dedicated to transit. Dumb.

This is the real story behind the TransLink “Funding Crisis”. $5Billion spent on roads and bridges in the last decade, and Billions more to come. All this while car use is declining, and our existing transit system is hopelessly overcrowdedThe last comprehensive study of Traffic at the Deas/Massey Tunnel demonstrated that traffic through the Tube declined more than 7% over the 5 years, while people taking transit over the same time went up over 8% in the same period. This is not about capacity issues- this is about entrenching the building of car-oriented neighbourhoods in Langley, Surrey and Delta. This is threatening our livable region strategy, it will continue to threaten ALR land and our airshed. We cannot possibly hope to reduce our Greenhouse Gas emissions, to become food or energy independent. 

The worst part of the Surrey Leader story? The Vice-Chair of TransLink (who happens to be Mayor of the City with the greatest proportion of car users in the region) calling it “a great announcement”, while the only quote from the NDP opposition seems to be critical that the tunnel can’t be replaced sooner. There is plenty of dumb to go around here.
Upcoming things – Seeing into your Future

My schedule is stuffed full for the next little while, so let me just send a shout-out to these three upcoming events. I ask that you, instead of sitting there reading my tripe, go out and do something.

Or, more specifically, do these three things:

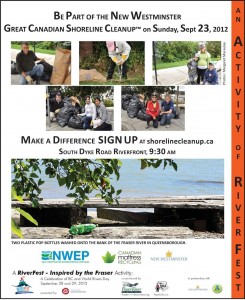
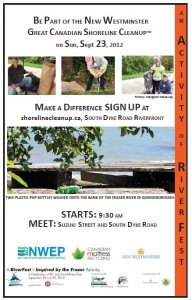
This Sunday is not just my Mom’s birthday (Hi Mom!), it is also the day of the Annual Great Canadian Shoreline Cleanup- New Westminster edition. It will be a nice sunny morning, so get some friends and/or family together and spend an hour or two in the morning doing something good for the community while getting some fresh air and enjoying the unique Queensborough waterfront:

The Shoreline Cleanup is part of Fraser River Fest, as is the River Day Celebration the following Saturday (September 29th) . There will be screenings at the theatre in the Fraser River Discovery Centre, music on the outdoor stage, booths, displays, and other activities: all oriented towards getting the community connected to the River that Runs Through. As good a Saturday as any to hang around the River Market and Quayside Boardwalk.

Finally, (putting my Tony Antonius hat on) its time to start the music, its time to light the lights, its time to get things started for the New West Doc Fest next month. (That’s is why Tony is a Poet, and I’m a blogger – right there, folks. )

The second annual Documentary Film Fest will be building on last year’s success – with a great selection of movies, music and other entertainment. The Film List fits the overall theme of “sustainability”, but with an emphasis on Social issues, from an intriguing look at the lives of young Indian women facing different forms of “cultural indoctrination”, to a deep look into “gamer” culture, and controversial movie about the making of a controversial movie about a controversial topic, and the controversy that ensues.

Tickets aren’t available quite yet, nor is the complete list of shorts and other entertainment (although the guest speaker list is starting looking interesting!) but save the date – October 19th & 20th.

The Transportation System is Broken

Two remarkable transportation stories hit the media this week, but few people have mentioned that they are connected at the hip.

Story #1: The ongoing crisis with public transportation in Vancouver has reached a new low.

Frustrated transit users are being left behind as demand continues to increase, and TransLink cannot afford to even maintain existing levels of service. Anyone trying to catch a 145 to SFU in the morning or a westbound 99 B-line pretty much any time of day know the system is broken.

Now increasing numbers of people, enjoying our revitalized Downtown (which is finally shucking the “No-Fun-City” reputation) while responsibly avoiding drinking-and-driving, find they cannot get out of downtown after Transit effectively shuts down at 1:00am. There is no budget to increase the number of NightBusses that are leaving people standing on the street at 2:00am, so TransLink is instead hiring Security Guards to manage the pissed-off customers!

Get that straight, the regional Transit System is so failing at its mandate, it has to hire security to beat the customers away from using their service.
On what planet is that a rational situation?

Story #2: The protracted opening of the new Port Mann Bridge is starting.

First, the announcement that tolls for the bridge will be cut in half until after the election, then that there will be no tolls for the first week (reinforcing the message that car dependency is like any other addiction – freebees help get your customers hooked!) , then the snap announcement that EastBound lanes will be opened (today), relatively bereft of fanfare, it was more likely a hasty response to a bit of poor planning yesterday that resulted in temporary traffic chaos (which should be differentiated from the permanent traffic chaos that will result from this entire project)

The missing context is how these two stories are really just one story. The Province and Feds are saying they cannot possibly afford to provide a couple of hundred million dollars to support the continued operation of a Transportation System that is bursting at its seams from overuse, so the Cities like Burnaby and Vancouver are going to have to buck up and find other solutions on their own dime. At the same time, the Feds and the Province are blowing somewhere north of $5 Billion building a transportation system that few people outside of Langley and Surrey want.

The tolls on the Port Mann are not going to pay for the Bridge (see this year’s projected $38 Million shortfall on the Golden Ears), and they are not even intended to pay for the 37 Kilometres of Freeway expansion from Grandview to 200th Street, or the dozen interchanges that are being stripped down and replaced. They are also not going to pay for the South Fraser Perimeter Road, or the Pitt River Bridge Replacement, the spectacular expansion of Lougheed Highway through Coquitlam Big-Box Hell (with concomitant King Edward Overpass).

Strange that after all the money spent on these roads, it is the Provincial contribution to the Rapid Bus Service that is only part of the project that has not barged ahead, costs be damned!

Yet the first opening day for the Bridge- the centrepiece of the most expansive roadbuilding project the Province’s history – was overshadowed on the front page of the Province by some sort of alleged taxpayer revolt over TransLink’s request for a little more money to keep operating the only alternative to more freeways. The biggest news in the Minister of Transportation’s home riding is that they may have to pay $2 to park their car all day in a park-and-ride to catch the Rapid Bus their MLA refuses to allocate the funds to operate!

These are twisted times, my friends.

As much as I may have questioned TransLink’s motivations in the past, I am starting to feel sorry for them, because none of this is their own doing.

I am convinced TransLink would rather provide enough NightBusses to get people safely home from Downtown at night, and not have to hire extra security to scare off potential fare-payers. I am positive TransLink would love to have an efficient and reliable RapidBus service to get people from Langley to Downtown in a reasonable time. I am sure TransLink would have rather have invested $150Million in service improvements than be forced to waste that amount on FalconGates that will not even address the alleged Fare Evasion “problem” on the system.

I am also sure that given a stable funding source, and a governance model free of political interference, TransLink would be able to achieve the goals they set for themselves in the Transport2040 plan. They would be fulfilling their mandate under the Livable Region Strategy. They would be able to deliver decent service and adapt to changes in how people use Transit. Instead, they are sitting outside a SkyTrain Station, hat in hand, looking for enough money to get their next fix, hoping the Transit Cops don’t shoo them away, while Elected Officials biker over which form of tax is most “appropriate”.

As it is now, the entire system is broken. Road lanes are being built, bus service is being cut. The entire $5Billion Gateway program was announced, designed, built and brought onstream in a little over 7 years, meanwhile it has been 15 Years since a Rapid Transit Line to the Northeast Sector was announced, and there are no signs of an Evergreen running any time soon, never mind Rapid Transit expansion on the Broadway Corridor or South of the Fraser.

The saddest part is the lost opportunity. During the Olympics, MetroVancouver proved what could be done: we could move a huge number of confused, lost, (and commonly drunk) people cheaply and efficiently even as we were reducing road space for cars. At the time, it was seen as a vision for the future, the model being proven that it can work. We had the momentum, but we lost it.

That lost opportunity, not some shiny new bridge looming like the Sword of Damocles over Coquitlam, will be Kevin Falcon’s legacy.

The Next Federal Election, and what should be.

Not long after writing this post, I was made aware of this website.

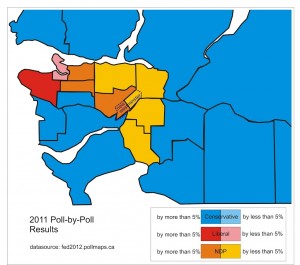
The idea is simple: they took poll-by-poll results from the last two elections and re-ran the elections with the new Electoral Districts being proposed across Canada. The results locally are interesting.

Here are the existing ridings for the Lower Mainland, and the results from the 2011 Federal election. I shaded ridings by winning Party, dark if they won handily, and pale if the Party won a close one (“close” I arbitrarily set at a 5% lead over the next closest rival, which is pretty much within pre-election polling error).

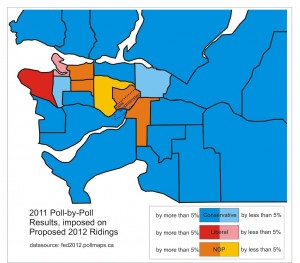
And here is the same area, with the proposed riding boundaries for the next Federal Election, and how the 2011 election would have ended, assuming everyone voted for the same party, regardless of the newly-drawn riding boundaries:

Remember, this reflects exactly the same number of voters, and exactly the same votes: so no change at all in the percentage of popular vote for any party. What does change is who goes to Ottawa.

With the existing boundaries, MetroVancouver will be represented by 11 CPC, 7 NDP, and 2 LPC MPs. With the proposed boundaries, the same area will be represented by 17 CPC, 5 NDP, and 2 LPC MPs. Exactly the same votes, and the result sees the Conservatives gain 6 seats, the NDP lose two. Are we supposed to believe this is a coincidence?

There are a couple of caveats that should be acknowledged when looking at this data.

This revised data is useful mostly in the extreme case: it is highly unlikely that the 3,000 votes in NDP-leaning Queensborough will have any influence on the 30,000 votes in Conservative-dominated Richmond once the two are put in the same riding. You can see this in complete lack of change “around the edge” of the map, where solid Conservative leads would not be threatened by any change in boundaries, and the East Side of Vancouver will always be NDP.

However, what the impact on the old New Westminster-Coquitlam riding is less certain. According to last election’s poll-by-poll results, the new riding of Port Moody – Coquitlam the loss of the strong-NDP Sapperton polls would hurt Fin Donnelly much more than the loss of Conservative-friendly Queens Park polls, and the Conservative-leaning Coquitlam vote would swing the riding to that party by the thinnest of margins- about 0.95%, or less than 400 votes.

This brings up the bigger supposition: that people vote strictly along party lines, and those party lines never shift. We know that isn’t true for much of the population. Fin Donnelly is a great NDP Candidate, and appealed to a lot of people in Conservative-leaning areas, just as Diana Dilworth appealed to many people in NDP-leaning areas. Fin now has real incumbency behind him, the NDP are gaining in the polls, and there is no guarantee that Dilworth will run again, Fin could still win the new Coquitlam-Port Moody riding, or a “Star Candidate” for the Conservatives could win by more than the thin margin above. Candidates and Pary matter: which is why a distribution that doesn’t fairly represent the popular vote is such a problem. 

This may sound like an NDP partisan whinge, but if there is one thing upon which we should all agree it is that we want the representation in Ottawa to represent, as best as possible, the popular vote. That is the fundamental basis for Representative Democracy, and the entire purpose of this Electoral District Redistribution: to adapt the House of Commons to the growing and shifting population. The Growth of Greater Vancouver means we are getting 4 more seats. However, if we want to fairly represent this population, how should those seats be distributed?

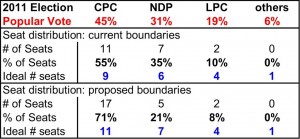
Look at this table I made, again of data from the PollMaps database:

For the combined 20 ridings in the above maps, the popular vote in the 2011 election was 45% for the Conservatives, 31% for the NDP, 19% for the Liberals, and the Greens an everyone else split the other 6% of the vote.

That resulted in 11 seats for the CPC (55% of the total seats available), 7 for the NDP (35%), 2 for the Liberals (10%), and none for anyone else. The Blue numbers are the number of seats each party should have got, based on a distribution of seats that matches their popular vote. Overall, the distribution was not perfect, but in the grand scheme, it wasn’t too bad for a first-past-the-post system.

Now look at the proposed boundaries data. Ideally, redistribution should push us towards the ideal here. Instead, the over-representation of the Conservatives get bigger (71% of seats from 45% of the vote!), while the NDP and Liberals get less representation and the situation for the other parties doesn’t change. All of the extra seats go the party that is already overrepresented, plus seats stripped from a party already under-represented, while doing nothing to help the other under-represented parties!

This is an opportunity lost. With proportional representation in European model, those 4 new seats could be reserved for representatives from parties that are underrepresented.

The Conservatives can keep their 11 seats: the number out of 20 that they won, and the number out of 24 that represents their popular vote.

The NDP keep their 7 seats (well, lose one, but are granted a “proportional seat” for no net gain): this is one more than they won out of 20, but fairly represents the number out of 24 that represents their popular vote.

The Liberals keep their 2 seats, and are granted 2 “proportional seats” to bring heir total to 4: the number out of 24 that represents their popular vote.

The final proportional seat is given to the Green party, as out of the 6% “others”, about 80% of that was for the Greens, meaning 5% of the total popular vote.

This way, we meet the “ideal” number of seats, as per popular vote. Of course, this is a local example, but the same results can be drawn at the Provincial Level, and at the National level. All it would take is the wholesale re-writing of the Canadian Constitution and Parliamentary system. We have three years until the next election, let’s get started!

Shoreline Cleanup – a good news story.

I noticed this blog has been full of bummers and whinging lately (“lately?”), so I wanted to give a shout-out to a good news story here in New West.

The Great Canadian Shoreline Cleanup is an annual nation-wide event, where various volunteer groups adopt a stretch of shoreline near their homes and (as the name suggests) clean them up. There have been off-and-on shoreline cleanups in New West, mostly organized by Scouts or Businesses, but last year was the first NWEP-sponsored “public” clean-up. You didn’t need to belong to a club or a business, or even the NWEP:  it was just a drop-in on a Saturday. It was organized with remarkable fervour by NWEP member Karla Olson.

The stretch of shoreline chosen for cleanup was the recently-refurbished stretch of South Dyke Road between the Boundary Road and Derwent Way, in sunny Queensborough. The stretch of shore has a combination of multi-use paths, dock features, and walking trails that make the most of the waterfront, so keeping it clean seemed like a great community-building idea for the relatively new neighbourhoods in southern Queensborough.

Last year, there was a bit of a panic, as it seemed there wasn’t really all that much trash – so Karla was a little concerned her volunteers would make the effort to show up, and have little to do – so she added a small invasive plant pull at the same time. A patch of Japanese Knotweed was crowding out native plantings by one of seating areas, and a patch of English Ivy was threatening to choke out a Douglas Fir right on the waterfront. With some help from the City on New Westminster and a volunteer expert on invasive plant management (who happens to be married to the new Royal City Farmers Market Operations Manager), a plant pull and disposal was organized.

Turns out, litter is the kind of thing that surprises you once you start collecting it. Karla’s fear (optimism? ) was unrealized and the volunteers who showed up collected an ample amount of trash. They also took a real bite out of the Japanese Knotweed patch and the English Ivy climbing the tree. Karla’s organization skills came to the fore, the 30-odd volunteers had a great time, and made a difference in the local community.

This year, the Shoreline Cleanup is back for more on September 23rd. With more people using the waterfront trails, and lots of jetsam brought to shore by the high freshet this spring, the (now annual) event will probably see more trash this year than last. They are also hoping to see more volunteers as well – which is why the “Invasive Plant Pull” part of the program is expanded this year.

If you haven’t been involved in a plant pull before, here is the quick background. There are several species of plants considered “invasive” in BC- not just because they come from other continents, but because they are safe from their natural emnemies (predators, insects, weather) and without these controls, they can take off – even displacing the native plants and threaten the native habitats of plants, bugs, birds and other animals. Most are bought as ornamental plants, and go “feral” when someone throws yardwaste or plant pots into the woods – to “give the plants their freedom”.

A “Feral Potted Plant” found on South Syke Road during plant tagging.

During last week’s invasive tagging event, we found lots of morning glory , some wrapping itself around and choking out native snowberry plantings; a couple of Scotch Broom plants; resdiual English Ivy from last year’s pull; and English Holly, which is merry at Christmas, but invasive in the wild, displacing the similar but native Oregon Grape. All of these will be targeted during the plant pull part ofthe Shoreline Cleanup.

The Japanese Knotweed that was knocked back last year has started to come back, but now that it its weakened, the City can come back and do stem injection to kill off the remainders, before the roots undermine the dike. And then there is the Himalayan Blackberry, a nasty (but tasty!) invasive that has become so ubiquitous, that eradication seems a distant dream. It is also a mean, spikey plant that is probably best managed by people wearing thick clothing and safety glasses.

So if you want to help out for an hour or two, you can collect trash, or you can get a little bit more involved taking out some invasive plants – you might even learn a bit about what plants are native and which are invasive – once you can identify a few species, you start seeing them in other places. Most importantly, you can meet some people in the community interested in protecting the shoreline, and be part of a nation-wide campaign.

No pressure, no long-term commitment, just a family-friendly day helping out in the community.

It’s best if you sign up ahead of time, by clicking here. you can also just show up, but if you bring the kids or are under 19 yourself, you need a waiver signed by a Parent or Guardian, which you might want to get done ahead of time (you can get the waiver on the website, and bring it with you).

The shoreline is muddy at low tide, so you might want to wear boots or rugged footwear. Long sleeves and pants are a good idea for pulling invasives and for picking up trash (the City of New West will provide gloves for voulunteers – but you can bring your own), and there will be a few tools available, but feel free to bring your own clippers, loppers, garbage pickers, etc. Bring some water and snacks, as the event will probably go on for a couple of hours – just remember to pack out your wrappers!

The Event is on September 23 , starting at 9:30 AM. Folks will meet on South Dyke Road, near where Suzuki Street meets it – you should see the tents there, a couple of blocks east of Boundary Road, as far south-west in New Westminster as you can be!

He’s a Fletcher, but he’s no Fletch

I loved Fletch – the books and the movies. The books were darker and more cynical than the Chevy Chase vehicle, but I thought Chevy did his best work in the first Fletch. So please accept that my fandom may colour comparison of the investigative reporting skills of the fictional Irwin M. Fletcher with the hackneyed opinion making of BC’s own Tom Fletcher.

The columnist for Black Newspapers is predictably right-of-centre and comes from a free-enterprise-uber-alles all-government-are-clowns viewpoint. No problem with that, people have opinions, and I don’t expect everyone to agree (look at some of the crap I write – if you don’t disagree with me sometimes you just aren’t thinking!), but I’m a local blogger, he is a regionally syndicated Professional Journalist.

His recent column in the print version of the NewsLeader (and syndicated Province-wide) shows that he isn’t a very good one. I wanted to go through line-by-line and talk about the hundred types of wrong in this column (“Robert Redford!?”), but it just got too deep and too boring, even for me. So this long post is a few thousand words short of where it should be. You get what you pay for.

In this column, the estimable Mr. Fletcher attempts to fix some of the “ignorance” he has seen and heard in discussions questioning merits of Oil Pipelines. These misconceptions are being “exploited by some opponents”, and he wants to set the record straight.

Fact checking is an important part of the profession of Journalism, so we should thank him for his efforts.

Except that he gets pretty much everything from that point forward wrong. Not just the facts, but the part about being a professional Journalist.

Again, I don’t want to go through this line-by-line, but let’s take the major premise of the first half of his column – oil pollution ain’t so bad – and do a little fact-checking.

“A global study by the Smithsonian Institution in 1995 calculated the amount of oil making its way into oceans this way: Big tanker spills accounted for 37 million gallons a year, about five per cent of the total marine oil pollution identified.

“By far the largest source was oil runoff from land into drains, from oil changes, municipal and industrial wastes and other sources: 363 million gallons. Bilge cleaning and other routine ship maintenance added 137 million gallons, four times the tanker spill average.

“Air pollution from vehicles and industry deposited hydrocarbon particles equal to another 97 million gallons; natural seeps added 62 million gallons; offshore drilling discharges accounted for 15 million gallons.”

It’s nice that Fletcher gave us a reference, a global study by the Smithsonian Institution published in 1995 should be easy to find. It also tells us where he might have got the information from. Presuming Tom gets his “information” from the Internets, he might have picked it up from here or here. Or, even more likely, he got it directly from his buddies inside the BC Government.

Notably, that’s not where the actual data came from. The citation the BC Government provides does not link to any Global Study, as no such study was performed by the Smithsonian. Or anyone else in 1995 for that matter. The numbers come from a 1995 travelling science exhibit put together by the Smithsonian to teach about Ocean Ecology.

I’m not sure how many oil-industry spin cycles this dataset went through before Tom pulled it out and hung it on the line (and, problematically, neither does Tom), but hey, he’s a Professional Journalist – and it would have required a few more Google clicks to look for the original Smithsonian display text, and follow their citation

“National Research Council (2002) Oil in the Sea: Inputs, Fates and Effects. Washington, D.C: National Academy Press, May.”

Now we are getting somewhere. The National Research Council is a public research body, so the source of the data is available on-line, and we can assess the quality of the data (you know, Tom, like real reporters do). We find that there is no actual report that fits the above citation perfectly. There is a 2003 report by the NRC called “Oil in the Sea III: Inputs Fates and Effects”, which is pretty close:

“Oil in the Sea III: Inputs Fates and Effects, 2003”

It would be hard for a 1995 travelling science show to cite a 2003 paper, even with the Smithsonian’s money, so we need to go back to the older report “Oil in the Sea: Inputs Fates and Effects” done in 1985, which is also available here:

“Oil in the Sea: Inputs Fates and Effects” 1985

You can read the whole thing (it is interesting!) but maybe for the purposes of this post, just skip to the table on page 82, which lists estimates of Global input of hydrocarbons into the oceans. This looks good.

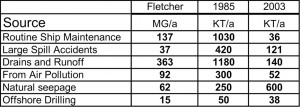
Also notice the text around the report about the meanings of each of the inputs, you really need to spend a few minutes putting this study into context. Then look at the similar table in the 2003 report I linked to above (the table is on page 69) – and note the long discussion about how far off the 1985 estimates were, and for what reasons. I put together this handy table so you can compare the numbers Tom chose to hinge his entire argument on, with actual data from which he allegedly got his numbers.

“Fletcher” are the numbers Tom regurgitated uncritically
“1985” are the best estimates from the 1983 report, converted from million tonnes to kilotonnes.
“2003” are the “best estimates” for global inputs from that report.

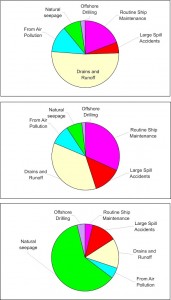
It doesn’t matter that the figures are in different units (Millions of Gallons versus kilotonnes), because his argument hinges on comparisons of oil spills with other inputs, so I decided not to do the conversions so I won’t be accused of misquoting the tables or cookingthe books. You can still compare the three sets of numbers on piecharts:

You can see there are three very different datasets. Which do you have the most faith in? The most recent study that built on the older study while acknowledging the flaws, or the random numbers presented by well-meaning science educators in 1995 from an flawed at-that-time 10-year old study? Which set of numbers did Tom run with? If you were a Professional Journalist, which would you use in order to address “misconceptions” that are creeping in to the Pipeline debate?

You may ask “So what? Who cares if his data is shit?”

I would say that even if it weren’t built on crappy data – his argument is flawed! The data is almost 30 years old, so the “oil runoff from land into drains” in the 1985 report included industrial waste runoff – primarily from petrochemical industries – and other waste streams from operations that are clearly not done by “you and me”. These are coming from things like oil terminals and refineries similar to the one his boss wants to build. I’m not sure how making statements like “Bilge cleaning and other routine ship maintenance added 137 million gallons, four times the tanker spill average” is supposed to endear us to having a tanker terminal on BC’s Northwest coast – why worry about a spill if bilge cleaning will cause more oil pollution!?!

This is also built on the premise that a little bit of oil spilled into a thousand small streams will have the same impact as millions of litres of oil spilled into one estuary. This is simply false. The impact of a single spill event can be catastrophic, and the minuscule amount of hydrocarbons in street run-off is less than optimal, but is generally metabolized and dissipated on the ocean before it can have harmful effects on the ecosystem.

I’m not minimizing the problem – Municipal runoff is generally bad stuff with trace levels of metals and hydrocarbons – but through significant changes since that 1985 report (oil and oil filter recycling programs, oil-water separator systems in storm drains, AirCare and similar emissions testing programs that remove unburned hydrocarbons from exhaust, standardization of dry-clean-up methods in the automotive repair industry, Laws regulating the handling and disposal of dry-cleaning solvents, etc. etc.) the situation in 2012 is way better than it was. I digress.

Admittedly, this is not an Investigative Journalism piece- it is an opinion column. So maybe I expect too much of a Professional Journalist writing an opinion piece to spend 5 minutes on Google to see if his data is correct (because that is how long it took me to collect the data above and demonstrate that his data is crap).

I fear somewhat that it is the data being used in a technical memorandum prepared by the BC Government, but that’s an entire other blog post.

I am going to give Fletcher the benefit of Hanlons Razor, and assume he is an incompetent and lazy journalist, and not intentionally using crappy data because it better makes the point of his “opinion”. Incompetent or lying, it hardly makes a difference, I’m not sure why Fletcher’s opinion is something anyone would find worth reading.

PS: By the way, “Cambridge Energy Research Associates” is not associated with Cambridge: the university or any of the universities based in Cambridge, Mass. It is the “energy market consulting” wing of the publicly traded industry publishing corporation “Information Handling Services”, or “IHS Inc”. It doesn’t take long on their website to see who butters their toast. And the study to which he refers “Oil Sands, Greenhouse Gases, and European Supply: Getting the Numbers Right” does not actually agree with the numbers Tom provides in his column. Those numbers are actually from page 6 of a recent Shell Oil pamphlet talking about how great Bitumen Sands are, which in turn cites the CERA… Yep, he did it again.

Hanlon’s Razor is looking pretty dull these days.

Shaking my Fist from my Pier Park Porch Swing

Seems I haven’t been talking about New West that much recently, so here is a viciously local issue that was brought up to me last week., via the Twitter.

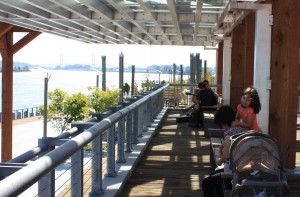
The new Westminster Pier Park is a little more than 2 months from opening day, and so far so good. Rave reviews are coming in, despite a slightly embarrassing lack of spell-checking at the steel plant, and less-than-ideal access, which will soon be improved. I have yet to hear a negative review. Then I went down on Labour day and saw literally hundreds of people over a few hours coming and going, sun tanning on the grass, people connecting their Quayside walks, and kids on the playgrounds.

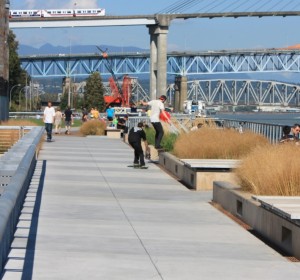
And then there were the skateboarders.

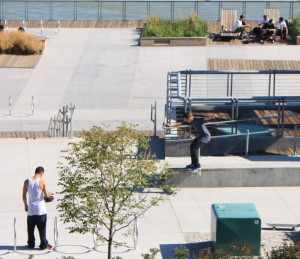
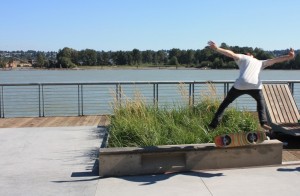
Now I am not going to be that guy – just trying to bring the dudes down – but I guess I am now old enough to complain that the noise and the impact of a few young kids on skateboards disrupted an otherwise peaceful, pleasant park. Except there weren’t just a few of them (there was at least two dozen), and they weren’t kids (I peg the average age in the mid 20s). Excuse me a minute while I shake my metaphorical fist from my metaphorical porch swing – I’m going somewhere here.

They were also comfortable enough to afford beer and video equipment. Yes, they were video recording things. At least three separate cameras on site, being filmed by each other doing slides and grinds along anything concrete. Not on iPhones, mind you, but full-on Sony digital video cameras. No doubt to be dubbed to music and posted on YouTube.

Kids today…

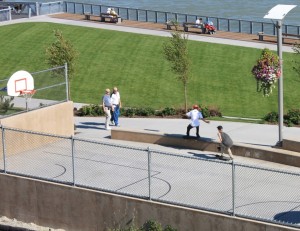
The situation at the basketball court was pretty funny- as the crowd of a dozen or so guys had organized into what I can only describe as a hockey-style drill: lining up along the wall behind one net while they took turns, one at a time, sliding the concrete step at the opposite end of the court, while one guy took the occasional video recording from his own slow-moving deck. It had all the aesthetic flow of a Pee-Wee hockey team pre-game drill. Passing seniors were less excited.

Except way louder. Big kids slamming boards against concrete and asphalt gets pretty loud. It is a jarring, violent sound in the middle of a park where other people were picnicking, walking, playing on swings, or even playing guitar. When they do it for hours on end 5 feet from your lounge chair, it can kind of ruin the entire waterfront-park aesthetic.

However, the noise is not my biggest concern. That would be the damage that is already apparent on some of the concrete structures at the Park.

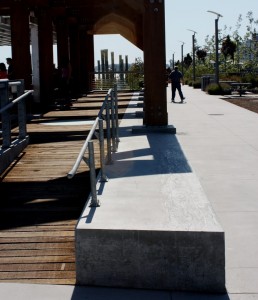
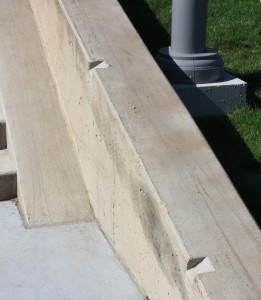
Most concrete structures these days are built with some sort of anti-skateboard technology. There is a whole industry involved in designing concrete surfaces to not become skateboard-attractants. At the Pier Park, they too one of the most passive approaches: small dents every few feet on concrete ledges.

Clearly it isn’t working. Only two months after opening, the concrete is chipped and broken in areas, and there is significant ground metal/board wax staining on “grind” areas. I can’t imagine what it will look like after a few years. (notably, the concrete stair on the edge of the basketball court is lined with a steel rail to protect the concrete and facilitate “grinding” – as the Urban Dictionary tells me the kids say).

So what are the alternatives? There are already two established skate parks in New Westminster. The brand new one in Queensborough came at significant cost to the City, and is a pretty big facility with a huge variety of riding options. Unfortunately, the old bowl adjacent to Mercer Stadium is a little old, a little decrepit, and likely bound for destruction when the new School is built.

Neither of these location are where the new population centres of the City are. Maybe it is time to build a new park?
I’m not a skateboarder, never have been, but I can see it as a sport that gives youth (and increasingly, adults) a physical and creative outlet: this is something we need to be encouraging in the City, and not discouraging with arbitrary rules. However, when any one user group (be they skateboarders, firearms enthusiasts, equestrians or performance artists) disrupts the enjoyment of public facilities for other users, and damages the physical infrastructure built by the City while doing it, we need to find a way to mitigate those physical impacts. We live in a society, and that’s what societies do.

Here are two quick proposals:

1) Build some temporary skate-friendly structures on the asphalt part of the Pier Park. That asphalt is not being used now in any way that would change if a few jersey barriers, concrete blocks, or whatever the kids are “grinding”, “sliding”, and “ollying” today, were installed for the skaters to use and abuse at their leisure. It isn’t as good as a full skate park, but it is better for everyone than the structures being abused now; or

2) Do the same thing on something like 1/8th of the current Waterfront Parkade: those wide-open expanses of elevated concrete that are currently abandoned even on the busiest days of downtown businesses. Let’s put the white elephant to some practical use as a temporary measure until a longer-term solution can be found.

Ultimately, we need to find a longer-term positive solution, past installing “no skateboarding signs” at the new Pier Park. But let’s install the signs in the meantime, and get some Bylaw enforcement down there, just to stem the tide of the damage before repair costs get out of hand…

Bicycle Lane Obstacle Course #4

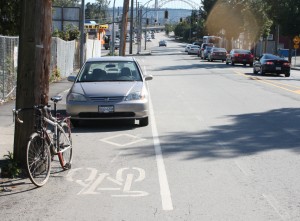
On Labour Day, I rode my bike along the Central Valley Greenway, one of the premier regional bike routes.

Also a good place to park.

Its not like the driver couldn’t see the diamond or the bike symbol. What made them think this was a parking spot?

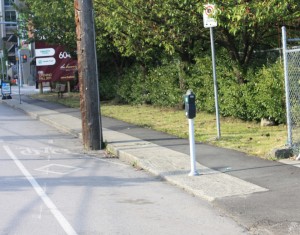
Possibly because it used to be a parking spot. It has been part of the CVG since the bike route opened more than three years ago to much fanfare. However, up until a few months ago the very spot this car is parked looked like this:

Yes. That is an operating parking meter. There were about a half dozen of them along the bike lane on Sapperton. In defence of the City’s Transportation guys, once this was brought to their attention, they took the meters out pretty quick (there are meter-stumps there now). So I guess Mr. Civic Driver figured it was now free parking. Bonus!

I am just confused that the fact there were parking meters on a bike lane had to be brought to the attention of the Transportation Staff three years after the bike lane opened. I mean, did the guys painting the lanes not notice the meters? Did the Meter Collector not notice the lane paintings? Did no-one working for the City put two and two together?

Thousands of cyclists must have ridden by parked cars in the bike lanes over those three years… and silently lamented the cars parked in the travelling lane. That is how unremarkable the first photo is to cyclists, even on the region’s premier bike routes.

Will the NDP kill Mining in BC?

I was prompted to write this post by a Twitter conversation last week. One of the local #NewWest Twitterati opined (not for the first time) that mining and exploration money will abandon British Columbia if the NDP are elected. His opinion seems worthy of consideration: although he is an outspoken supporter of the BCLiberals, he has also built his career in mineral exploration, so maybe this is more about the job than the politics?

Problem is, it contrasted with my (much shorter) personal experience with mineral exploration in BC. A few years after completing my undergrad, I worked a bit of the BC Geological Survey Branch, wandering around mineralized parts of Central BC helping put potential mineral exploration targets on maps. Ms.NWimby had a real job with the BC GSB, conducting geochemistry and drift exploration studies in other parts of the Province, for much the same reason.

At the time, exploration in BC was suffering. There were not that many jobs in BC for just-out-of-school grads in geology. True, the NDP were in office, but I don’t remember anyone talking about that. When talking to small placer miners up the Omineca Mining Access Road, they were talking about one thing only: gold prices. There were sole operators up there who were putting all of their gold into safety deposit boxes, because at under $300/ounce, it wasn’t worth selling.

When Ms.NWimby and I moved to Illinois, we went there to work for the Illinois State Geological Survey, partly because the writing was on the wall for the BC GSB. The message from the incoming Liberal Party was to not expect any investment in the BC GSB: layoffs were coming, and it was time to pull up stakes and find other opportunities if we wanted to do geological science.

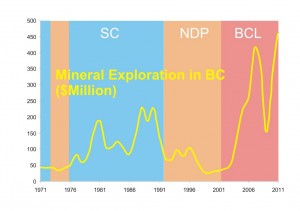
So I thought I would look back at how BC governments have impacted exploration spending in BC since Dave Barrett’s rule. Easy. The BC Government produces a list of historical annual exploration expenditures in the Province. Not Government expenditures, mind you, but private sector investments in the future of BC mineral industry. This is the money that disappears quickly when the private sector get scared that the Government of the day is “unfriendly”. It is also a much better measure of “industry confidence” than actual mining revenue, as mines take a long time to set up, and once operating, carry a lot of momentum – so they tend to last through multiuple administration changes.

I plotted the exploration investment data, Millions of Dollars per year, against the years of Social Credit, NDP, and BCLiberal rule, from just before Dave Barrett’s short 1970s government through the longer late-90s NDP and the current BCLiberals. It sure looks like there was less spending during the NDP. Just look at the precipitous drop in 1997:
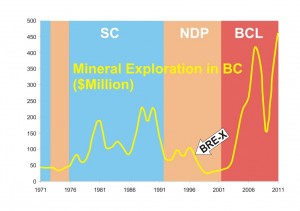
There was another event that was big news in the 1990s that hurt mineral exploration. The Bre-X scandal was huge news in the Earth Sciences Department at my University, and in the Canadian mining sector. Actually, that is an understatement. It was, after all, the biggest mining scandal in history, and it happened right here in Canada. It pulled the money-carpet out from under every junior mining exploration stock on the Toronto and Vancouver Stock Exchanges. The effect it had on how much all those companies spend on exploration is obvious:

Aside from thsi single event, we need to think about where this exploration money comes from – selling stocks in Junior Mining Firms. When people invest in these companies, they are, of course, thinking about potential return-on-investment. That return is essentially based on two things: the company’s chances of finding a marketable amount of metal, and the price of the metal when they market it (don’t start me on the whole pump-and-dump factory that was the VSE). Read any junior mining prospectus, and those are the two things they talk about at length.

So what happened to metal prices over that same period? (please follow links to find the Government references to all the data I use below, I don’t make this stuff up)

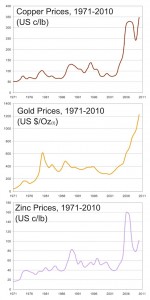
I went to the USGS and looked up their historic mineral stats to find the value of those metals as commodities on the world market. I then compared that to the actual minerals BC produces the most of. According to the Government of BC, 59% of BC’s mineral industry value comes from Copper, 17% from Gold and 11% from Zinc. Essentially, 87% of the money BC makes from mining metals comes from these 3 metals, and their value has changed over the last 40 years:

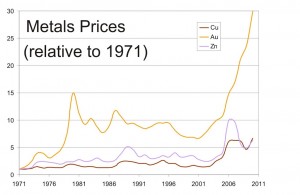
To combine this into a single graph, I turned all three numbers into price indexes. I divided each year’s price by the 1971 price, so this graph shows the value for the three metals compared to their 1971 value.

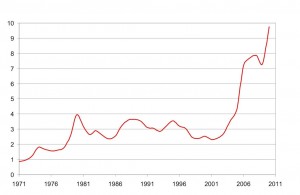
Notice gold changed more than other metals, but represents only 17% of BC’s metals wealth. So I multiplied the numbers above by the percentage of their proportion of BC metals wealth, according to the BC Government stats from above (Copper *0.59 + Gold *0.17 + Zinc *0.11). We get a single graph of the change in value of 87% of BC’s mineral wealth over the last 40 years, not due to Provincial Government action, but simply due to the fluctuations in global metals markets:

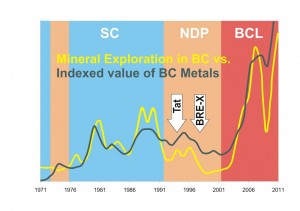
Then lets project that graph over the original one showing exploration spending:.

Then I ask you, does it look like the government in Victoria has as much effect on the amount of mineral exploration money spent in BC as the global metals markets? Who was more responsible for the jump in the late 1970s- Bill Bennett or the Hunt Brothers? Was Gordon Campbell responsible for the value of gold taking off after 2001? Was the NDP responsible for Bre-X?  

Even the greatest “socialist” insult to mining exploration – the dedication of the Tatshenshini-Alsek Provincial Park, which killed the massive Windy Craggy Mine project – is hardly a blip in the exploration-investment graph (it took place in June, 1993), despite what the Fraser Institute may say. I added that arrow, only to contrast the impact of the Tat announcement with that of the Bre-X fraud. (Funny, the Fraser Institute site returns no searches for “Bre-X”).

So unless Adrian Dix has the power to single-handedly manipulate the world metals markets, I will treat the “NDP will kill mineral exploration” meme as just another case of political hyperbole that doesn’t fit the data.