In part one of this post, I talked about how Vancouver and the North Shore managed to come to the conclusion that the Lions Gate Bridge could be refurbished without a significant increase in traffic capacity. This may leave people wondering what the result of this decision was.
If you believe the rhetoric around the Pattullo Bridge project, the increase to 6 lanes is required just to manage the increased population and jobs growth we will be seeing in the upcoming decades. TransLink’s traffic models are clear: increased population equals more cars, you can’t argue with that. If we don’t build the lanes we will be choking off growth, and stifling the economy. The only alternative to more lanes is… uh… traffic chaos, I presume.
The alternative model (which, incidentally, has proven true in every single case in traffic planning history around the world, from SimCity to Los Angeles to lowly ol’ Vancouver) is that traffic will always expand to fill the space, and once the space is full, remain at the same level. There are two sure ways to change the amount of traffic: either reduce road capacity (which removes traffic) or increase road capacity (which increases it).
Lucky we have the Lions Gate as an example for the Pattullo experiment.
First off, it is important to note that the Lions Gate was not a truck route before and it isn’t a truck route now. It had deck strength issues at least as far back as 1974, when trucks were limited to 13Tonnes, and the 2.84-m wide lanes prior to refurbishment were not accommodating to trucks anyway. The new deck was built with the same 13T weight limit, so little changed in that regard. Obviously, it not being a truck route has had significant impact on the livability of downtown Vancouver, but it is pointless to speculate how growth would have proceeded differently if larger trucks were able to rumble through the Park. So in this case, the Pattullo and the Lions Gate are at best an apples and oranges comparison.
Traffic, however, offers much clearer similarities.
The Ministry of Transportation has been keeping traffic counts on the Pattullo bridge since at least 1989. The most important data is the average daily traffic count (“AADT”), as it is the most consistent tabulation of the number of cars on the bridge. Although most colloquial counts say “70,000 cars a day” cross the bridge, that has never been true. Here are the counts from MOT:
1989 65091 2000 64261
1990 64395 2001 n/d
1991 64140 2002 n/d
1992 64220 2003 n/d
1993 64472 2004 63369
1994 65392 2005 62696
1995 64702 2006 62418
1996 64661 2007 62287
1997 65213 2008 61291
1998 n/d 2009 61480
1999 64295 2010 59880
If you want references, I got the 1989 to 1997 data here, the 1999 and 2000 data here, and the 2004 to 2010 data here. Unfortunately, there is no data for 1998, or for 2001-2003 that I can find.
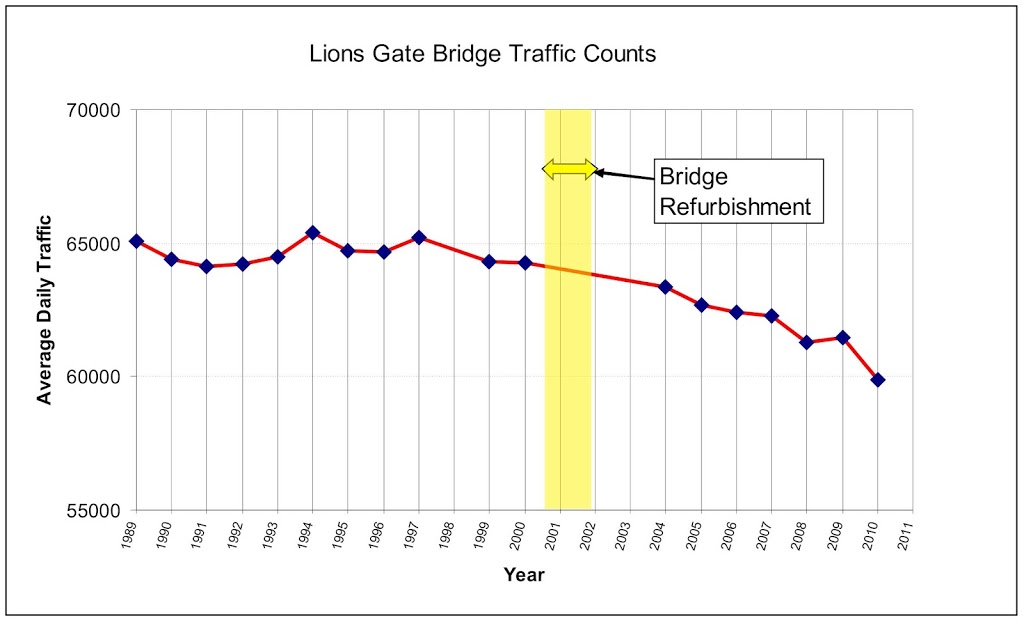
If you graph this data (projecting through the data gaps) it looks like this:
 |
| click to zooooooom in |
So, pretty clearly, traffic volumes on the Lions Gate Bridge have not increased since 1989, and has actually shown a slight decline from around 65,000 cars/day just before the bridge refurbishment to around 61,000 cars/day over the last couple of years (we should probably ignore the 2010 data, as that dip is presumably related to the Olympics, when driving downtown was largely restricted for several weeks).
At the same time, here is what happened to population over that time frame on both sides of the bridge:
1991 1996 2001 2006
City of Vancouver 471,844 514,008 545,671 578,041
North Shore 154,204 163,855 169,322 171,236
Again, if you want references, I got the Vancouver data from here, and the North Shore data is a combination of numbers from West Vancouver, City of North Vancouver , and the District of North Vancouver.
So there has been a 22% increase in population on the Vancouver side (and a significant portion of that increase on the Downtown Peninsula), and an 11% increase in population in the North Shore communities.
Yet somehow, as if by magic, during the same period the car traffic on the Lions Gate has remained steady, or even decreased. Wanna bet that the MOT traffic projections from 1993 didn’t predict that?
Oh, and the numbers of jobs also increased, as did real estate values, numbers of businesses, average income, pretty much any economic indicator of a robust economy tells us both Vancouver and the North Shore communities are richer now than they were in 1996. Here are the job numbers just for Vancouver. If you can dig up any actual data that shows the Lions Gate Bridge decisions have hurt economic growth in Vancouver, you pass that on to me here, and I’ll post it.
The point being? In part 1 we see that Translink has given lip-service to the consultation process for the Pattullo. We have not had a chance to ask them about the reasoning for a bigger 6-lane bridge. They have simply dismissed the question saying their models prove we need a bigger bridge, because population is going up.
After looking back at the Lions Gate experience, I say (with all due respect) bullshit.
What makes the Pattullo situation in 2012 any different than the Lions Gate in 1993? Downtown Vancouver didn’t want more traffic then; Downtown New West doesn’t want it now. North Shore commuters wanted more bridge capacity (as long as it didn’t result in more traffic in their neighbourhoods); today, much of Surrey is saying the exact same thing. Impacts on Stanley Park were considered an important consideration; is Queens Park any less historic, or any less important to the people who live near it? The Government then didn’t have the money to expand the bridge; and TransLink doesn’t have the money to do so now.
Perhaps the difference is that in 1993, the government cared what people wanted. We need to make the government of today (or TransLink, whatever they are) understand what it is that we want. We need to stand up for New Westminster, for Bridgeview, and for the livability of our communities.
We need to tell TransLink “NO” to a 6-lane Pattullo.