In which Coal gets the best of me.

I have a sneaking suspicion I might be very bad at politics.

I just don’t see the issue with the coal terminal proposal in Surrey. Worse: I see a big issue with the coal terminal proposal in Surrey  but I don’t see that issue being meaningfully addressed in the current debate about the coal terminal proposal in Surrey, because I seem to care about the one issue few others seem to be concerned about.

For those who don’t leaf through the back pages of the Record or the NewsLeader, or don’t spend their evenings reading through reams of the reports attached to Council minutes (…which makes me curious about why such a person would be reading this… ehrm… Hi Mom!), the story thus far is thus:

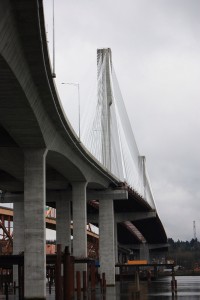
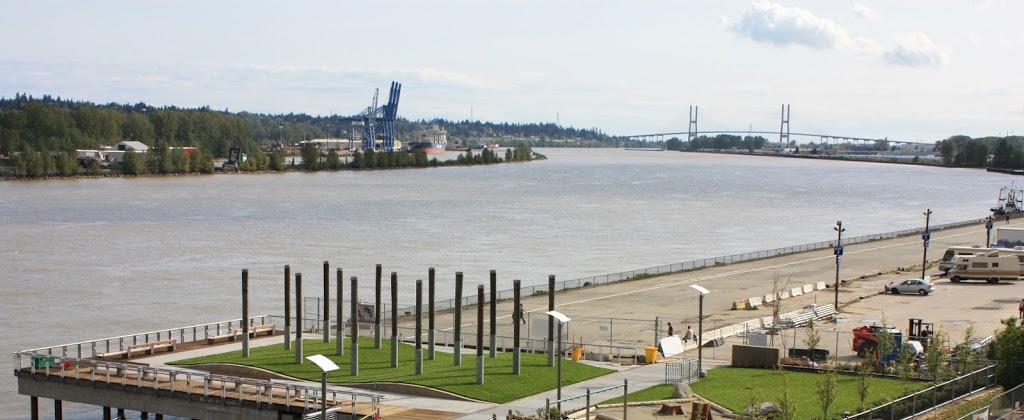
Right across the river from New Westminster are Fraser Surrey Docks, you can see the ships and large blue cranes operating from the Quayside boardwalk. They move containers, logs, bulk agricultural products, steel, and assorted cargo on and off of boats and on and off of trucks and trains. Now they want to move coal off of trains onto barges. And apparently, some people are concerned about this for a variety of wrong reasons.

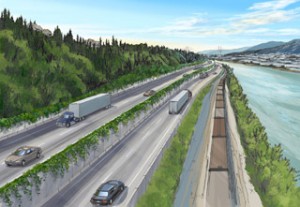
There is a lot of info about this proposed operation available here , including maps, diagrams, and the answers to most of the questions you might have. This will not be a situation like the Delta Port or Neptune Terminals in North Van, where there are large piles of coal being shuffled around. The plan is to move the coal directly from the trains to the barge, and ship it to a deep-sea transfer facility up on Texada Island, then to China. The on-site stockpile will (it appears) be small, and be under one of those big plastic Quonset hut style shelters.

From the looks of the Council Report and the newspaper stories, the local and regional concerns can be summed up as: the health effects of coal dust; increased diesel emissions from boats and trains; the risk related to coal spills into the river; and the general noise and view impacts for Quayside residents.

Most of these issues seem well addressed by the application. The plan is to do all the coal movement with covered conveyors and to use dust abatement measures that are industry practice in urbanized areas. These measures are notably more stringent than those currently used for the bulk agricultural products they move now- that yellow dust sometimes visible from the New West side of the river. Also, this new coal transfer activity will take place at the west end of the terminal, more across from the gi-normous Annacis Island Car Terminal where they unload thousands of cars from those gi-normous car carrier ships than across from the Quayside. The barges, during loading, will be more than 2 km downstream from the Quayside residents who have expressed the most vocal alarm about the project.

The risk of significant spill from the dock or the barges is small, but obviously not nil. That said, compared to moving many other cargoes (especially liquid fuels), coal is relatively stable and fairly easy to contain and clean up in the event of a spill. It would be a very bad day for the salmon in the river if that happened, no doubt, so there is some area to explore here for the local municipalities and agencies like FREMP, clearly an area for more discussion.

The elephant in the room, however, is hardly mentioned in these discussions. According to the Council Report, this coal facility is being planned to move up to 8 Million Tonnes of coal a year that (when burned) will generate about 48 Million Tonnes of CO2 annually. To put this in perspective the same Council meeting had a presentation on the City’s Community Energy and Emission Plan, which would see New Westminster’s 82,000 residents in the year 2030 producing less that 240,000 Tonnes of CO2 annually.

Not to put too fine a point on it: if both of these plans see the light of day this single port terminal will be directly responsible for 200 times the greenhouse gas emissions of the entire community of New Westminster!

So all of our energy conservation actions in the City, all of our appropriate, responsible, intelligent changes we are taking in the City – the sacrifices we are facing, investments we are making, even a few hard choices we may need to take, for all the right economic, ethical, and environmental reasons, will be meaningless in light of the impacts of that coal terminal.

This all arrived at the same time that this month’s Walrus Magazine arrived in my mailbox, with a remarkable piece written by New Westminster’s own Dr. Marc Jaccard that talks about his personal arc from academic to IPCC member to policy adviser to Stephen Harper’s minority government to Nobel Prize winner to being placed in the back of a paddy wagon by the RCMP for protesting the movement of coal through Canada’s ports. It is a great read, as Dr. Jaccard asks himself (and causes us to ask ourselves) what he was doing about the single most important environmental issue of our generation.  This from a guy who has dedicated his life to studying the problem, understanding the science and the economics, and bent the ear of some of the most powerful people in the world. Yet in the end, he felt he was not doing enough, and direct action was the only way he was going to be able to live with himself, or answer to his grandchildren for what we are doing now.

Yeah, I am contradicting myself again. I recently complained that unsustainable shark harvesting as not really being a City issue. This is not strictly a municipal issue, and the Port seems to think the “big issue” of Climate Change impacts is not even Port jurisdiction. This issue, I think, its too important for every single jurisdiction to not take it on. A 450ppm world will not be comfortable for those people living on the Quayside.

The Port is wrong. They are profiting in the trade of a commodity that is causing global catastrophe  It is killing people, and they are part of that supply chain that supports that. For them to say “Hey, we just move the stuff, not up to us to question what we move – none of our business!” is morally bankrupt. We don’t burn Coal in BC, for good reasons, but we are comfortable exporting it to places that do. How is this different than our unethical asbestos trade?

Much more than a few people concerned about how the noise of an operating port 2 km from their waterfront home will impact their property values, I think we need to be asking ourselves why we are supporting the rapid extraction and combustion of coal in the year 2012? And if burning that coal is OK with us, if folks profiting from its burning is OK with us, if the biggest concerns we have about this is the noise of distant conveyors or dust on the horizon, why the fuck are we even bothering with a Community Energy and Emission Plan!?

Sorry for the potty mouth, Mom, but it had to be said.

On the trash fires of our future.

The expansion of Waste-to-Energy plants is creeping back into the news again, and people in New Westminster had better pay attention. I almost forgot all about it, but yesterday I got a letter in the mail from MetroVancouver telling me about the ongoing selection process for new garbage burners:

This is probably because I was involved actively in the long drawn-out public engagement process for Metro Vancouver’s Integrated Solid Waste Resource Management Plan, where the public across the region were vocally opposed to increased trash incineration. MetroVancouver nonetheless barged ahead, and got the plan through the Minister of Environment with waste-to-energy a major component in the plan.

Notably, it took a change in Provincial Ministers of Environment to get it through. The folks in the Fraser Valley are strongly opposed to those of us upwind burning our trash and dumping the air pollution into their air quality index, and the ever-awesome Barry Penner couldn’t sign off on the plan for fear of pitchforks at his Chilliwack office. So when Terry Lake (who, as best I can tell, is a smart, well considered guy – one of the few very bright lights in the current BC Liberal caucus) took over the Environment file, he was far enough removed from the Valley to sign it off.

During the earlier consultations, and pretty much ever since whenever anyone is unwise enough to ask me, I have made my position on Trash Incinerators very clear: they are an unsustainable way to manage solid waste, and an unsustainable way to generate electricity. Importing hydrocarbons from China to burn for electricity is no different if those hydrocarbons are in the form of coal or in the form of plastic bits that happened to have travelled through a WalMart before we burn them. The atmosphere can’t see the difference: fossil carbon is fossil carbon. This shouldn’t be a NIMBY issue- I don’t want a trash incinerator in New Westminster, and I don’t want one in Surrey, or Langley or Gold River.

However, not all WTE plants are trash incinerators. There is one operation currently ramping up just across the river in Richmond that is a better example of how we can more sustainably manage a large portion of our waste stream. The system is just starting to come on-stream, but represents what is (in my opinion) a much more sustainable path for WTE.

Harvest Power takes the organic wastes that people across the Lower Mainland put into our curb-side “green bins”, plus a fair amount of commercial food waste, and turns it into electrical power. This is a multi-step process:

  • Organic wastes are ground up to reduce size of the stinky bits; 
  • The resultant muck is placed in percolator cells, where warm water is dripped through in a low-oxygen setting, drawing a hydrocarbon-rich “tea” out the bottom;
  • After about 10 days, the volume of solids in the percolator cells are significantly reduced and the decomposition slows right down, so these solids can be mixed with woody waste and sand to make a rich organic compost for farms, gardens, municipal lands;.
  • The “tea” is directed to digester vessels, where specialized bacteria is used to further decompose the tea of longer-chain hydrocarbons down to methane;
  • The methane can then be burned to spin a turbine and create electricity;
  • The resultant by-products are the biosolids in the compost, CO2 from the burnt methane, and water vapour.

There are several ways this differs from the Burnaby Trash Incinerator. The most significant difference is that the carbon going into the system is biospheric carbon- that is carbon that has been very recently removed from the atmosphere and trapped in organic compounds by plants, and not fossil carbon. So no plastics or fossil carbon are going through this process. The CO2 emissions are 100% non-fossil fuel.

A second bonus of this process is that it relies on the separation of plastics from organics. This should be the first goal of any modern Solid Waste plan, because plastics are generally recyclable unless they are too contaminated with organics. Even for the plastics we cannot recycle, landfilling is much more sustainable and safe if the putrescible wastes and liquids are removed before burying the wastes. Dry, clean plastic going into a landfill will remain stable for centuries- it won’t leach metals, it won’t generate methane or nasty volatiles, it actually represents the only proven, demonstrable, and practical form of long-term carbon sequestration that engineering has yet provided to us.

However, to make landfills effective carbon sinks, we need to get the greasy, wet, “stinky” organics out of the landfill. They make the landfill less sustainable, and cause otherwise stable plastics to break down into less inert materials. That there are better things to be done with organics that do not involve the unsustainable burning of fossil fuels is really just a bonus.

Unfortunately, much of the discussion of waste-to-energy that Metro is running these days is less public than the Integrated Solid Waste Resource Management Plan was (despite the letter I got in the mail). The media reports are also unclear, as demonstrated in these two quotes came from the same story I linked to above:

“Ross said a key question is whether a new incinerator is built in Metro Vancouver or at an out-of-region site.”

…and…

“Meanwhile, Metro is currently calling for prospective partners to table their credentials and what type of waste-to-energy technology they’d use.”

So is the debate currently only “location of an incinerator”, or are other technologies aside from incinerators being considered?

I sure hope it is the latter, because that will make the difference whether many of us will support WTE in our community, or even the idea of shipping our waste to other communities to be made into energy.

Smart Meters & dumb stuff…

As a student of science, I am familiar with the Observer Effect in physics. It says that one cannot measure a phenomenon without affecting it, since measurement alone relies on interacting with what you try to measure. In most physical process this is not really a very big problem, as the impact of interaction with the measured phenomenon is usually orders of magnitude smaller than the precision of the measuring tool. So the energy drawn from a swimming pool by the mercury thermometer used to measure it is not zero, but it is so small that it does not have a meaningful effect on the reading. However, at the nano-scale (or in the quantum realm), this can end up being very important: to measure the location of an electron, it must interact with a photon, an interaction that fundamentally changes the properties of the electron being measured.

Apparently, it is also important when it comes to measuring household energy use in BC. Not even the monumental Site C Dam project or the never-ending IPP/Run-of-the-River fiasco have caused as many headaches to BC Hydro as the Smart Meter Program. But what does it mean for New Westminster?

A non-smart meter in the middle of the woods, a hassle to read that
I’m sure BC Hydro would rather avoid (Courtesy Lac Tigre Broom Farms)

BC Hydro had to replace their old analogue mechanical meters, and so does New Westminster at some point in the next year or two. This all goes back (believe it or not) to changes at the federal government level. The electrical meter on the side of your house is a measuring instrument used for trade, and therefore is its subject to federal laws regarding their accuracy. Just like the tag at the gas pump that indicates the last time the pump was calibrated, the meter on your house must be demonstrably accurate.

Now, an electrical meter is a pretty high-precision instrument, and is generally operated by a government agency, so the standards for assuring accuracy are not quite as onerous as the gas pump at Ed’s Gas or the weight scale at Thrifty Foods. Instead of testing every single meter on every single house, the Federal Agency “Measurement Canada” has a randomized verification system. Every so often Measurement Canada requests that some number (around 2 dozen) of the New Westminster Electrical Utility’s meters be sent to Ottawa to assure they are accurate and precise. To assure the selection is random, the agency request specific meters from the long list of serial numbers that they have on file for New Westminster Electrical Utility. The Utility then goes to those houses or businesses, pulls the meter off the wall (replacing it with a spare), and ships it to Ottawa. If those all pass the precision tests, the City gets a pass. If one or more are outside of acceptable limits, then a larger cohort is sent to Ottawa to see if the issue is systematic or a one-off. In theory, if enough are off, the Feds will come and test all of the meters or force the Utility to replace them all.

The problem arising right now is that Measurement Canada will no longer be supporting the older mechanical meters. They are getting out of the business of testing old technology, and will only test the newer digital devices in the future. So if New Westminster still wants to sell electricity, they may be forced to update their meters.

A typical old-school New Westminster meter

Note –the old meters still work! Yes, some wear out, and some need occasional repair, but the current meters have a very long service life (being well-built mechanical devices dealing with very light loads), and it has been suggested that with regular maintenance they could easily service us for another 50 years. However, the federal regulations are changing, forcing the utility to replace them. So they are going to the junk pile, operational or not.

The City’s Electrical utility and City Council have stated several times that the much-maligned Corix-installed Wireless Smart Meter chosen by BC Hydro is only one of several options available to them. The new meter will no doubt be digital, but pretty much everything else about it is up in the air. Will it continue to be read by humans going door-to-door? Will it wirelessly transmit data via some sort of SCADA setup? Will it transmit data automatically over attached wires?

These will no doubt be part of a complicated cost/benefit discussion in the City, and it appears there is going to be a public component to this discussion. At a recent NWEP Energy Group meeting, some of these issues came up, and if that small group is any sign- this will be a spirited discussion. Here are some of the points from my viewpoint (and, I hasten to add, many of these opinions were not shared by some other NWEP members – some even hold almost-opposite opinions, which makes me think the larger public discussion with be a compelling one!)

• Wireless Smart Meters don’t cause cancer, lupus, chronic fatigue, scabies, Alzheimer ’s disease, ADHD, autism, or any of the other thousands of afflictions allegedly linked to them. Magda Havas is a terrible scientist, and should be held accountable for stoking irrational public fears. The non-effect of daily exposure to low levels of non-ionizing radiation is not controversial in science community, nor are the alleged links to a myriad of conditions novel or untested to science. There is a significant body of science going back more than 100 years assessing the impacts of human exposure to non-ionizing radiation, including ubiquitous man-made radio waves, and even more ubiquitous solar radiation in the same frequency bands.

• There are significant advantages to developing a “smarter grid” for electrical distribution. Leakages from the system and electricity theft become much easier to detect and eliminate, disaster response and emergency planning are improved. Whether these advantages rely on real-time monitoring through wired or wireless systems should be a determinant if we adopt those technologies;

• The ability to track electricity use in real time provides the ability for people to be more conservative with electricity use in their everyday life. Arming consumers with more information about their purchases should be a good thing! Consumers generally do not want to waste their money, and when given the tools to easily make changes to save electricity, they will usually adopt them. So let’s give them the tools.I would love a meter smart enough that I can collect analytic info off of it to tell me how I use my power. This should be an option available to users, as it will incentivize conservation;

• Any new meter system should accommodate homeowner co-generation. We have a City full of south-facing roofs that may someday include photovoltaic systems, we may have district energy systems or backyard turbine systems. In the next generation, we may find some of our businesses (especially in light industrial areas) may be producing surplus energy they would like to sell back to the grid. If time-of-day pricing is adopted by BC Hydro, then there will be a market for decentralized energy storage and re-distribution. We need to start preparing for this future now.

It has been noted that New Westminster is lucky. In having our own utility, we have the ability to make our own decisions about this, and it seems the Utility and Council are happy to include the public in that discussion. We don’t have to deal with Darth Coleman, and his seemingly random and disjointed decision making about a project that is being administered by a Crown Corporation that is (in theory) supposed to be operated at arms-length from Government.

It is no-where as much as the Smart Meter program where Darth Coleman’s ability to muck about in things that would just be better if he stayed out of the story. At one point not three days ago, he was insisting that BC Hydro will force everyone to install a Smart Meter once their re-education is complete. As of yesterday, Darth seems to have changed his stance, saying that they will not force Smart Meters on those customers that hold out, or they will wait until after the election, or something- it is pretty unclear right now. At least this is a place where the BC NDP have been clear: they will turn the mess over to the BC Utilities Commission, who is should be in a better position to make a decision for the long term good of the Utility than a soon-to-be-in-opposition bully from Langley.

As it stands, we can throw the final implementation of the Smart Grid across BC onto the growing pile of landmines that the current government has laid in the path of the poor bastards who win the May Election, along with BC Hydro deferred debt, unsustainable BC Hydro Rates, the Falcon Gate fiasco, unrealistic traffic projections for Port Mann tolls, the ongoing TransLink budget crisis, the potential shuttering of AirCare, ongoing structural deficits, the long-delayed update of the Water Act, the collapse of the BC timber supply, etc., etc.

If there is a single piece of evidence that even the BC Liberals know they are headed for the political wilderness, it is the path they are laying for the province in the year to come. They would be crazy to want to win the election…

We also have to remember that we in New Westminster are not immune to the effects of BC Hydro mis-overlording. We buy all of our electricity from BC Hydro, so just as Hydro rates are sure to skyrocket over the next 5 years when the offset debt, smart meter bills, Ministerial interference in the Utility Commission’s work, IPP contracts, and Site C shit all hit their collective fans, New Westminster rates will surely follow. I hope I have a meter smart enough to help me find the savings in my household electricity bill by then.

The Return of Green Drinks

Sorry I haven’t rapped at ya recently, but I have been busy. Work is crazy, a few volunteer things are coming to a head right now, spent a few days trapped outside of New Westminster, attended a massively fun Pecha Kucha event, and am generally enjoying the hell out of life.

I do want to make a quick point, though: GreenDrinks is coming back to New Westminster!

For those out of the loop, GreenDrinks is an international local event. The idea is that people interested in Environmental and Sustainability issues get together once a month or so, and have a casual social and networking event. There isn’t an agenda, there isn’t a formal meeting, or any real formal structure: the idea is to just bring people together and see what arises!

Although lacking that formal structure, this isn’t completely anarchy. GreenDrinks is part of a great international tradition. There are GreenDrinks events everywhere from Argentina to Vietnam, from Perth to Vancouver. All are related in name, spirit, and “The Code”.

It is sometimes amazing what arises. Many of the things the NWEP have done in the past have grown from tossed-around ideas at GreenDrinks, and new friendships and partnerships have grown from these events. For a variety of reasons, monthly GreenDrinks stopped in New West a little more than a year ago, but a crew of people have stepped up to get the event operating again, and the first draft (so to speak) is next week!

There is no charge, no stress, all we ask is that you are willing to get into a conversation, meet someone new, bring your ideas and opinions, and bring a sense of humour. We’ll put name tags on you to make introductions easy, and we will have a conversation starter around the break any ice that might develop. People will start arriving around 6:30, and it will continue until the last person leaves (but hey, it’s a school night – so don’t wait until midnight, you might miss the best stuff!)

New West has the perfect location: the Back Room at The Heritage Grill allows semi-privacy, a great menu, drinks for those who would like them, while being open and inviting to people who don’t want to drink (or are not yet 19 – it is a Restaurant, not a Pub!). Oh, and cool tunes out front later in the night.

So if you need an excuse to be social, are interested in environment and sustainability issues, or think you might have an idea that people should hear about, come by GreenDrinks. Who knows what will develop?

What about the Utilities?

I started posting about municipal taxes a few weeks ago. An astute #newwest hashtagger on Twitter, apparently finding me inadequately critical of local tax rates, suggested that once utilities were included, I would find New Westminsterites pay way more than nearly anyone.

“@NWimby Do a comparison with fees for sewer, water and garbage added to property tax and you’ll get a different answer.”

To which I suggested:

“@redacted go for it! Love to see you do that!”

To which the commenter retorted:

“@NWimby It has already been done. NW is 2nd highest behind Maple Ridge but NW is 6squ. Miles and Maple Ridge is 103squ. Mile”

Since no actual data was proffered, I decided to do the analysis myself. Luckily, I had a few hours in an airport with WiFi to do the digging through City websites. The results were interesting, for me at least. For the rest of you, come back next week, I’ll rant about skateboards or bridges or something.

Much like Mil rates, it is sometimes tough to compare between municipalities, as different jurisdictions handle their utility accounts differently. I did my best to compare apple to apples.

Water utility rates are difficult to compare because some cities have water meters for residential users, some don’t, and for some meters are optional. Even the metered cities usually have a flat service charge with a metered rate on top. So to compare the typical annual water bill, I assumed that the house used the average amount of water for metered Canadian households, which is 25 cubic metres per month.

Sewer rates are also sometimes tied to metered water use, and in that case I made the same assumption about typical water use volume. Some cities have extra “drainage” levies or charges to deal with storm water costs, some include it in their sewer bill. I have added all sewer and storm drainage charges, metered or not, into the singe sewerage charge.

Garbage and recycling was the hardest to compare, as every city offers different services. Some have organics collection, some blue box, some co-mingled recycling. Some charge a lot less for “small” containers and really ding the big container users, others have less difference. So for the purposes of comparison, I assumed everyone used a 120L trash, green waste (if available) and blue bin.

I did the best I could collecting all of this data together (and if you find a flaw, please let me know!) I found nothing on-line for Pitt Meadows, and didn’t care to dig too much further. I am suspicious of Burnaby numbers, but that doesn’t affect my analysis too much. This table shows the “typical” household utility bill, per year, for each municipality:

Click to enlarge

Again, we see New Westminster is somewhere in the middle, 6th of the 14 municipalities for which I could find data. Our water rates are lower than most, our sewer rates higher than most, and our trash/recycling about typical.

So what happens when we add this to the annual tax bill for the typical detached home? This is what happens:

click to enlarge

New Westminster ends up right in the middle, 7th of 14 municipalities with utility data available.Maple Ridge isn’t the only Municipality more expensive than New West, as suggested by my Twitter friend – it is actually a relative bargain (except, of course, you are stuck in Maple Ridge).

What is a Mil worth?

There were some recent letters in the Record, lamenting New Westminster’s out-of-scale property taxes. Some feel we have the highest property taxes in the region, one fellow last year even opined the second highest in Canada!

As I previously posted, there are many ways to measure taxes, and Mil Rates only tell part of the story. It gets even more complicated when you add utilities to the mix. Municipalities have different ways of paying for your water, sewer, and trash collection, and this impacts what your property tax bill looks like in June.

As part of my continued interest in calling a spade a shovel, I did a little on-line digging around, and here are the 2012 Mil Rates for the 15 Lower Mainland municipalities that publish this stuff on-line (or at least those who publish it in an easy enough way that I didn’t spend my weekend digging through Bylaw pages).

Richmond can claim the lowest Mil Rate at 1.15, with West Vancouver second at 1.81 and Vancouver a close third at 2.02. New Westminster is third highest at 3.54, with only Pitt Meadows (3.60) and Maple Ridge (3.71) higher.

However, many cities list their fire, police, storm sewerage, or other services and “levies” separately from their Mil Rate. These are not utilities (which are defined in the Local Government Act), but part of the regular City service. Also, there are senior government taxes applied to property taxes: School taxes (set by the Province), along with GVRD, TransLink, BC Assessment Office, Municipal Finance Authority. Add these all up, and you get a truer Mil Rate comparison:

You can click to make larger- tax free!

Now we see West Vancouver pull into its rightful place as the lowest Mil Rate Municipality, with Richmond and Vancouver neck-to-neck for second. New Westminster moves up to 12th, now that PoCo’s “levy” load is added on. The Gap to Places like Port Moody and Langley also tighten somewhat. Still, 12th of 15, with a Mill Rate 70% higher than the lowest in the region, is nothing to brag about, right?

Remember, that these Mil Rates are applied against the assessed value of your house. Since houses in New Westminster cost less than in Vancouver, and more than in Pitt Meadows, the amount of tax you pay doesn’t index all that well to Mil rates.You can use the BC Assessment Office data to figure out the “average” house price in each Municipality, but that does not really tell you what the “typical” house price. Medians and means are both overly influenced by outliers, and when looking at house prices from Maple Ridge to West Vancouver, there are a lot of outliers.

Luckily, the good people at the Greater Vancouver and Fraser Valley Real Estate Boards have a better database of high, low, median, and ( this is most important) typical house value. And they break it up by detached, townhouse/rowhouse, and apartment. You can look at their methodology and explanation of why “typical” is better than median or mean here.

Here is the list of the values of the typical house, townhouse and apartment for the 15 municipalities:

Not surprisingly, New Westminster is in the middle-lower part of the list as far as property values go; generally higher than places south and east, lower than places west. Blame the prevailing winds.

The fun part is combining this table with the Mil Rates Table. I know Mil Rates are based on Assessed Value, not the selling prices that are used in the Real Estate Board stats, but can we agree that the assessment process is equally unrepresentative across the region, and that for the purposes of comparison, the data pile is fair, if not the individual data? Again, the result is accurate, if not very precise.

So here are tables of “typical” Property Tax Bills for the 15 municipalities, based on domicile type, not including seniors discounts, Grants, or the three big utilities (water, sewer, and trash – those will be another post, there is already too much math going on here).

New Westminster is, as might be expected, somewhere in the middle of the pack for most housing types. Not the highest-tax municipality in the region, not the lowest. Somewhere between the 5th and 7th highest, out of 15 municipalities.

This doesn’t comment on the comment that everyone across the region is paying too much tax, but it kind of takes the wind out of the specific examples many cite when saying City X pays way more than City Y. So next time someone suggests their “taxes doubled” since moving from Vancouver to New West, congratulate them on their new home, since they would have had to upgrade from a way-below typical $600,000 house in Vancouver to a somewhat-above-typical $850,000 place in New West (or proportionally similar increase). Which seems like a nice upgrade to me.

Jurisdictions

At a party this weekend, I was chatting up a striking lady (no worry, Ms.NWimby was right beside me), and I mentioned my interest in local transportation issues. She then started to complain about trains. This is not unusual in mixed company in New Westminster: she was sick and tired of the long whistles, the loud whistles, the middle of the night whistles. Why didn’t New Westminster do something about it?

At this point, I usually repart that there is an issue with jurisdictions: in Canada we have Local Government, who are below the Provincial Government, who are under the Federal Government, who are superseded by the Jedi Council. The Jedis answer to the Railways.

But this post isn’t about the railways, it’s about jurisdictions.

There has been a bit of chatter recently around homeless shelters, and the point that New Westminster has them, Burnaby doesn’t. Chris Bryan at the NewsLeaders (Burnaby and New Westminster) has called Burnaby out on the issue several times.

However, Burnaby’s Mayor Corrigan is resolute: homelessness is not the municipality’s jurisdiction, it is up to Senior Governments to provide these services. If the Province and Feds don’t deal with the issue, that is no business of his, and certainly not something he wants impacting his Property Tax rates! New Westminster’s Mayor Wright is just as resolute: it is the Senior Government’s responsibility, but if they drop the ball, the City cannot just sit and watch people die on the streets. So for both of them it is a matter of principle.

For me, it is pretty easy to see who is on the higher moral ground, and where the leadership is.

I gave New Westminster Council the gears a little more than a month ago over the Shark Fin Soup Ban. It was, in some ways, a similar issue (and no, I am not comparing homeless people to fish). The subject is well outside of Municipal jurisdiction, and contains a moral question that might compel action, real or symbolic, regardless of that jurisdictional nuance. However, unlike the Shark Fin Soup issue, the action taken by New Westminster on homelessness is not a symbolic one, but directly helps people living right here in our community, and comes with a real cost to New Westminster taxpayers. It might even be unpopular with some of the more, um, “frugal” taxpayers in the City. There is a potential political cost to making that decision, and it therefore requires some leadership.

There is a recent parallel issue where Mayors Corrigan and Wright apparently agreed: the supplemental funding of TransLink. Here they both agreed that no more municipal money was going to be used to maintain and grow the regional transportation system, and that new funding had to come from some Senior Government master plan. This despite the fact that they represent two of the Cities that benefit the most from TransLink operations and will be impacted the most bythrough-traffic increases that will undoubtedly results as TransLink is choked off from being able to provide better service to peripheral areas. So here the choice to not do what the senior governments should (in your opinion) be doing saves money for local taxpayers money, but costs your citizens and the region in livability. Tough choice.

I don’t want to live in a community where people freeze to death on the street for need of a safe place to sleep, and I am not the least bit concerned that some small portion of my property taxes go to providing basic emergency shelter needs. I wish we had a Provincial strategy to deal with homelessness and our social services were funded adequately by both senior levels of government so we don’t have homeless. I would even offer that my portion of the F-35 money would be better spent on this. But all the wishes I make are not going to help if no government shows leadership and steps in to deal with the problems. I could be talking homelessness or TransLink right now.

What I can’t countenance is Mayor Corrigan sitting on his hands and refusing to invest even a small portion of City land or any local resources to help homeless people in his City, and hiding behind jurisdictional issues. He may feel like he is on high moral ground on this issue, but I don’t see any leadership coming from up there.

Sufferfest

I signed up for a Sufferfest this year. A moment of weakness, a compelling (but probably very bad) idea, a challenge issued, and a handshake agreement. I’m committed.

A friend Andrew and some cycling buddies of his have an annual ritual. They meet up in some Interior BC city on the May Long Weekend, and spend three days riding bicycles long distances over high mountain passes. I saw pictures of last year’s cold and rainy event: it was a Sufferfest.

This year’s plan is no less suffer-worthy, but includes some roads I have never ridden, hence my being compelled to contemplate perhaps taking part. Then the shocking realization came in.

Day 1: (185km) Vernon to Merritt via Kelowna, 97C and the Pennask Summit.
Day 2: (165km) Merritt to Sorrento, via Kamloops, Highway 5 and the Surrey Lake Summit.
Day 3: (140km) Sorrento to Vernon, via Sicamous.

This will be done on bicycles, as fast as possible. Rain or shine, perhaps snow. Suffering encouraged.

The reason I bring this up is that it is creating a lot of discussion among my drinking buddies usual life advisers around techniques to reduce the level of suffering, and much of this discussion is getting very metaphysical. To wit:

Andrew’s advice is to “train”. Aside from the issue of whether I should take any more advice from the guy who got me into this in the first place, the idea of “training” is sort of antithetical to the way I ride bikes. Even in the old days when I used to race bikes, I didn’t train so much as I just went for a lot of long bike rides and more than a few fast bike rides. Intervals? Speed work? Spinning? Not so much. I love to ride, and training was just an excuse to ride more, why reduce the fun of the riding by introducing “training” to the mix? This is perhaps why I generally failed to win races.

I got to thinking, at the meta level, if to train is to suffer, then one has to decide if more suffering is the best approach to reducing suffering. You see, the Sufferfest is going to invoke suffering no matter what I do between then and now. The scale (both depth and breadth) of the suffering will be reduced by filling the intervening time with training, which is programmed lesser suffering to reduce the eventual event suffering.

But how much pre-suffering is necessary to meaningfully reduce the event suffering? Or more important, how does one reduce the net suffering. If one was to graph the suffering over time, you would get something like this:

Since the front part of the curve (training-induced suffering) effects the back part of the curve (Sufferfest suffering), I need some way to reduce the total suffering, which in this case is represented by the shaded area under the curve. I need to find the smallest possible value for that area. That way, I can assure I don’t waste early suffering that will not impact late suffering: I need to find the suffer-minima. I knew I should have paid more attention in college, because this is going to take some intregal calculus.

Then it occurred to me that this may not help me, because the person who has to worry about that is Future Pat. The suffering of Future Pat really shouldn’t be the concern of me, Present Pat. I am already dealing with all the bad decisions made by Past Pat, who not only got me into the terrible shape I am right now by blithely ignoring his bikes for a couple of months, then making some sort of deal with Andrew that has me in my current situation. Past Pat is a real jerk that way, never thinking of others.

This is the same Past Pat, I remind you, who constantly failed to study adequately for calculus exams, dooming Future Pat to marks not befitting the stress induced. I’m afraid he has left me with little choice. Already carrying the load of Past Pat, I’m in no position to be taking yet another Pat under my wing, Future Pat is on his own.

Future Pat is going to suffer the May Long Weekend, the poor bastard. Glad I’m not him.

On Assessments and Mil Rates

Regular readers (Hi Mom!) know I like to define my terms. Almost to a fault. That is how a 300-word missive on the latest outrage can expand into a 1500-word explanation of some nuanced difference in language.

Here we go again.

With the BC Assessment Office returning this year’s assessment reports, and everyone able to look up their own house (and that of their neighbour) using the on-line tool, the Cities will now be able to set their “Mil rates” (or less correctly but more commonly, “Mill Rates”) and the Cities can all brag or their citizens can lament about being the highest or lowest taxes municipalities. Ironically, West Vancouver can claim both titles, and here is where defining our terms is so important.

Property taxes are calculated using a slightly complicated formula, based on three factors: the value of your property, the value of the other properties in your tax area (that is, across your municipality), and the Mil Rate established by the Municipal government. There are some other complicating factors, such as the multipliers used for non-residential properties (Commercial and Industrial properties pay 3-10x as much as residential properties for the same assessed value), and the Homeowners Grant which reduces the effective tax rate for lower-value properties, but really, it all circles around the Mil Rate.

How the Mil Rate is calculated is rather simple. The Municipality figures out in its annual budget how much money it needs from property taxes to operate over the upcoming year, we’ll call that “Taxation Income”. It is then told by the BC Assessment Authority what the “Total Assessed Value” is of all taxable properties in the City. The first number is divided by the second, multiplied by 1000 (hence the “Mil”) and the result is the Mil rate.

So if we imagine a City where there are 100 houses all worth $100,000, their Total Assessed Value is $10,000,000. If the City needs $30,000 to operate, the Mil rate will be 3. We can easily calculate from this that every homeowner will pay $300 in property tax ($30,000 / 100), or $3 per every $1000 of house value.

Now imagine a City where there are 100 houses, but 9 of them are worth $500,000, one of them is worth $100,000, and the remaining 90 are worth $60,000 each. Same number of houses, and the same cost to run the City, so the Mil rate will stay at 3. The Lucky Duckies in the mansions will pay $1500, the guy in the $100,000 house pays the same $300, but the median homeowner will pay $180. Mil rate is the same, the average tax is the same, but the median tax is lower.

Back to the first City. If the Council decided it needs to raise property taxes by 5% to maintain services demanded by its residents, they now need $31,500 in tax revenue. If no-one’s house value increases, the mill rate is 3.15, and they all pay $315. If their properties all go up in value by the same 5%, then they all have $105,000 properties, the Mil rate stays at 3, and they all pay $315.

Just for the fun of it, imagine a City that is similar to the first one, but due to a freak of geography, every house has a spectacular view of the sun setting over the ocean and cold beer springs from the back yard fountains. Because of this, all of the properties have values of $200,000. However, the sea-air and beer runoff erodes the roads, and the City needs $36,000 per year to operate. The mill rate would need to be 1.8, and each homeowner would pay $360. So does that City have higher or lower taxes than the first City?

These examples are ridiculously simple, of course, but they demonstrate the point, when comparing taxes between cities you need to compare apples to apples and oranges to oranges.

The Mil Rate for residential property in New Westminster in 2012 was 3.5441. This compares to other municipalities across the Lower Mainland from 1.81 (West Vancouver) to 4.73 (Abbotsford ). Vancouver was 2.02. Across-the-board comparisons show New Westminster’s Mil Rate is higher than most, but certainly not the highest in the Lower Mainland.

But how do our actual taxes compare?

The average assessed value for residential property in West Vancouver is just under $2 Million. The average assessed value for property in New Westminster is about $550,000, so for the average homeowner, West Van taxes are $3,620; in New Westminster the same calculation is $1,949. Not even close.

Another way to estimate is to compare BC Assessment numbers with 2011 Canada Census data (different ways of counting and different estimates mean different numbers, but the trend/scale is the same):

New West:
Total value: $13 Billion,
Mil Rate: 3.5441
Tax Collected: ~$46 Million (not counting commercial/industrial).
Households: 30,585
Population: 65,976
Tax per Household: ~$1,500
Tax per Person: ~$700.

West Vancouver:
Total value: $30 Billion,
Mil Rate: 1.81
Tax Collected: ~$54 Million (not counting commercial/industrial).
Households: 17,070
Population: 42,694
Tax per Household: ~$3,160
Tax per Person: ~$1,250.

No matter how you cut it, West Vancouver people pay more in property taxes, despite their lowest-in-the-region Mil Rate.

For the City of Vancouver, their ~$1Million average assessed value and 2.02 Mill rate puts them somewhere between New West and West Van.

A friend recently asked me why they pay more for taxes on a $650,000 house in New West than their friends pay for their $900,000 house in East Van. This is a good question, and probably the real cause for the common (incorrect) complaint that New Westminster taxes are higher than anywhere else. The simple solution turns out to be a little complex. Again, let’s use the West Vancouver comparison. From Canada Census data, here is the distribution of housing types:

New West:
Single/ Semi detached (18.6%)
Townhouse (4.1%)
Highrise Apartment (30.5%)
Lowrise apartment (46.6%)

West Vancouver:
Single/Semi detached (61.0%)
Townhouse (2.1%)
Highrise Apartment (20.2%)
Lowrise apartment (16.8%)

Note the highlighted lines: almost half of New Westminster households are in apartments of less than 5 stories: the majority of them in those three-story walk-ups that pepper the Downtown and Brow of the Hill Neighbourhoods. Less than 20% of households are in single detached homes. Compare that to West Vancouver, where the vast majority are single detached.

Yet the things Cities pay for: roads, sidewalks, police, fire, parks, recreation, infrastructure, etc. are needed by all, whether they live in a two-bedroom apartment on the 2nd floor or a 5,000 square foot house on an acre lot. Those costs index to population, not property value. So in New West, we have more people in lower-value housing, and consequently paying less tax.

So my friend has a $650,000 house in Glenbrook North that may be similar to her friend’s $900,000 house on Renfrew Street, but the relative value of her house ($100,000 higher than the community average) is much higher than her friend’s ($100,000 below the community average), and therefore she carries more of the tax burden for the community.

It might not seem fair, but I cannot imagine the alternative. We could cut Property Taxes in New Westminster to the same Mil Rate as Vancouver, but that would reduce our City budget by more than a third, resulting in a catastrophic reduction in services and infrastructure, which would reduce our property values more, widening the Property Value gap between us and Vancouver, and further choking City Hall of money. That seems a vicious cycle to enter.

Another way to look at the problem, of course, is to recognize that you pay $650,000 for a house in Glenbrook North that would cost you $900,000 off of Renfrew. That $250,000 savings is about 200x the annual increase in taxes you pay in New Westminster, not to mention the savings in borrowing costs for the much less onerous mortgage required.

So do we pay too much property Tax in New Westminster? We don’t pay the most in the Lower Mainland (by any measure) or the least (by any measure). And you can always move to West Vancouver and enjoy paying both the lowest and highest property taxes in the region.

The second debate that happens this time of year is the “fairness” of the assessment process. When Real Estate sales are dropping off and everyone is confidently predicting the long-predicted bursting of the housing bubble- how is it possible that the Assessment Office calculated a modest rise in real estate value for New West?

For the fun of it, I entered my address into the BC Assessment search engine, and asked for all local “sales” in the previous year. It returned the 100 nearest properties (all detached homes) that sold in 2012, ranging from $383,000 to $2,500,000 in sale price. I don’t know how “local” they were, but they were all in New Westminster. Then I compared their sale price to the assessed value. The results were interesting.

NOTE: First off, I tossed one property out of the dataset, as it was both the most expensive sale ($2,550,000) and it sold for a shocking 56% premium over its assessed value ($1,631,700). This was a large property in Ewan Ave in Queensborough, with its single home no doubt about to be torn down and replaced with row-houses or an apartment building. It was so anomalous, I needed to remove it to fit the graph below.

For the remaining 99 properties, I plotted the assessed value on the x axis, and the percentage difference between the sale price and the assessed value on the y axis, and the result is informative, if not interesting, in that there is basically no pattern:

If the assessment authority was systematically underestimating property value, the cluster would be predominantly below the 0% line; if it was overestimating, the cluster would be above the 0% line. In reality, the centre of that cluster is just below the line- the Assessment Authority undervalues all property near my house (relative to the resale market) by about 1.4%. (I’m assuming this has to do with my playing Tom Waits loudly all hours of the day and night). Overall, there are 62 properties undervalued, 36 overvalued, and one exactly valued. However, the majority of properties are assessed within 4% of their market value.

Note, there is not much “slope” to the cluster, the authority does not unfairly value expensive properties relative to inexpensive values in any significant way. The average assessed value of every property below the line is $685,000, and the average assessed value of those above the line is $665,000. So although it is not visible in the data, there is a slight(1.5%) shift of assessed value from expensive homes to less-expensive ones.

All that said:  if I was to characterize the cluster, I would call it high accuracy, low precision. There are more than 20% of properties that are off (plus or minus side) by more than 10%. That means a large number of people are paying $200 a year more – or less – than they “should”. However, you should rest assured that you are more likely (ever so slightly) to be paying less in taxes than your share according to the BC Assessment Office.

Bike Ride

I went for a bike ride the other day.

I go for bike rides lots of days, but what made this unique was I decided (against all experience and reason) to go for a bike ride in Coquitlam. Mostly, I wanted to check out progress of cycling connections around the new Port Mann Bridge.

Remember, bicycle and pedestrian access is a “a key goal of the PMH1 Project”, and the plan is to have a bike and pedestrian path crossing at Port Mann for the first time since… well, since anyone remembers. And with all the breathless excitement of the opening of the new bridge (tempered somewhat by the bridge’s sudden violent temper), the introduction of tolls, and New West suffering under the weight of the toll-free alternative, I thought I would pop over to Coquitlam and see what the new bike path looks like.

Except, of course, the new bike path isn’t done yet. And there is no mention anywhere on the PMH1, Gateway, or Ministry of Transportation websites suggesting when or if it will be done. I sent an e-mail to the Gateway people and got this in reply:

A key goal of the PMH1 Project is to improve cycling connections throughout Metro Vancouver, and when the project is complete, cyclists and pedestrians will be able to cross the Port Mann Bridge for the first time.
When the bridge opens in its final design, it will have 10 lanes and one multi-use path on the east side of the new bridge. The multi-use path will have a barrier-separated, three metre-wide cycling and pedestrian path. A portion of the existing bridge must be dismantled to complete the final two lanes on the south approach. Given this, the multi-use path will be complete when the final two lanes are opened. We are in the process of finalizing a schedule, but we anticipate this will occur by the end of 2013.

So cyclists and pedestrians will have to wait another year or so before they get to use the bridge, but it is still a “Key Goal”.

Until then, I can speculate about how useful the bike path will be, considering its connections on the Coquitlam side, and I can lament the abhorrent situation created by the construction of the bridge in the first place. Hence, my little bike ride.

Riding through New Westminster on the Central Valley Greenway is a relatively painless experience. The CVG is not perfect, but it is a pretty good second-generation bike route. Even with a few strange connections on the New West side, it is easy to follow, and at no time is it really unsafe. Trying to connect to Coquitlam, that is when you enter the danger zone.

Dropping down behind Hume Park on the bike path to the Braid Station, the Coquitlam-bound have two options: The Baily Bridge to United Boulevard, or the Brunette Overpass to Lougheed. The second isn’t really an option: it is a confusing jumble of lane-changing highway traffic with no shoulder and an uneven and intermittent sidewalks, leading you to nowhere but more killer intersections. Meanwhile drivers are jockyeying for the hole-shot of the on-ramp merging just before exit or the gap in traffic on Brunette to make the suicide turn off the off-ramp (both definitively not looking for cyclists). I’m an aggressively hyper-aware and experienced bicycle commuter (I worked as a bicycle courier in downtown Vancouver in the late 1980s!), I can move a bike through urban traffic like few people. The Brunette overpass area is too scary for me.

So that leaves us the Bailey Bridge to United Boulevard option. The bridge is ok, wait your turn in the line of traffic and occupy the entire lane so the irate guy behind you cannot pass. United past the Golf Course is currently pretty good, because it was built as a 4-lane but currently has two lanes, so lots of room. It was noted by cycling advocates during the UBE discussions that it is certainly not wide enough for four lanes and a reasonable bike path. TransLink’s inability to commit to widening United to make it a safe bike route was one reason regional cycling advocates lined up against the UBE, even with a bike path on the UBE being a “key goal”.

things get much worse once you get past the new King Edward Overpass (with its luxurious pedestrian and bicycle lanes). United Boulevard is narrow and curvy, just barely wide enough for its four driving lanes. No sidewalks, and certainly no shoulder. Add to this numerous poorly-marked driveway entrances and exits to the commercial and industrial sites and a completely disregarded speed limit, and this is one of the least safe roads for cycling in the region. Yet, there are no alternatives. There are no connecting roads at all to the south. Lougheed is a high-speed high-volume freeway with double-lane turnoffs. Brunette Ave through Maillairdville is only better than United in that there are enough traffic lights to slow traffic a bit. The simple message is that Coquitlam doesn’t want people riding bicycles.

The City of Coquitlam does produce a Bicycle Route map, you can see it here. It is pretty much what you expect, disconnected lines with a few routes, featuring more gaps than actual connections. So once the new bike route accross the Port Mann is built, where is it going to go? Who the hell would ever use it?

According to Gateway plans, it will connect to Lougheed Highway on the north side. This should, at long last, provide the people of Surrey the safe cycling access to Mackin Park they have so long awaited. Or perhaps, they can ride to the King Edward Overpass, and watch 10 lanes of cars vroom by below. Fun for the whole family.

What Coquitlam does have is those kind of bike paths preferred by people who don’t really ride bikes for their utility, but as an alternative to playing tennis or bocce. The short multi-use bike path through the park, where one can drive to and park easily, take the Canadian Tire bikes off the rack, spin around for a half an hour. A great example is the path connecting Maquabeak Park under the old Port Mann to Colony Farm Park (as you can see on the Coquitlam Cycling map). It is not really suited for cycling, is guaranteed to produce user conflict, and doesn’t really go anywhere.

Even this sub-optimal trail has been wrecked by two years of Port Mann construction. With construction staging on top of the old trail, there are signs indicating some sort of detour:

But no actual map or diagram or even arrow to tell you where these detours are. I looked on the City of Coquitlam website, the Gateway one, the MOT and transLink sites after I got home, and I’ll be damned if I can find a map of the purported detour anywhere. so I cannot even blame my complete lack of preparedness for this adventure.

So it was back on United, still bereft of sidewalks or shoulders, but now enhanced by highway on-ramp and off -ramp traffic. Until I was greeted by this:

And this:

I had apparently found the detour. It went right by this spot:

At first, I assumed he sign in the middle was not meant to be ironic. then I thought about it some more, and realized that it was only through the lens of irony or pure David Lynch surrealism that any of the signs made any sense whatsoever.

So what’s the point? When it comes to bicycle access, Coquitlam is a disaster. Combine their incompetence/disinterest with the Ministry of Transportation/Gateway™ aggressive dislike for non-automobile users, and the result is a horror show of pissed away taxpayer money.

The $5 Billion Gateway™ program will, they triumphantly declare, provide “an estimated $50 million in pedestrian and cycling improvements.” Which is, apparently, “the largest single investment in cycling infrastructure in the region”. I would love to be excited about this “investment” in sustainable transportation that represents 1% of the budget, except for two things: It is a sham, and the results will be useless.

The MoT/Gateway™ plan for that $50 million can be read in this report (at least that is the most recent information we have). Aside from including a bike path on the new Port Mann Bridge that won’t connect to anything useful, (at maybe a marginal cost of a couple of million dollars?) it isn’t about building bicycle or pedestrian infrastructure at all. It is about “accommodating” bicycles and pedestrians on the expanded overpasses they have to build to span their shiny new megahighway. Essentially, replacing the current sidewalks and leaving enough shoulder room to paint a white line.

It actually gets worse on the South Fraser Perimeter Road, where the “cycling infrastructure” investment is going to be painted bike symbols on the hard shoulder of a limited-access 80km/h 4-lane truck route. Look at these pictures from the official SFPR website:

See that space between the semi truck going >80km/h and the concrete wall? That’s “bicycle infrastructure” in which they are investing your tax dollars. Looks like a fun place to take the kids for a spin, eh? Why not just call it what it is (pull-off space so stalled vehicles don’t slow the rush of progress traffic), and quit with this shell game accommodation-as-infrastructure bullshit.

If MoT / Gateway™ was really interested in improving cycling infrastructure, they would hand that $50 Million to TransLink or the municipalities to invest in real, useable bicycle infrastructure where it is needed and where it will be used.

In the meantime, I suggest everyone avoid taking bike rides to Coquitlam.