One of the changes we have made in the City in recent years is moving the budgeting period up a little, meaning we are able to get the 5-year Financial Plan bylaw through Council in January, where we used to do it a little later in the spring. The true deadline for us to get this work done is the annual financial reporting deadline to the province that comes in May, but it is better practice for us to do this work earlier in the year so that staff can more easily develop annual work plans around an approved budget, which will hopefully lead to some efficiencies and make it easier to get things done in City Hall.
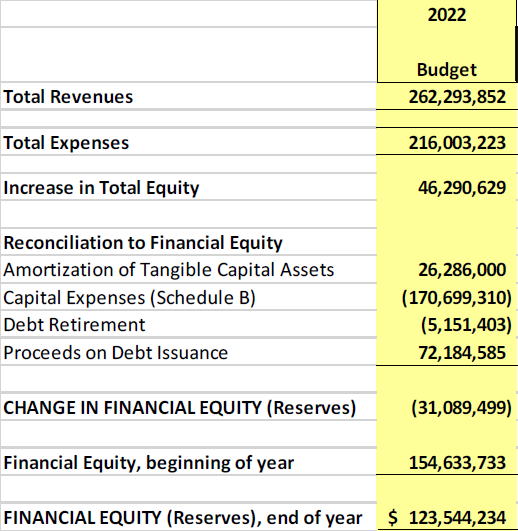
Council gave first readings to the 5-year financial plan last meeting, which means the budget is, effectively, passed. The headline (4.4% tax increase) has already been told, but I promised to write a bit more the Budget and how we got there. The 2022 budget part of the 5-Year Financial Plan looks like this:
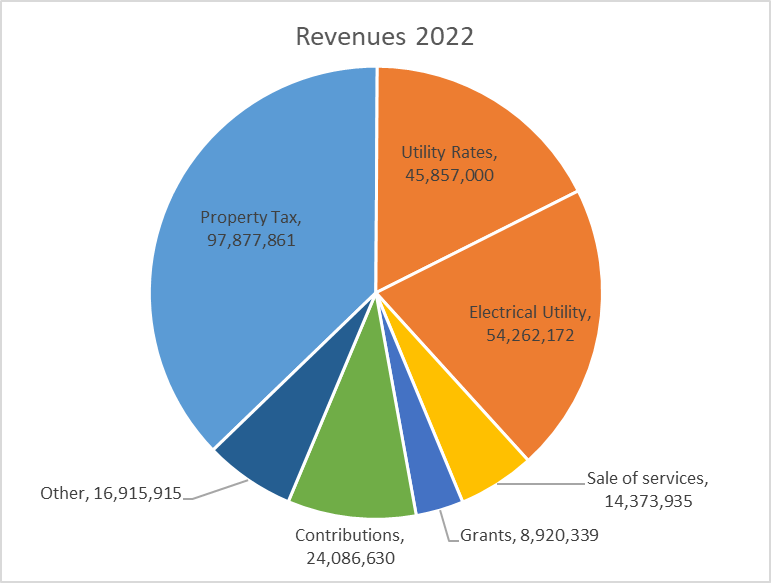
On the revenue side, we are anticipating an overall 8.9% increase in revenues over the 2021 budget, with the increase in property tax revenue at 4.4% (after all, only about 37% of the City’s revenue comes from property taxes). As has been much discussed, New West is unique in having an electrical utility, so that $50+ Million in annual revenue always makes it look like our revenue per capita or per household is higher than other cities in the lower mainland, when we are usually about average after adjusting for the Electrical revenues, but that’s a topic for another blog post.
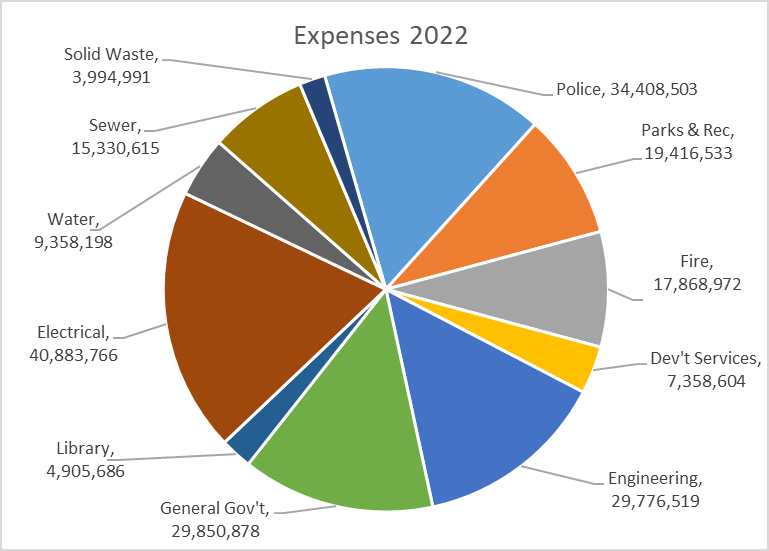
On the expenses side, this is where the City is spending that money. 2022 Expenses are about 4.8% higher than last year:
The biggest change this year in our General Fund (the part property taxes go toward) is to insurance rates. As always, we are subject to inflation on everything we buy, and inflation was high this year for the things cities like to buy, from fuel to lumber (our “basket of goods” is quite a bit different than the CPI). So a tax increase equaling 2.7% (out of the total 4.4%) is a combination of negotiated wage increases in the 2% range and inflationary increases in the cost of the business of running a City. On top of that, the same global insurance market situation that has caused your Condo and/or house insurance to skyrocket is also impacting the City. We will be paying $1.5 Million more on insurance in 2022 than 2021, which adds another 1.6% to the tax increase on that line item alone. We had a few service enhancements adding up to the equivalent of about another 0.8% increase, but saved some money in not operating the CGP and staff found some other savings in internal functions, meaning we effectively offset most of that 0.8% with savings.
On the utility side, we are seeing a continued trend toward increases higher than CPI, driven by increases in regional utility service costs and our need to keep the local assets maintained. I wrote about how our Utility funds work with some flow charts to show where the money goes a few years ago here, and though the numbers have gone up a bit, the effect is the same. Notably, both in the Water and Sewer we are a little ahead in both capital spending and building up our reserves than we were back when I drew those diagrams, so the financial health of the utilities is improving faster than expected, which I hope translates to a moderation in rate increases in the years ahead.
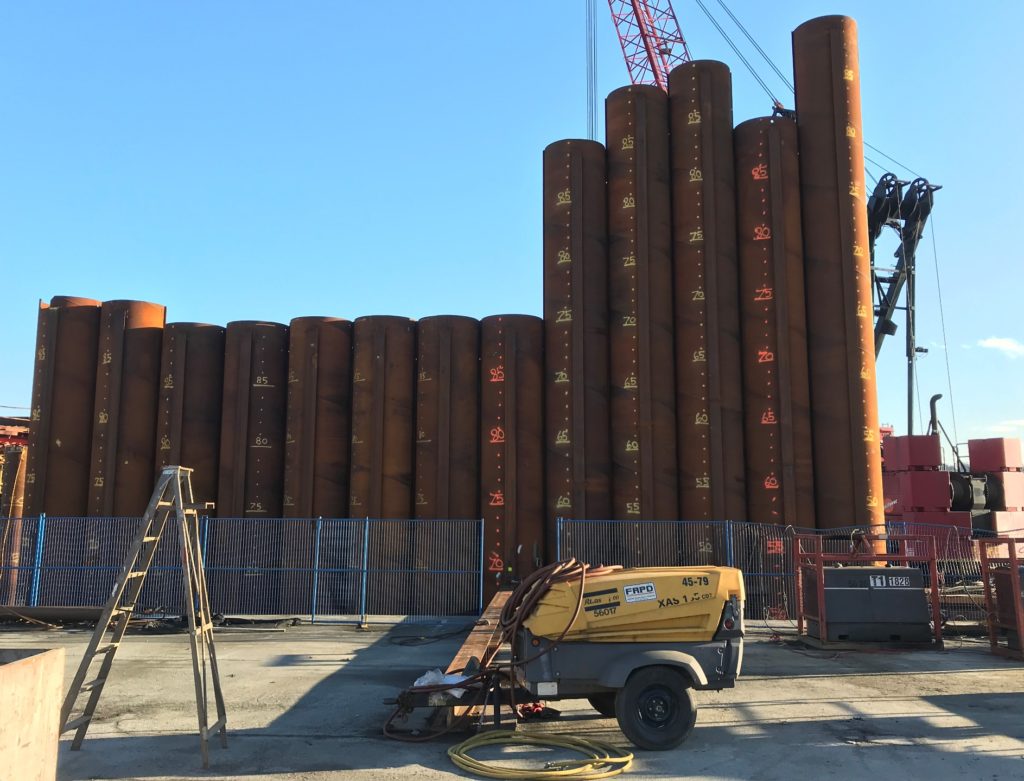
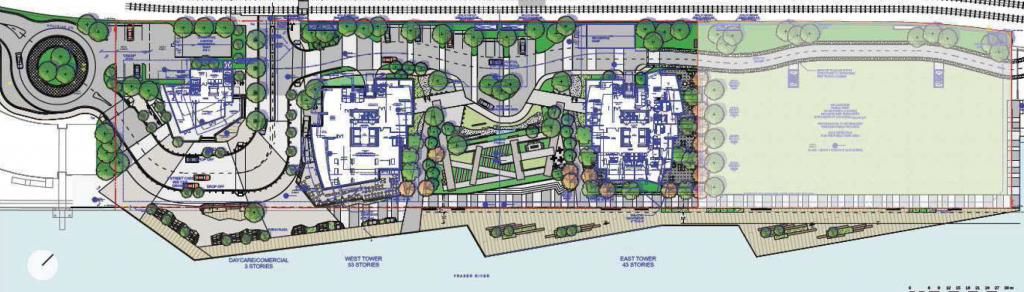
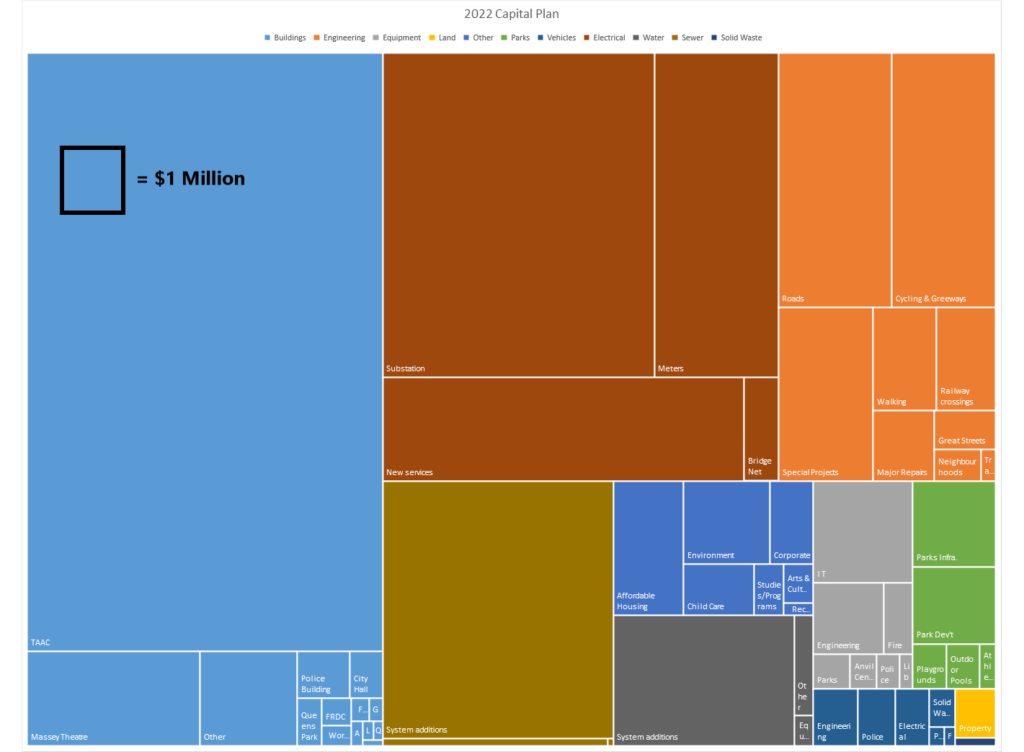
With $262M in Revenues and $216M in Expenses, we end up with a budgeted $46M increase in financial equity. But it would be premature to call that profit, because diligent readers will remember my constantly talking about our aggressive Capital Plan, which requires us to be converting that equity into capital assets, better translated as “building stuff”. The big number to note in the reconciliation of assets part of the table is the $170M in Capital expenses. it bears repeating that this is the big year for a couple of capital projects. We are budgeting $54M in 2022 towards the təməsew̓txʷ Aquatic Centre, almost $43M in upgrades to the electrical grid (including a new substation in Q’boro and replacing all of our meters), $7M in road rehab and $6M in new mobility lanes. If you want details on everything, look at the tables of planned capital expenses starting on page 64 of this report (warning – it’s a big download). It’s all there. More graphically, the $170M 2022 budgeted capital pan looks like this (with the black square representing $1M):
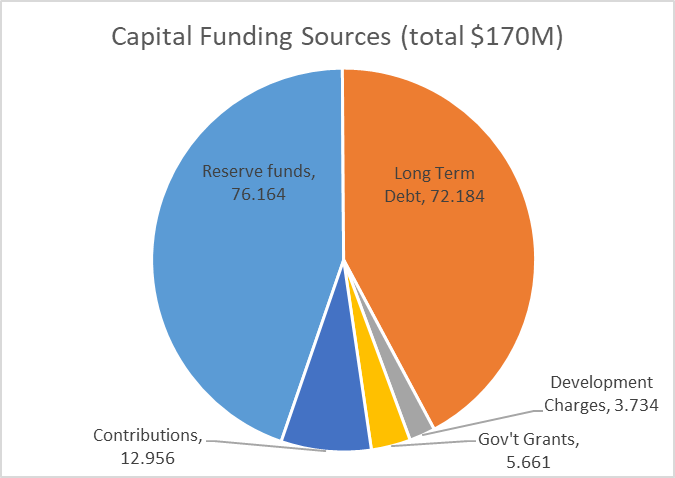
So, the City may plan to put $46M into reserves this year, but we also plant to take $76M out of reserves to pay for about half of that capital plan. This is based on a strategy that balances between drawing from reserves (“spending our savings”), borrowing against the asset value with long-term debt (“securing a mortgage”), and getting others to pay for it (grants form senior governments, money from developers through DCCs, etc.). I’ve written about how municipalities approach this balance in this older blog post. In practice, the balance looks like this:
So to wrap up, the City of New West is once again somewhere in the middle in the region as far as tax rate increases, has weathered the economic uncertainty of the pandemic, and is moving ahead aggressively with some long-awaited capital improvements.
I finally had a little time to condense down a bunch of thoughts and notes about the Opening Doors report that was delivered to the Provincial Government last year. I read the report when it came out last summer, and noted how it landed in an overstuffed news cycle to be almost ignored by anyone who wasn’t already a housing wonk. I might have winged a bit on line at the time, but I was not overall as critical as some of my neighbours across Tenth Ave.
Last month we held a Workshop at New West Council to talk through the report recommendations with staff support, and prepare a more formal response to the provincial government (you can watch a video of that meeting here and see the report and presentation City Staff prepared to inform that workshop here). This brings me to my regular warning that the comments that follow are mine, not the official position of New Westminster City Council or anyone else, and you might want to watch that video to see some of the more nuanced discussion other Councilors brought to the discussion.
The report needs to be put into the context of how and why it was created. It was an Expert Panel put together to provide advice to the BC and Federal Governments (delivered to the respective Ministers of Finance, notably) so it weighs heavily on things senior government can do. The Experts on the Expert Panel were, perhaps shockingly, bereft of municipal experience, and their decided expertise in finance and property development resulted in their firm application of Maslow’s Hammer. I also chagrin that the progressive *economic* quick wins proposed were the only part of the report that the senior government Ministers of Finance rushed to make comment on – and that was just to say no to them at the moment they were proposed.
But I’m already getting ahead of myself. Let’s look through the major policy directions proposed, from the municipal perspective. There were 5 major themes, and 23 recommendations, and you can read through them all if you like, but much like the conversation we had at the Council workshop, I’m going to summarize by order of government, because we all have work to do to address what is a national crisis at this point.
Things the Feds can do:
The roots of our current homelessness crisis are found in the early 1990s when Paul Martin looked at the comparatively modest housing cuts under a decade of Mulroney, and decided he could do better. The 1994 Martin budget got the federal government right out of the business of building housing. When a rapidly growing and urbanizing country like Canada goes from building 15,000-20,000 social housing units a year to less than 1,000 there are going to be devastating effects. And here we are.
So, with the Feds having the, by far, deepest pockets, it is not surprising that the one thing the Feds could do first is start using those funds to build housing. To quote directly:
the federal government make long-term funding commitments, as was done until the mid-1990s, rather than offering short-term capital grants. We recommend that the scale of these funding commitments reflects what is required for the construction of new social housing units to return to historic levels, when nearly 10% of all national housing starts were social housing units
There are also great recommendations here about making Federal Lands available for housing in high-demand communities, giving the non-profit housing sector more tax incentives, harmonizing programs that may speed housing being brought on-line (like federal/provincial/municipal building codes, fire codes, energy efficiency codes, etc.). But, still, someone has to pay for the housing that the market is not going to provide.
There is also a recommendation around incentives that stands out to me:
federal and provincial governments create a municipal housing incentive program rewarding the creation of net new housing supply wherever demand occurs… their primary purpose is to recognize municipal costs incurred in growing the housing stock and reward growth of housing supply where it is needed.
This addresses straight-on a significant downloading concern all Cities have in investing in affordable housing. Given an historic lack in Federal and Provincial funding (only beginning to be abated now), creative cities looking to be proactive have tried to leverage local powers to get housing funded. This means directly spending on housing, giving our limited land base up to affordable housing projects, or leveraging affordable housing as a community amenity attached to new market housing. This last one definitely has populist appeal, because it makes people feel we are making the “greedy developers” pay for it, but the reality is we are simply taking money that would have otherwise been used to pay for other community amenities – parks and recreation centers and libraries – and as we dip into those resources, we lose public support for growth, because we cannot provide amenities that assure a denser City is livable and full-service.
So this recommendation seems to suggest that Cities that meet housing growth targets are prioritized for federal funding. I actually hoped it would go a little further and suggest that federal infrastructure granting programs like ICIP should specifically hinge on high-demand communities like New Westminster meeting their housing targets.
Things the Province can do:
When Martin/Chretien gutted federal funding for housing in the early 1990’s, BC stayed in the business of building housing for another decade or so, until the Liberal Government of Gordon Campbell put an end to that in 2002. Though programs are now coming back in a meaningful way, we are left with a big gap of 20 years of underbuilding to our needs.
All of the points above about what the Feds can do also apply to the Province – they can provide funds, land, and incentives. Though their pool of funds is somewhat smaller, they are in the right place to note and be proactive about regional needs, and indeed the money saved by giving people safe, secure homes comes right back to the Province through savings in health care and other social support spending.
One aspect of this that is somewhat missed in the panel report is the opportunity for the Province to get back into the business of supportive housing. By the current model, the Province may provide funding to private developers to include affordable housing in their market housing proposals and/or provide funding for the not-for-profit sector to deliver and operate the housing. This is based on the neoliberal idea that government saves money by paying someone else to do something instead of doing it themselves. This is the model that brought us disastrous results when a pandemic hit the care home sector, and a model we still somewhat resist for healthcare. But this is still an operating assumption for housing that adds complication and uncertainty to the delivery of housing, and makes it harder to get housing built.
This report skates around the demand side of the equation. I know this is a politically charged discussion in a growing country with ambitious population and economic growth models, and I am not going to delve into the fanciful economics of a certain UBC landscape architect or the xenophobic ravings of familiar populists. Instead, I would suggest the place where demand management comes in is the federal and provincial taxation structures that reward the commodification of housing, while at the same time providing no benefit to renters or those who are unhoused. For whatever reasons these various structures (homeowner tax credits, capital gains exemptions for housing, etc.) were developed years and decades ago to encourage people to buy and stay in houses, they no doubt provide a perverse incentive during a housing crisis where most cannot afford the ticket to entry while taking hundreds of millions of dollars out of the government’s coffers that could be better applied to providing housing to those in need. This is the part of the Expert Panel Report that senior governments rushed to say they were not going to enact. See recommendations 21 and 23:
21.…make changes to tax programs to bring the treatment of renters and homeowners into closer alignment. This would include reviewing the impact of the capital gains tax exemption on principal residences… and extending comparable support to other forms of wealth building; 23. …phase out the Home Owner Grant. Monies saved from this should be used to fund social housing in addition to the commitments made in the 10-year plan.
Alas, the Culture of Contentment assures that no government, no matter how progressive their campaign, will be willing to address this disparity any time soon.
Another important piece missing from this report is the need to protect renters and keep people from becoming homeless in the first place. Again, the Province has made tentative steps in the right direction here, but is not where the City of New Westminster and other local governments have been asking them to be in stopping renovictions and demovictions.
Things for Local Gov’t to do?
I’m going to mix together our Regional and Local government parts here, and only note that the Expert Panel Report skips regional government altogether, though they are a significant provider of affordable housing in the Lower Mainland and other regions of the province. They are also the level of government that sets regional land use and housing policy, but we’ll get to that.
The part to remember is that this is a report to senior governments, and the question here is more “what can senior governments to do to either compel or make local governments approve more housing faster?”. This might sounds strange to many in New West, where we are meeting (and slightly exceeding) our regional growth strategy targets for housing, rental and affordable housing, and population growth. If anything, I feel people are starting to feel a bit of growth fatigue related to construction impacts. However, we are one of the few municipalities hitting these targets (as I talked about at length here), and housing demand is still far outstripping availability – so what can the province do to get those other municipalities to keep up?
Right off the bat, we know the first recommendation doesn’t work:
the B.C. government impose statutory time limits to all stages of the property development process, municipal or other, for all types of development. Similar limits imposed in Ontario and Alberta can serve as examples
Putting an artificial timeline of, say 90 days on a Rezoning application as Ontario did, fixes nothing. The arbitrary nature of the limit belies the complexity of many rezonings, ignores that even the Province cannot commit to providing referrals within that time limit (in the case of EMA freeze-and-release provisions, or MOTI approval for development near highways as only two examples), effectively undermines the ability for an elected Council to do what the Community elects them to do. It reduces a local government’s ability to evaluate and benefit from land lift related to rezoning, and undermines any principle of meaningful community engagement over development. The net effect is that most rezoning applications would be turned down, not that most would get approved faster. It does this all while adding a new layer of bureaucracy – the tribunal through which applications not meeting timeline could be appealed.
Fortunately, more of the recommendations around introducing “affordability adjustments” to the Housing Needs Reports, aligning our OCP updates with these needs reports, provincial streamlining of development permitting processes province-wide and the such, are doable, reasonable, and would likely have wide-spread buy-in by municipalities, though they may take some work on behalf of all parties.
An identified theme is that Municipal and regional housing targets actually have to come with some force. We are dealing with a regional problem, and need to solve it regionally. There are a variety of sticks and carrots the Provincial Government can apply, and a lot of funding incentives for infrastructure to better support the pressures cities face as they densify. Indeed, changing how the province incentivizes growth would also result in significant greenhouse gas reductions and reductions in the cost of many different forms of service delivery. There is a big win in here, but it would require some political courage to step into what local governments (and regional governments) see as their turf. When half the mayors in the region are elected on straight-up or veiled promises to curb growth, political battles would no doubt ensue, but a crisis like this does not allow half of the region to say “not our problem” as has been the reality for a decade. They know who they are.
There are two aspects of how Cities approve housing that the Provincial government can definitely influence, as they are regulated at least in part but Provincial regulations: how Cities finance growth, and how our permitting programs work.
On the financing side, the report includes this recommendation:
conduct a full review of local government revenue sources and spending responsibilities… includ[ing] consideration of additional or enhanced funding sources for infrastructure and amenities that are more predictable and do not rely on rezoning or the development process. Preference should be given to means that capture land value through taxation, rather than homebuilding
To frame this a bit, Municipal governments collect Development Cost Charges (“DCCs”) on new growth, Voluntary/Community Amenity Contributions (“VACs” or “CACs”), and a whole raft of different fees and changes on development. It’s a bit of a complex mess, and outside of DCCs, not particularly well regulated. This creates not just cost, but uncertainty and complexity for builders and great variances across the province and region. One recommendation would be for the Province to clean some of this up. perhaps by expanding the DCC program to make it more flexible and reduce the reliance on VACs/CACs. This sounds easy, but is actually something that would have to be addressed with great care, as the balance between community and private benefit from growth (never mind the public perception of that balance) is precarious and dynamic, and Mencken warned us about seemingly simple fixes to dynamic human problems.
The second aspect of change could be in the permitting processes themselves. Given the financing issue is managed (see above),then strategic pre-zoning takes a lot of risk away from builders, and reduces the time taken to get from planning to occupancy. This type of strategic pre-zoning probably doesn’t want to occur until we have a funding model established to assure the community knows it is getting its share of the inevitable land lift (and Cities have a way to fund the parks, playgrounds, roads, theatres and libraries that make the community livable), and stricter and clearer design control is in place, as the City will functionally be ceding much of that control when it gives away zoning. There are incremental changes Cities can make in the short term (like New West, where we have given Development Permit authority to staff without an extra trip to Council), but some major shifts in the permitting process that are recommended (like reforming the problematic Public Hearing) would require changes to provincial legislation.
The summary
We have a housing affordability crisis because we are not building enough homes to meet demand. We have a homelessness crisis because we are not building enough non-market and supportive housing to provide appropriate shelter for people who are forced out of the bottom of the market as prices rise. These are two overlapping crises that require parallel approaches to fix.
The first problem is related to a complex mix of jurisdictional and political roadblocks, some easier to overcome than others, but even with the existing legislative framework and tax structure, municipalities can build to meet demand now. some of us are. If the Regional Growth Strategy is any guide, Municipalities like the City of North Vancouver and New West have shown that the solutions are available, but some municipalities simply don’t want to take part. We need to level that playing field.
The second problem is much easier to solve. Build housing for people who cannot afford to be in the market, like this country and this province did in the decades between WW2 and Mulroney/Chretien austerity, or as the Baby Boom generation calls them, the Good Old Days. Fortunately, this easier-to-solve problem can go first, and even the most reluctant local government can’t stop it if the senior governments are committed to fixing it. As a bonus, it takes the pressure off of the harder to solve supply/demand problem of market housing. But to solve that second problem, we first need senior governments to be more honest about the goals of our economic policies, while local governments need to be more honest about whether they actually want to solve the problem.
This report, for its strengths and weaknesses, could open doors to some of those more truthful conversations.
A New Year, the same old Council Meeting report blog, starting with the same old “sorry I’m late, but things are busy!” lame excuse. Our January 10 meeting had a fairly light agenda, but started with a big presentation from staff:
Budget 2022: Five-Year Financial Plan 2022 – 2026
This is the last step in our annual budgeting process, the approving of a Bylaw that sets out the five-year financial plan as required by provincial law. There are lots of details here, and I should probably pump those over to a different blog post – coming soon!
Joy and Whimsy Initiative, Director of Parks & Recreation
2021 was a hard year for community. Not just our community, but the very idea of community. Many of the organizations and institutions that pull us together were struggling with shifting Public Health concerns as we stepped out and back into pandemic response. It was also a year where many of the Climate Change cheques we have been writing for 100 years started to get cashed in unpredictable but totally predicted ways. Trust me from the correspondence I receive in this job, people are anxious, uncertain, stressed. They need reason to smile.
Fortunately, the City’s grant process to community groups pivoted to help support events and ideas that drew community together within the limits available, and the City’s own Arts and Culture and Parks and Recreation folks developed programs to add to the joy and reduce a bit of the heaviness of the year. This report form Staff outline the successes of the programs. I heard a lot of positive feedback from the community about these small programs, and thank the community partners who helped make this happen.
The following items were Moved on Consent:
Heritage Revitalization Agreement (323 Regina Street) Bylaw No. 8304
This homeowner in Queens Park wants to build a larger-than-permitted Laneway House on a largish corner lot in exchange for permanent protection of the existing house. This will go to Public Hearing, so I’ll hold my comments until then.
Rezoning Application for Duplex: 122 Eighth Avenue – Preliminary Report
This homeowner in Glenbrooke North wants ot build a largish duplex where there is currently a smaller house. This is just a preliminary report to see if Council has any red flags, and it will have to go through consultation and committee review, and possibly a Public Hearing, so I’ll hold my comments until then. Frankly, I’m wondering why a property development that requires no variances from what is permitted even has to go through this onerous process, and why the density being proposed in such a high-services neighbourhood is so low.
Rezoning Application for Infill Townhouse: 337 and 339 Keary Street – Preliminary Report to Council
A developer want to build 9 townhouse-style homes on two lots in Upper Sapperton, and this is a preliminary report to see if Council has any read flags before it goes to consultation and detailed review. This looks like a positive family-friendly “missing middle” approach, the only unfortunate part being the space and livability loss due to the need to accommodate cars. Alas.
Update regarding Downtown Livability Strategy
I brought a motion to Council back in October, asking staff to be proactive at addressing some short-term and longer-term livability issues in Downtown. This is an update report on short-term measures that have been rolled out in the last few months. Primarily the interdepartmental team (Engineering, Police, Fire, Bylaws, Planning) have been emphasizing tactics (things we can and need to do now) over strategies (things we think we might want to do). These include ramped up outreach to people living unhoused, have worked to connect with and support the businesses operating downtown, worked with partners to respond to the impacts of mental health and addiction on residents, and have worked to improve cleanliness and improve access to public toilets. Staff have been re-assigned and had hours adjusted to make these things happen, and there is a constant effort to evaluate and shift how things are done to get better results. There is also some medium-term work being addressed, such as better coordination with TransLink on the station areas and looking towards more permanent public toilet options.
There is a lot here in this report, but I’m really proud of how all the departments of the City are working together to best support the entire community here, and how partner agencies from the BIA to BC housing are engaging. It is ongoing work, but we are already seeing results. Now if Metro can get that damn sewer project out of the way…
Uptown Active Transportation Improvements Projects: Design and Engagement Update After a *lot* of public engagement, we are at a place where staff are comfortable moving forward with some concrete changes to the Crosstown Greenway and connecting this to the High School – a key Active Transportation connection. There has been a monumental amount of engagement here with alternate models demonstrated, it is time to get to work.
Some of the work is going to be done using less expensive material and a relatively rapid response (similar to the Agnes Street Greenway) that nonetheless provides protection for active transportation users. There will also be some loss of parking, which will no doubt disappoint some folks, but these corridors are vital for pedestrians, for transit users, and for cyclists (the transportation modes prioritized in our Master Transportation Plan), and displacing a few parking spaces is consistent not only with the MTP, but with our OCP and the City’s Bold Steps on climate action. If we are not willing to give up a block or two of reduced parking to achieve safe, protected, accessible active transportation, then we will never get there with any of those plans.
The following items were Removed from Consent for discussion:
Alcohol in Parks Program: 2021 Review
This report outlines the public feedback received on the alcohol in parks program last year. The feedback was overwhelmingly positive (more than 80% or respondents approve the program – a higher proportion of respondents than even told us they took advantage of it!) There is a slight bias towards expanding the program vs. shrinking it. Staff also did not note any increased workload, enforcement, or other problems. They are recommending keeping the program where it is, and looking to improve litter and recycling opportunities related to the areas of parks where the program is offered.
Amendments to the 2022 Schedule of Council Meetings
Staff have recommended a slight shift in Public Hearing dates, and I did not agree with this change, preferring we keep with the original schedule. With these changes we would have 7 ½ months without a Public Hearing. I don’t know what projects – affordable housing, rezonings, new developments – are on the queue for that period, but I am not comfortable with the risk of creating a backlog at a time when we are still facing a housing crisis, an affordability crisis, etc. The city needs to keep working and moving this important work forward.
BC Superweek Pro-Cycling Series: New West Grand Prix
There is a *lot* of uncertainty in regards to whether the Grand Prix can happen in 2022. As this race is part of BC Superweek, which is a professional event relying on Continental-level talent coming to BC to compete, we just don’t know what Public Health and travel restrictions will be in place in July. That said, it is unlikely that an event in Downtown New West can happen in 2022 as a couple of construction sites are in the way and the schedule for the Pattullo Bridge road closures in not yet certain.
So we have asked Staff to not yet give up on the race, but to continue to engage with the Superweek team to determine what a timeline to certainty is, and when we would have to commit time and resources if we chose to go forward in 2022. At the same time, Staff are asked to evaluate alternate locations for 2022 if the (epic, hilly, and unique) Downtown course is not viable. As talked about above, I want us to not shrink away from events if they can happen safely, as I think people need a reason to get together and celebrate their City.
So we are not committing to do it yet, but we are not yet committing to not doing it.
We then read some Bylaws, including adopting the following:
Development Cost Charge Reserve Funds Expenditure Bylaw No. 8307, 2021
As discussed on December 13, we need a Bylaw to authorize expenditures from the City’s Development Cost Charge reserves – the money developers give the city to pay for the infrastructure needs related to growth. This is that Bylaw, and it is adopted by Council.
Finally we had a Motion from Council:
Smoking Bylaws ReviewMayor Cote
THAT Council request staff to conduct a review and scan of smoking bylaws in municipalities in British Columbia and report back to Council with a preliminary assessment and options to enhance New Westminster smoking bylaws.
We made a few changes to our smoking bylaws around when the federal government legalized recreational cannabis, but these bylaws are a bit complex, here and in every other jurisdiction. We get quite a few complaints about nuisance smoke, so it is definitely timely for us to have a review and compare our Bylaws to what is happening around the region, and to see if there is anything further we can do to reduce these conflicts.
And that was it for the first meeting of 2022. Happy New Year everyone.
The first week of January is when the BC Assessment Authority releases their annual report on property values, including your personal assessment and regional trend data. More often than not, this is followed by some hyperventilation on line and in the media: How the hell does this keep happening? How unaffordable can housing get? What can be done? I’ll avoid those topics in this post* and let the media and pundits answer those in the way that serves their interests best. I just want to talk about New West, assessments, and taxes, since Council is going to be talking annual property tax increases on Monday.
The City is working towards a budget with a 4.4% tax increase. I’ve written about how we got to that number, and will write more after next week’s meeting, but until then I am going to assume that is what Council is going to vote for, and use that number as a placeholder to talk about the below.
A 4.4% tax increase does NOT mean your property tax bill will go up 4.4%. It might, but it is more likely to go up a little more or a little less than that, depending on what type of home you are paying taxes on, and how its assessment compares to the average across the City.
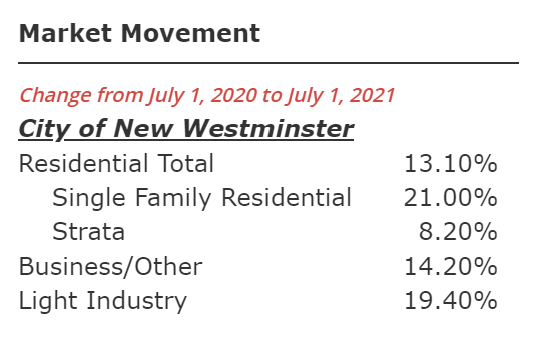
Here are the numbers from the BC Assessment authority for the “average” property in New West:All residential properties went up 13.1 %, but Single Family Detached houses went up more than this (21%) and Condos went us much less (8.2%).Since tax increases are based on the average value, this means taxes will be going up more for most SFD, and less for most Condos. Indeed, at the current proposed rate, the average Condo may not see any increase at all.
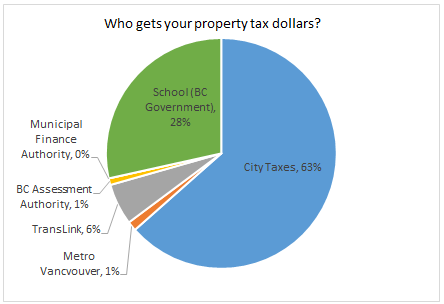
I’m going to use fake numbers to demonstrate how this works, because that level of detail is unnecessary to make clear how this works, and complicated math makes explanation complicated. This really isn’t that complicated. However, I note there are two confounding factors I need to mention here, because they matter. The City adjusts its tax rate based on all assessed land values, and I am only dealing with residential here, and am ignoring commercial and industrial. Also, I am only dealing with the part of your property tax bill (63%) that the City sets and collects, the blue part in this pie chart:
The rest is set by the province, and the City neither has control of it nor sees the money, so I can’t talk too much about them except to note they are there.
Ok, with those caveats aside let’s imagine the City collected $100 Million in taxes last year, and the combined value of all the properties in the City was $10 Billion. The City would need to set a tax rate (called a “mill rate”) of 10 to collect those taxes. This is the math:
($10 Billion in properties) / $1000 = 10 Million; ($100 Million in taxes) / 10 Million = (mill rate of 10)
As a property owner who owns, say, a $100,000 home, you use the mill rate like this:
($100,000 property value) / 1000 = 100; 100 x (mill rate of 10) = ($1,000 in taxes)
So lets then lets assume the next year the City Council decided it needed $104.4 Million to run the City, and therefore property taxes have to go up 4.4%. If the property values didn’t change at all, this would be simple, as the Mill rate will go up 4.4%:
($10 Billion in properties) / 1000 = 10 Million. ($104.4 Million in taxes) / 10 Million = (mill rate of 10.44)
But lets imagine, instead, that the City gets a report from the BC Assessment Authority that says the combined value of all properties in the City went up by 10% over that year. That changes the math:
($11 Billion in properties) / 1000 = 11 Million. (104.4 Million in taxes) / 11 Million = (mill rate of 9.49).
Taxes went up, but the mill rate went down, because the inflation in property tax was lower than the inflation in property values. This will be the case in New West in 2021 where average values went up 13%, but taxes are only projected to go up 4.4%).
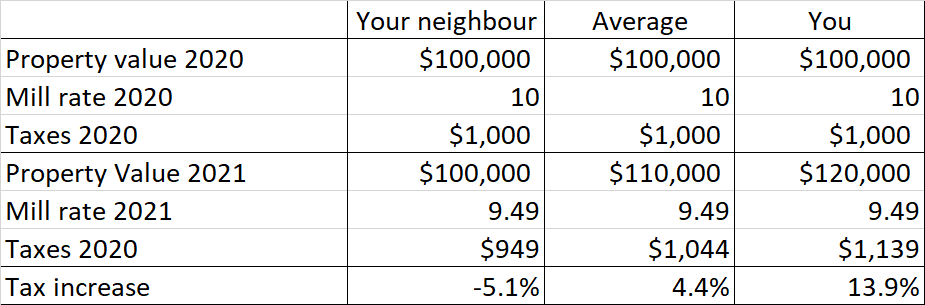
Now, we can talk about how that change in mill rate impact individual properties, becasue they do not all go up in value the same as the average. If in the last example (average property increase of 10%, tax increase of 4.4%) the property you own increases in value the same as the average, then the mill rate applies to you exactly as it does to the average, and you end up paying 4.4% more taxes. But what if your house goes up 2x as much as the average, and your neighbour’s house doesn’t go up at all? You end up paying a different amount of tax:
(remember, I’m using pretend numbers to make it easy to spot trends. Really, a typical home in New West was a little over $1 Million last year, the mill rate was 2.829, meaning a little under $3,000 in Municipal property taxes were paid on that home)
This will happen across New West this year. As the BC Assessment report that I mentioned in the opening showed that SFD houses went up 8% more than average of all city wide residential property values, so the 4.4% tax increase for the average SFD will be in the order of 12%. At the same time, the average Condo value increased 5% less than average, meaning that property taxes for the “average” condo should go down a little bit. If that doesn’t seem fair to you, all I can say is I didn’t invent the system, I just report it.
*(supply and demand; very unaffordable because the most comfortable are being made more comfortable through this; we can start building differently)
Addendum: The New West Record points out that the BC Assessment news release says the “typical” SFD home in New West went up 24% in value, which is a different number than the 21% they have in their Market Trends table or their interactive map (where my table above is from). Not sure what that is about, maybe a typo, maybe a mean-mode-median thing. Anyway, take the exact numbers with a grain of salt?
Not sure if this has been asked before but I was wondering Why New West has municipal/private electric vs Bc Hydro like our surrounding cities? Speaking with friends from other municipality, it seems New West has a higher cost per household? What are the pros and cons of having New West Electric? Thank you!
Yes, this has been asked before, and I answered here, so I suggest you click over there and read that first, because I’m not writing it all again. But that was more than 5 years ago, and the numbers have changed as has some of the governing philosophy. I’m on the Electrical Commission now (though, I hasten to remind folks, I don’t speak here for the City, or for the Electrical Commission; these are my own thoughts, not official communications!), and know a bit more about these things, so maybe a bit of an update to that post is in order.
New Westminster has had its own electrical utility since 1891, when a wood-fired steam turbine started spinning dynamos to provide street lighting in the City. Notably, a group of concerned citizens challenged the City’s legal authority to do this, and went all the way to the Legislature to complain about this extravagant spending (along with the ferry service to Surrey, the public library, an the waterworks), but the New Westminster Light Department prevailed, and 130 years later here we are.
What hasn’t changed: the New West Electrical Utility (NWE) buys electricity at wholesale and sells at retail. The difference between the two is mostly used to operate and invest in the utility, with leftover “profit” that is put into City coffers to add to operations of the rest of the City and offset some property taxes. In the 2020 Budget Reporting (the most recent available online, alas), you can see NWE made about $51M in sales, had about $39M in operational costs (mostly buying wholesale power), and invested about $7M into Capital upgrades (like that new substation in Queensborough), meaning about $5M was put into City operations. That’s $5M less property tax the City had to collect to provide services, or about $160 per household.
What has changed since that 2016 piece I wrote are the electrical rates offered by BC Hydro and NWE. BC Hydro rates are set by some confusing combination of the utility figuring out how exactly much money it needs, the provincial government telling them they can’t have that much, and the BC Utility Commission picking a number based on those two factors. As such, electrical rates have been unpredictable in the last few years, increases being promised, then being reduced, making longer-term financial planning difficult. The NWE process is the Electrical Commission determining how much they need to operate, and Council generally passing a Bylaw to support that (though Council have the power to not approve rate increases). In recent years, the Commission and Council have been more comfortable decoupling a bit from BC Hydro rates as a standard comparison to a model where they assure the capital needs of the Utility are secure for the future (see big substation build in Queensborough) and that rate increases remain more stable as opposed to big increases one year and smaller increases the next. With the BC Government getting support from the BCUC to reduce scheduled rate increases, BC Hydro is in a situation where rate increases are being deferred into the future.
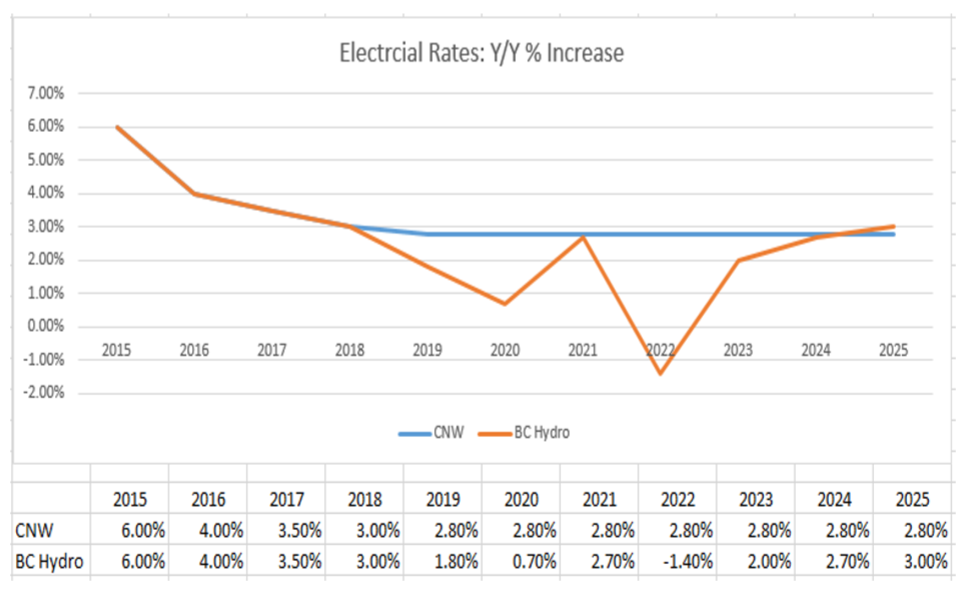
The upshot of that is that NWE rates are currently going up slightly faster than BC Hydro Rates, though we fully expect BC Hydro will need to catch up to us in the near future. This was demonstrated with the following graph in our recent Council budget deliberations:
I note that 2023-2025 rates, both BC Hydro and NWE, are speculative right now, and BC Hydro will face the need to pay for some significant infrastructure soon, so it is generally thought BC Hydro will catch up to NWE within the current 5-year plan. In the meantime, we have some capital expenses that cannot wait (did I mention that big substation in Queensborough?) and will be able to re-evaluate comparative rate increases on a year-by-year basis.
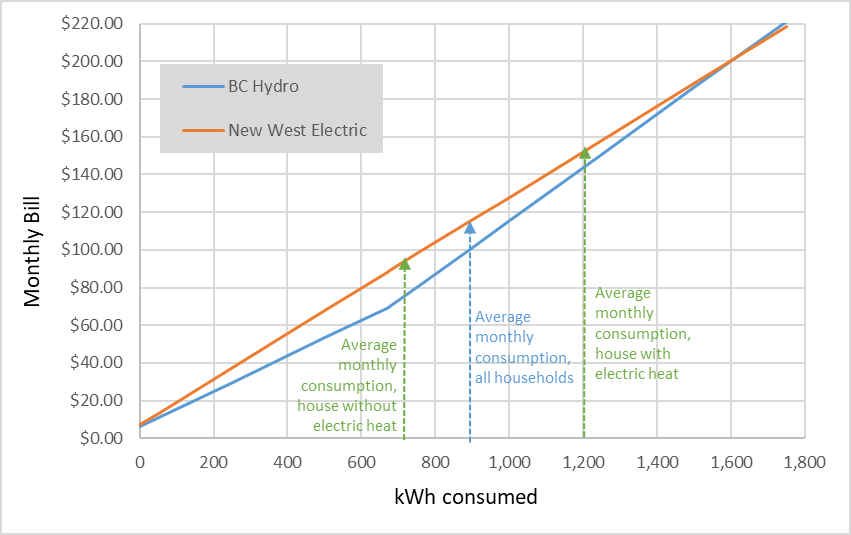
The upshot of all this is that rates for NWE have gone up a bit compared to BC Hydro. I drew a comparison chart back in 2016, and did my best to recreate it using the proposed 2021 rates:
The shape of the chart has not changed, but the gap has increased a bit. That means for the “average” household in New West (assuming their energy consumption is the same as the average for BC) pays about 14% more for their electricity every month than the BC average. This gap gets lower the more energy a household uses, in that BC Hydro’s scaled rates “catch up” to NWE rates. The difference, again for the “average” household is about $160 a year, which almost exactly offsets the “average” property tax savings per household. Rate differences for households more than a standard deviation from “average” – who use much more or much less than average monthly electricity – are are probably pretty small. All “averages” are in quotes here, because I don’t want to get into the discussion of means and medians, or the differences between a $500,000 condo and a $2,000,000 house when it comes to property tax burden and electrical consumption, but it is fair to say the structure we have now slightly benefits larger households, but perhaps incentivizes electrical conservation.
Even if the rate gap is such that there is no longer a financial advantage to having our own utility, there are arguments for the utility aside from financial. By owning poles and rights of way, the City can leverage that for its own purposes, from BridgeNet to negotiating with Telecoms for pole space. By selling electricity to transportation providers, we have access to Low Carbon Fuel Credits to fund climate action. The structure of the Utility may lend itself to a more efficient operation of a District Energy Utility. Because of NWE, we have ability to manage our own Net Metering, allowing people to co-generate and easily sell their rooftop power to the grid, and even allowed us to create two successful and operational Solar Gardens for those without sufficient roof space. There are also opportunities for NWE to lead, as the community and the province shift to electrification to meet our Climate Action goals, such as piloting Street Light EV charging or rolling out Heat Pump incentive programs to get homes off of fossil gas. We also have one of the most reliable grids in the province, with faster response to power outages, and fewer and shorter outages than in most places in the Province.
Hi Pat – Looking forward to the AAA bike network coming to NW in the next 5 years. I’m looking into an e-cargo bike for our family but my biggest blocker is bike storage. I live in a building over 50 years old that does not have secure bike storage (but I have 2 parking spots that I don’t use since we don’t have a vehicle…). Wondering if there’s anything that the city of New West can do to incent existing stratas to invest in better secure bike parking? Or allow owners to convert their parking stall into secure bike parking without having to get approvals? On a related note I also wanted to see if there were any plans to convert on street car parking spaces to secured bike parking/storage? Even if this was a paid service that would be something hugely beneficial to us.
Oh, boy, you got me writing about bicycles. Better put on a pot of tea.
If we can get Council to commit to completing the AAA network, End of Trip facilities (EOT) are clearly the next big infrastructure challenge when it comes to supporting active transportation. With the shifts in the types of devices people are using, it is clear that even the best plans of a few years ago are not going to be sufficient if we really want a wider mode shift in the community. So let’s go through a few of the new challenges, and how a Local Government can help solve them.
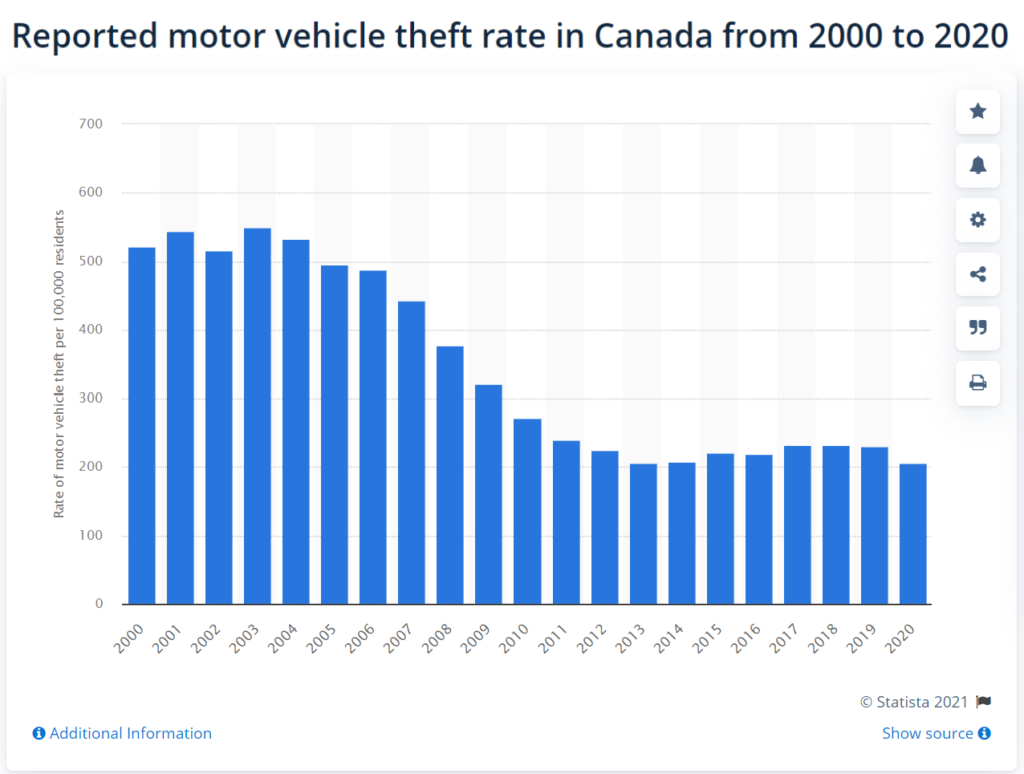
Bike theft is currently a huge problem regionally, in a way that car theft was 20 years ago. I seriously doubt that our Motordom-entrenched law enforcement and insurance agencies are going to get as proactive in battling bike theft, so the arms race of tougher locks and more secure storage options are really our only option.
Bike storage at home is another area where multi-family needs a different approach than the single family detached home. Bike rooms in the traditional sense are a basement room with a few racks, mostly filled with dust-accumulating Canadian Tire specials with two flat tires, hard to access, not particularly secure, and really inconvenient to use. Meanwhile, apartments are not built large enough to store a couple of bikes, and random Strata or Rental rules inexplicably restrict bicycles in hallways and elevators.
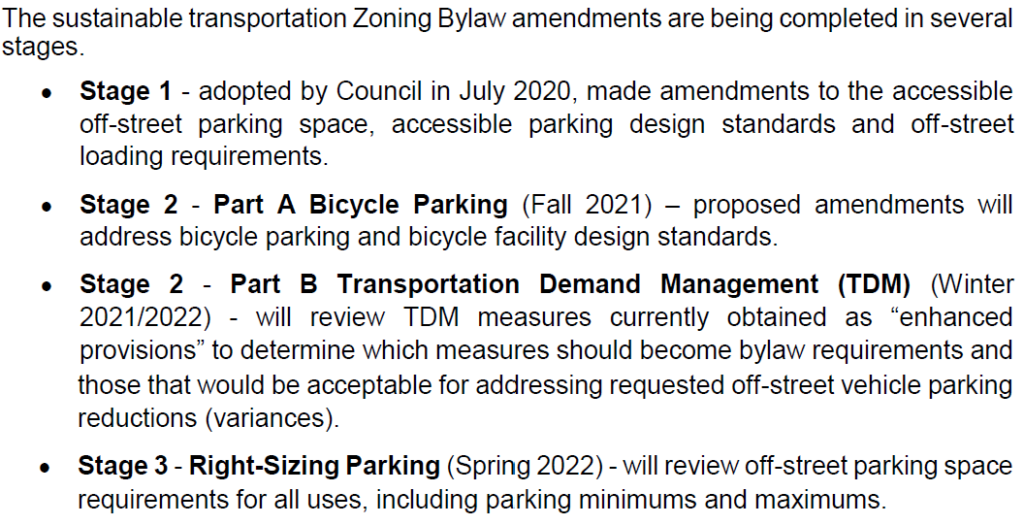
As with many other structural changes in housing, we can do more about new housing than the existing housing stock, so the City is able to create new standards for Bike Storage rooms, like New West did a few months ago. The City is currently making a suite of changes to the Zoning Bylaw to make sure our Zoning requirements align with our transportation goals. We can do this through zoning because of the exceptional powers zoning gives local governments, and that includes adding “red tape” like this. Here is the plan for the current changes (from the October 18 Council report):
In November, we adopted the Stage 2 Bylaw changes that make bike parking locations as convenient as possible for users, improve security given cost of e-bikes and other non-conventional bikes, ensure oversized (e.g., cargo) bike sizes are better accommodated in new housing.
Of course, that does nothing for the existing building stock, and the City has really limited powers here. Bike rooms in the traditional sense don’t work- not big enough, not secure enough. Getting a strata or rental company to invest in making them function better is a really, really hard. Stratas have a lot of power, provided by the Province, to set their own Bylaws. It is difficult for a City to enforce in that space, and I honestly don’t know if the City could force a Strata to provide better accommodation to cycle storage, you need to take that up with your Strata Council. Though the City has recently had some success using our business regulation powers to change how rental property owners operate (to prevent unnecessary renoviction), It was a challenge, and I’m not sure the City is going to push that leverage to regulate bike storage rooms.
Storage in underground parking also presents security challenges, and similarly runs up against Strata or rental bylaws. I have even heard (anecdotally) of the Fire Department recommending against storage of stuff in general (and cycles as a subset of “stuff”) in underground parking garages during fire inspections, though it would be difficult to argue that the most flammable bicycle (I’m looking at you, Vitus Carbone) presents less of a fire risk than the most modest automobile fuel tank. However, if we put aside how to get there, I think the most affordable and secure solution for most of the exiting building stock is secure bike lockers in existing underground parking garages.
As far as incentives? The City is pretty limited by the Community Charter as far as giving financial or tax incentives to individual Stratas or rental companies that would encourage them to provide better storage solutions, but perhaps the best we can do is get out of their way if they want to take this path, such as allowing them to reduce the amount of parking they have on site if they convert that space to cycle storage options. Though I would argue incentives to Stratas willing to invest in secure cycle parking is a better idea and more equitable than investing in incentives for individual bicycles like some communities are piloting.
Creating better public short-term storage solutions is also something the City can do. Some of our Parklets have attached cycling parking, and that is definitely something we can do more of as we work on Bold Steps 2 and 7 in our Climate Action Plan. I’d also love to see more the bike locker type storage that TransLink has been doing for years, where the security of storage problem is fixed, even if their lockers don’t really work for your cargo bike types.
Finally, bike share solves part of this problem. The North Shore communities got ahead of us on this pilot program, but we are watching closely how it works out. E-bike share reduces the need for people to invest in expensive and hard-to-secure vehicles, and allows them to instead spend a few dollars a trip on the most common type of e-bike trip – a kilometer or two to a relatively nearby rapid transit or shopping destination. New West is uniquely located along a heavily used transit line, with hills separating much of our community from it, and a high enough multi-family housing density to make a program like this work.
But all of this also relies on us getting that AAA network built so more people feel safe using these devices. This needs to be baked into our 5-year financial plan, similar to how Victoria got their network build over the last few years. Shifting how we move around to meet our livability and climate goals will rely on both of these.
Curious to know where the city is at with it’s tree planting roll out for street trees. Sapperton residents would appreciate and benefit from some shade. I live on Simpson and have been asking for street trees for 5 years. Many thanks
Short answer: As far as I can tell, New Westminster is on pace, or slightly ahead of pace, on the tree planning strategy approved in 2020, and the good news is that Simpson Street is a high-priority street for planting, so you should hopefully see new street trees in the next year or so.
The City is planting a lot of trees. This followed on a few years of working on an Urban Forest Management Strategy that is one of the things I am most proud of during my time on Council. After decades of a slowly eroding tree canopy, the City committed in 2016 to turning that tide, and going from 18% forest cover (measured in 2014) to 27% cover by 2035.
A 9% increase in tree cover might not sound like a lot, but it would require an additional 8,500 trees planted on public lands and 3,300 trees planted on private lands. That means more than 800 new trees a year, not including the trees we needed to replace any lost through development and natural tree death. There are four strategies to get there: A proactive Tree Bylaw to protect as best we can healthy mature trees on private property; incentivizing private tree plantings through tree sales and promotion; investing in urban reforestation where opportunities arise such as parklands; and committing to an aggressive Street Tree planting program. The last two of these are supported by our 2020-2030 Tree Planting Master Plan.
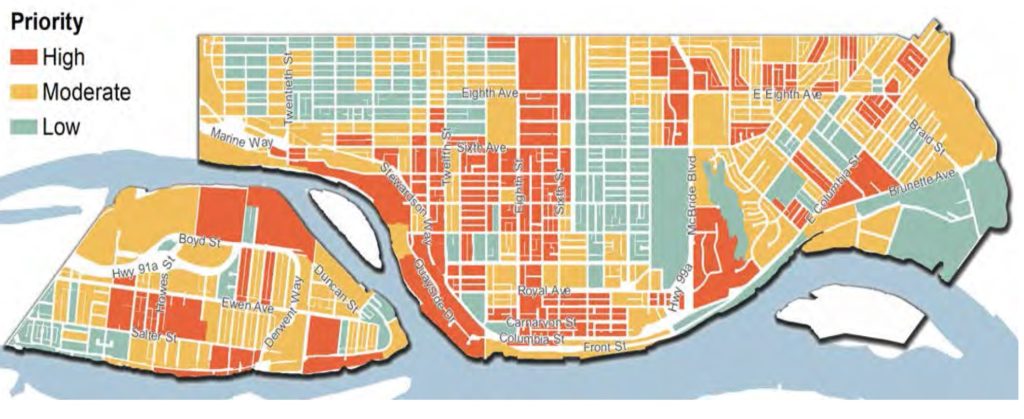
That plan is a great read, and I like how staff prioritized different parts of the City for faster planting. Recognizing that tree cover is inequitably distributed round the City, and that it would be better if we more evenly distributed that social, health, and economic benefits of tree canopy cover, staff used a GIS system to map out a few measures. Along with measuring areas with less trees, they also prioritize multi-family neighbourhoods to put more people near trees, neighbourhoods with more seniors, and areas more susceptible to Urban Heat Island effect. Overlaying those layers, and higher vs. low priority areas stand out:
It is also worth noting, this isn’t just about going out with a back hoe, digging a hole, and plopping a sapling in the hole. Trees need some significant support to prosper in urban areas, especially in the first few years. With asphalt and concrete everywhere, there is not enough healthy water-and-nutrient-providing soil around a tree in many areas, so a soil cell needs to be constructed to give the roots a chance to establish. Trees are sensitive to drought and frost and wind until they get established, so they need watering, they need pruning, and other care in the first few years. If we lose 10% of the new plantings every year, we are doing pretty well. They also need to be planted mindfully so they don’t tear up the sidewalk next to them, or mess up the sewer lines under them. And with climate change, we need to be cognizant of the species planted and the diseases and pets that are endemic. For our tree strategy to be successful, we needed staff dedicated to this work.
Fortunately, we are getting grants both large and small to help us with this work, and are committed though our Climate Action Strategy to continue to fund this work. It also helps that we have both staff and a Council who recognize that planting a tree today is an investment worth making so we have a better community 20 years down the road.
As for that block of Simpson Street between Columbia and Richmond: there is an identified paucity of street trees there, which means you will be getting those street trees sooner than some of the rest of Sapperton. It’s that red block in the picture above. Of course the overhead power lines are on the north side of the road. That means more diminutive trees on the north side but the south side should be able to host full-sized trees, and provide a lot of shade across the street. I’m assuming (but don’t know for sure) that there are no utility conflicts under the boulevard that would limit root fecundity. And it looks like the City is planning hop hornbeams and Chitalpas. So spring flowers to boot!
From researching the OCP and Downtown Community Plan it looks like Front Street generates a lot of noise pollution and significantly reduces the air quality for residents due to the freight trains and trucks that use it. There have been talks of eventually encapsulating the train tracks and Front Street and even the zoning bylaws or OCP states the buildings should be compatible with encapsulation. Toronto looks to be doing something similar and placing a park on top.
I realize that encapsulating tracks and Front Street will be very expensive and is likely decades away (Frankly I’m skeptical that it’ll happen in the next 25 years) Any idea what the City has in terms of timeline, vision and potential land use on top of the structure? If the idea is dead in the water/a pipe dream/no longer part of the City’s vision what are the City’s plans to address the safety, noise, and pollution in the downtown area?
Short answer is the idea is no longer part of the City’s vision for the waterfront.
Over many decades, there were various vague plans to build over the rail lines on the waterfront and/or Front Street. I’m not sure when this idea was first floated, but with the de-industrialization of the port and re-imagining of the entire downtown waterfront and Quayside starting in the 1980s, a lot of visions came and were either realized or went away when a new vision came along. Looking through old City planning documents from the last half of the Twentieth Century, you can see some of the encapsulation schemes that were sketched up. Some frankly fanciful.
It was never (to my knowledge) costed, and it was not clear who would pay the monumental cost. Its also not clear if the railways would agree to encapsulation or if the Ministry of Transportation would agree to a regional truck route that did not permit hazardous materials (because they are not allowed in tunnels). I don’t think anyone was concerned about what happened to the businesses and historic buildings that face Front Street. The vision seemed to rely on the entire waterfront, from the River Market to the Pattullo Bridge, being converted to residential towers, at least a dozen of them. These were pencil-sketch concepts, and I’m not sure there was ever a real understanding how to get there.
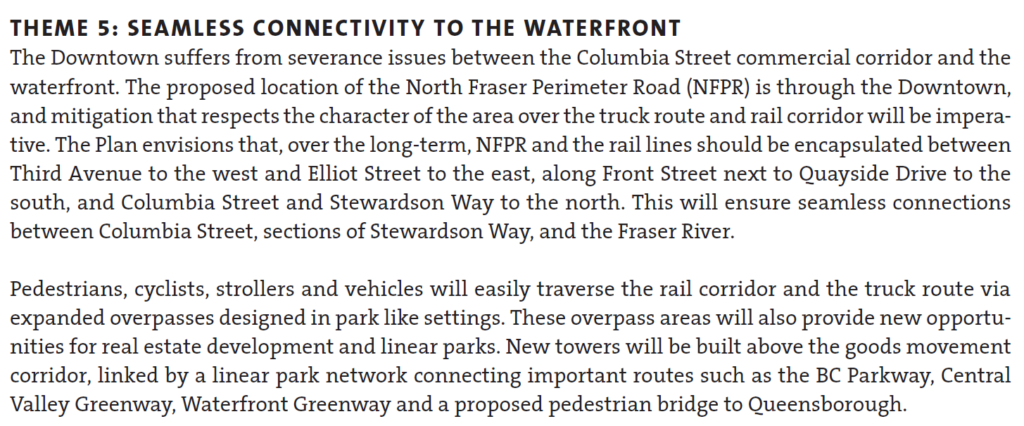
As recently as 2010, the conceptual idea was still bouncing around, as it worked its way into the Downtown Neighbourhood Plan – the planning document that serves as the Official Community Plan for the area below Royal Ave. When the new OCP was adopted in 2017, the Downtown Community Plan was included as an Appendix – as placeholder until a new Downtown Plan was developed. And it included this:
Since then, events have unfolded, and these became the proverbial best laid plans. I would suggest the one event that was more significant than any other was the demise of the North Fraser Perimeter Road (NFPR).
To understand the encapsulation idea, we need to understand the NFPR. There was a vision around the Turn of the Century (can you believe that phrase applies to 20 years ago!?) to shift more of the riverfront landscape of the Lower Mainland to “goods movement”. The so-called Gateway Program required the building of two limited-access high speed freeways, presumably to service trucks, but open to all traffic on either shore of the river. The South Fraser Perimeter Road was built, the NFPR was not. Primarily because of the horrifying impact on New Westminster.
The vision for the NFPR was 4 lanes, limited access, from a new expanded Brunette Interchange to the Queensborough Bridge connecting east and west to (not really clear). This may not sound so bad if the road is encapsulated from Elliot Street to Third Ave as suggested in the clip above (requiring, I note, the longest road tunnel in Canada), but what about east and west of there? There also existed the not-insignificant problem of pinch points like the historic Station building (Kelly O’Bryan’s) and interface with the SkyTrain guideway. Between the (federally regulated and not going anywhere) rail lines and other not-easy-to-move infrastructure, there simply wasn’t room for four lanes of traffic, buried or otherwise.
And there was the wider context of what it means to our community. If encapsulation addresses noise and fumes downtown, the NFPR only increases noise and fumes in Sapperton, in Fraserview, in the West End. And as more lanes always induce traffic, the knock-off traffic impacts on our surface roads would, if every other example in the history of building roads in cities has demonstrated anything, destroy the livability of many parts of the community within the noise-and-exhaust shed of the NFPR itself. Don’t get me talking about the Braess Paradox and Induced Demand.
The NFPR was a bad idea, and needed to be killed. It was killed in 2011 when TransLink proposed spending a couple of hundred million dollars on a key eastern connection to United Boulevard, and the community recognized it for the community-destroying freeway plan it was. I am really proud of the community who stood up to stop it, and the Council of the time (long before I was elected) that made it clear to senior governments that this was not on. We literally saved the City back in 2011, and TransLink went on to fund better things, like MOAR SKYTRAIN.
So without the NFPR, a different set of decisions had to be made. When it came time to invest in maintenance and upgrades to the Front Street Parkade, the lack of an NFPR meant we were able to right-size the structure by removing the older half of it, daylight some business fronts, and create a new public space. When the design for the Larco Parking Lot (now Pier West by Bosa) was being re-evaluated, we no longer wanted or needed an elevated podium cutting people off from the River, and were able to leverage another couple of acres of public park space for the Downtown. As we adopted whistle cessation downtown, as we design a new accessible pedestrian overpass to Pier Park, as we look at upgrades to the McInnis Overpass, as we plan greenway improvements along Stewardson, etc. etc., it is about planning for something that fits our community needs and connects our community better, not accommodating 4 lanes of high-speed truck traffic to slice our community in half, using an unbudgeted, difficult-to-realize, and half baked encapsulation idea to soften the blow.
The language in the Downtown Neighbourhood Plan has not been updated to reflect this change, but the planning we are doing around downtown certainly has. For the better.
If my reading of the City of New West website is correct, the Floodplain Management Strategy – Feasibility Plan is 10 years old. It also says that the City prepares for the possibility of flooding on “an annual basis”. In the light of recent floods in the area, and climate change at large, should New Westminster be doing more to prepare and prevent the likelihood of flooding?
The short answer is probably yes, in that recent events from the Heat Dome to the Fraser Valley flooding has demonstrated that there are gaps in local and regional emergency response schemes, and it might be worth a pretty comprehensive review. But I’m going to put that larger “emergency management” part aside here, because you asked specifically about flooding. I think we are in pretty good shape for the *likely* flood scenarios in the near future, but it gets murkier the further out we look.
As a caveat, I’m a geologist and physical geographer by academic training, but I am not an engineer. That means I know a little too much about the physical causes and mechanics of flooding (I can wax eloquently about Reynolds Number or identifying back-basin deposits in the rock record) but not quite enough about the engineering practice of managing floods. So nothing below here should be thought of as engineering advice or advanced engineering knowledge. You gotta pay somebody with a P.Eng. for that.
The Floodplain Management Strategy really addresses one type of flood risk we have in the City, that of freshet flooding of the Fraser River. We have another couple of risks not directly addressed by that strategy: seasonal or flash flooding on the Brunette River, and localized intense storm events like recently occurred causing minor localized flooding on Quayside Drive, which I would call “upland” floods, because they are not caused by the river rising so much as water not getting to the river fast enough. They all need different approaches, and the risk factor of each will be impacted differently by Climate Change.
As far as the Fraser River flood, this is the area I think we are most prepared for in the medium-term. The oft-mentioned survey of dike conditions report from a few years ago, circulated more widely during the current Fraser River flooding episode, makes New West look pretty good, comparatively. The Crest Elevation and Dike Assessment ratings are generally fair to good, comparable to Richmond and very far ahead of most other municipalities along the river. There has been a lot of work done since that 2005 report to improve both the dike (mostly along with new adjacent developments) and the ability to pump water out and over the dike during intense rain or if there is some local wave wash overtopping during a Freshet flood event. Just in the last couple of years, we have spent millions on upgrading the Wood Street and Boundary Road pump stations to bring them up to modern capacity need and seismic standards.
That said, from a geography sense, Fraser River freshet floods are not likely our biggest concern on this lower part of the river. Here, the water height varies more by tide and storm surge cycle than by freshet cycle. The concern to plan around is not a single spring freshet that is larger than others (like the 1894 or 1948 floods), but a significant low-pressure storm coming though during a king tide around the time of higher-than-average freshet. It is perhaps macabre to think about it, but am 1894-style freshet will likely cause dyke breaches from Hope to Langley, and this extra water storage capacity on farm land and in those more vulnerable communities may serve to reduce the danger further downriver like Queensborough and Richmond. Dike planning needs to be holistic and address the entire estuary, and that is the most common call for every community along the Fraser. There is even a model in place, we just need to fund it.
The Brunette River is a bit more complicated. It has a different freshet than the Fraser River and it is more prone to intense local storms, but the lower reaches are also impacted by flood stage in the Fraser. There are very few homes impacted by a Brunette River flood, but the Braid Industrial Area may definitely be affected, and there are areas of it not protected by any meaningful dike. This is an area where the City puts a lot of emphasis on tiger dams and sandbags if floods are predicted, but the complexity of the jurisdictions here (rail lines are federally regulated, cannot really be “raised” and rail beds are pretty permeable to water; a large part of the waterfront belongs to the Port of Vancouver, so we couldn’t dike it if we wanted to) meaning proactive measures are much harder to coordinate.
Upland floods from intense storms are much harder to predict, and the engineering solutions are daunting. There is only so much underground storm sewer pipe capacity, and though we are currently investing a lot of money in new storm sewer infrastructure, there is always a cost/benefit math around adequate capacity for very low-recurrence events. We are also investing more on “green infrastructure” such as groundwater infiltration, permeable surface treatments and trees, in hopes we can locally capture more of the storm water and reduce the “peak” of the most intense storm flows. But none of this fits in the Floodplain Strategy.
Where the report you read talks about “annual basis” planning, that means every year (starting in the late winter) we get regular updates on snowpack and predicted melt rate across the Fraser River basin. That is modelled into predicted flows in the month ahead, and we prepare flood response based on those numbers. If the freshet forecasts start to look floody, we start procuring and organizing response materials (tiger dams, sandbags, sand, pumps, etc.) well ahead of time. In my perhaps hazy recollection of 7 years on Council, we have gone so far as to deploy sandbags in the Brunette River area once, and had no river-sourced flooding. So the “annual basis” is around temporarily protecting low-lying areas and prepping for a flood if it is likely to occur, and in no way replaces the medium-and longer term dike upgrades, pump capacity, and storm sewer investments we need to do.
Now, about Climate Change. In general, engineering practice now accounts for it, in as good as they can. Though that means different things for each of the different risks. Add to this a major challenge of estimating or modelling the various impacts Climate Change will have on everything from local storm intensity to snowpacks in Cariboo.
The current models suggest intense rainfall events and rain-on-snow events will become more frequent in our part of the world with climate disruption, both likely to increase the frequency and possible intensity of upland floods and Brunette floods. I guess the upside is that these are likely to be more localized with limited damage (which doesn’t make you feel any better if it is your home or business that is local damaged).
Research from a few years ago (and I honestly have been not keeping up, so this may have changed) suggests that peak freshet flows in the Fraser may actually be lower on average, even as annual average flow goes up a bit over the next 75 years. So floods that meet our design levels may actually become less frequent.
The problem is, we are in the tidal range of the river, and sea level rise will most certainly impact New Westminster. The current Provincial Guidelines are to design dikes for a 50cm increase in sea level, putting dike standards where we previously expected sea level change to get by 2050. More recent research (for example, by the Research Council) suggests we will be past there by 2050. The detail of raising dikes an extra 50 cm is actually not a small one, but at least New West is not alone in this. Which is why many communities (including New West) are calling for a return to basin-wide flood and landuse planning along the shores of the Fraser River Estuary in a FREMP-like model as I linked to above.
The elephant in the room is the worst case scenario, and this is a global concern, not a New Westminster one. If we have 50cm of sea level rise by 2050, we can and are planning for that. Some of that adaptation will be expensive, but we can see how to get there. By 2050, we should have an idea of how to address 1m sea level rise anticipated for 2100, though that will bring new engineering challenges, and perhaps some uncomfortable discussion about triage: what lands we protect, what lands we abandon. However, worst case scenarios for sea level rise past 2100 are dire, and frankly very difficult to plan around. The planet with 3m of sea level rise is a very, very different planet. Most major cities are at least partially inundated, most currently ports are no longer functional. The global economy is not the one we have today. From an engineering perspective, this is not something we can plan for, and the people planning today will not be the ones planning for that eventuality.
This is why we still, while facing inevitable climate change, need to work to reduce the scale and impact of climate disruption. The battle against Climate Change is not over because it is now inevitable, the race is now afoot. Every tonne of carbon we keep out of the atmosphere today is a reduction in inundation we will see post 2100. So in that sense, our long-term flood management plan is probably best seen here.
I said I was going to spend some of the holidays clearing the Ask Pat Queue. Here we go with the first one from a drummer of some note:
Heflip asks—
The development on front street along the river’s edge…the underground portion being well below water level…is this a smart idea? Some engineer somewhere thinks so I suppose. I guess we’ll find out if it sinks or not.
I assume you are talking about the Pier West project currently under construction at the foot of Begbie Street. Indeed, the history of the site, going from 5 towers to three to two, from over 1,000 units to under 700, from an elevated parking pedestal to below-grade parking, and the attendant public benefits is outlined in this previous blog post from around the time the current iteration was approved.
But you asked about engineering and water.
Yes, engineers think it is a fine idea, if a bit complicated and expensive. I am not an engineer, or even an engineering geologist, but I know just enough to recognize the engineering of this site probably looks more challenging than it is. The building is not built on soft riverside sediments, but is within them, and rests on a series of piles driven into well compacted glacial sediments and pre-glacial rocks (probably Huntington Formation?) that are not as far down here as people might think. Around the Lower Mainland and the world, there are many buildings on piles in much similar or more challenging conditions. Just in the photo above, there is the Alex Fraser Bridge, every tower on the New Westminster Quayside, and the dynamic loads of those container cranes at silos at the port. The engineering of doing this work is really, really well understood by people who do that work, and seismic standards for this type of construction are remarkable. The buildings will almost certainly not “sink” any more than any other building built in the 21st century in the Lower Mainland.
Secant piles that will keep the underground garage and the river from interacting. Those numbers are “feet to the bottom”. They go a long way down.
The portion that is below grade is the parking structure, both for the building occupants and public parking for the adjacent park and commercial areas. By pushing the parking below grade, we were able to negotiate more than 2 acres of public park and waterfront boardwalk space, which will be a huge shift in how the Pier Park operates. The City will finally have a realized riverfront plan.
Parking “below the river” is an interesting visual, but again, not as challenging as non-engineers may presume, and not that unusual. Many of the buildings in the Quayside on New West have parking garages that are below the top of the river, especially during flood stage. The Secant Pile wall you can see on the site is a well-established construction technique that is very well understood by generations of engineers by now. The location of this structure is perhaps dramatic, but most large buildings with significant underground garage structures are in a similar situation, in that the lower levels of the garage are below the groundwater table, and are surrounded by water-saturated soils that would love to flow into the garage. Some manage this by actively pumping away the groundwater. But more commonly now, they just build the garage as a “bathtub” that is effectively waterproof, with a few sumps and pumps to address any minor leakage or seepage.
The building is also built to the currently required flood level, including anticipated sea level rise effects related to climate change during the life cycle of the building. But that gets us talking about floods and sea level rise, and I have another Ask Pat in the queue about that, so stay tuned.

 All residential properties went up 13.1 %, but Single Family Detached houses went up more than this (21%) and Condos went us much less (8.2%).Since tax increases are based on the average value, this means taxes will be going up more for most SFD, and less for most Condos. Indeed, at the current proposed rate, the average Condo may not see any increase at all.