Our first real meeting of the new term was full of interesting Agenda items, but we managed to get through them fairly quickly, even before the Public Delegations began.
The following items were Moved on Consent without discussion:
Queensborough Electrical Substation Loan Authorization Bylaw and Temporary Borrowing Bylaw
It is time for the Electrical Utility to build a new substation in Queensborough to deal with increased loads on that side of the river. The Electrical Utility is self-funding, so the capital cost of the substation (approximately $30 Million dollars) will be paid by electrical customers through their regular electrical bill, which requires that we borrow the money and amortize the cost of the construction over 20 years. The City cannot borrow money beyond the 5 years of our financial plan without specific authorization from the province and the public. So we are starting that process.
There are actually two Bylaws here. One will allow us to temporarily borrow up to $30 million dollars (“temporary” being within the 5-year financial plan) to provide the electrical utility access to the cash they need to hire contractors to do the work and pay them at the time they need to hire and pay contractors. The second is to do a long-term (and hopefully lower-rate) infrastructure loan through the Municipal Finance Authority so we can amortize up to $30 Million debt over 20 years. In short, we pay the contractor with the first loan, then pay off the first loan with the long-term loan, because it will cost less in the long run.
Revenue Anticipation Borrowing Amendment Bylaw No. 8038, 2018
Let’s for a few moments do the dangerous thing of comparing municipal finance to your household finances. The City has a chequing account to pay for day-to-day operations. From salaries to asphalt to photocopy fluid, it all gets paid from this chequing account. Much of the money going into that account arrives in a short period of time around Tax time, but much of it trickles in over the year through fees, senior government grants, etc. We are required (by law) to balance our budget at the end of the year, but it is possible that at some point through the year we may be in a negative cash position because we need to write more cheques in, say, April, than the money we take in that month. In this case, we may need to borrow money for a month or two until those tax cheques start arriving. As a City, we cannot borrow money without a Bylaw authorizing us to do so. So every year, we pass this “revenue Anticipation Borrowing Bylaw” which gives our finance staff the authority to borrow in the short term so we don’t go overdraft.
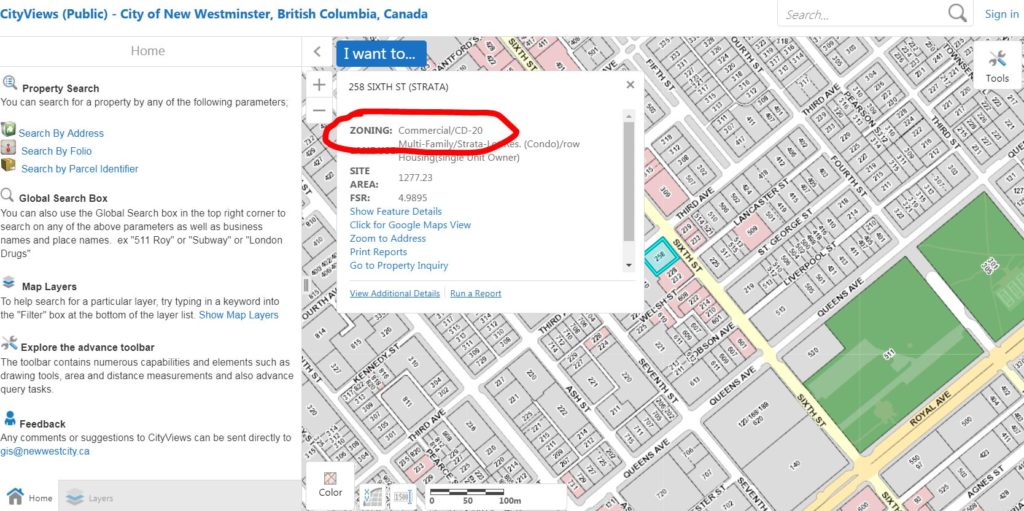
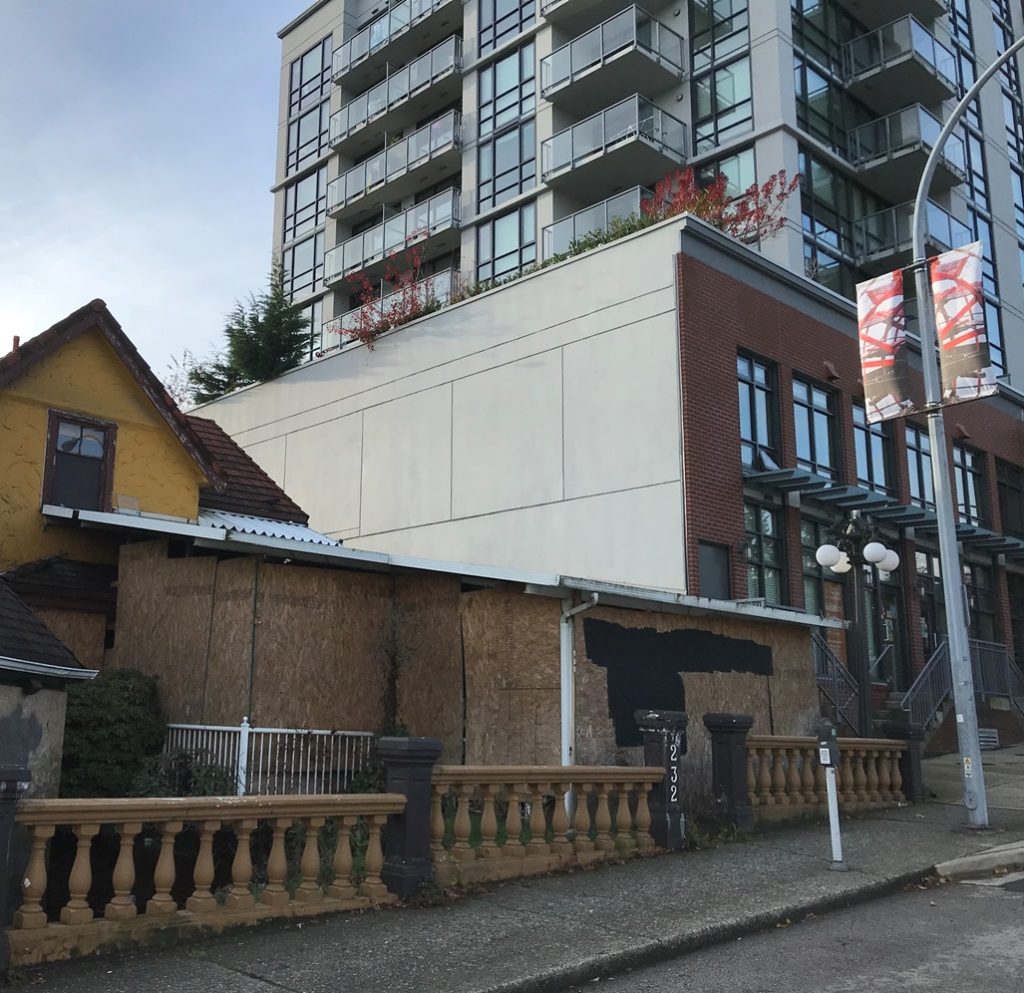
618 Carnarvon Street: Development Variance Permit No. DVP00656 to Vary Sign Bylaw Requirements – Consideration of Notice of Opportunity to be Heard
There is a development property in Downtown that installed signs that, by the most generous interpretation of the Sign Bylaw, do not comply. When staff informed the developer of this, they applied for a variance.
There is a bit of nuance here, because the printed copy of the sign is within the size allowed by the Bylaw , but the very large white space of the sign is not. In theory, the developer could have painted the wall white (which is exempt from the sign Bylaw) and put a regulation-size sign up and the result would be indistinguishable from the current situation. Alas, after the fact, a variance is the best way to deal with this, and there will be an Opportunity to be Heard at the December 10, 2018 meeting. C’mon out and tell us what you think.
Engineering User Fees and Rates Amendment Bylaw No. 8058, 2018
There was a typo in the Bylaw we gave Third Reading last month, so we are going to rescind that Third Reading, and do another one with the edited Bylaw.
1209 – 1217 Eighth Avenue: Rezoning and Development Permit Applications for 22 Unit Infill Townhouse Project – For Information
This is a preliminary information report to let Council know that this project is going through reviews and public consultation. The project is the first larger Infill Townhouse project that Council has seen since the changes in the OCP, so there will be some curiosity about how the project develops. As the project will eventually work its way to a Public Hearing, I will hold my comments until that time.
The following items were Removed from Consent for discussion:
2019 – 2023 Draft Financial Plan – Utilities
Right back at it in the first meeting of the new Council, and we need to keep the process for the new budget rolling.
Utilities are self-supporting in the City. Water, sewer, and solid waste are paid for through utility fees, including a significant amount of money put aside in their capital reserves in order to fund ongoing and anticipated capital upgrades to the aging infrastructure. The Electrical Utility is slightly different, because it makes a profit and pays a dividend to the shareholder (the City) every year.
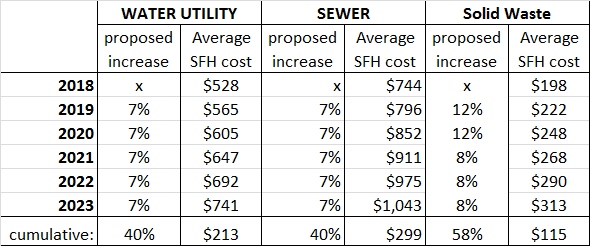
Water and sewer increases are pretty much what we have been anticipating. The cost of capital improvements and maintenance locally (the higher-than-inflation increased cost of replacing old pipes in this super-heated construction market) and regionally (we are building many new and improved sewer treatment plants and water supply infrastructure, as both federal standards and public environmental expectations are higher than ever before) means these rates will continue to grow slightly faster than CPI for the foreseeable future.
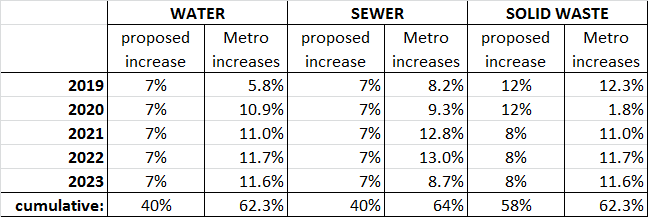
No doubt 7% increase a year looks like an unsustainable path for many homeowners – this culminates to a 40% increase over 5 years, but the regional water rates are anticipated to go up 62% in the same time, and sewer rates by 64%. So our local rate increases are actually lower than the regional trends.
Solid waste increases have been very modest over the last few years, even below CPI, but those good times appear to be coming to an end. There are some significant problems in the regional solid waste system, including issues with managing the organics stream (with a major Richmond facility shutting its doors in 2019) to ongoing issues with provincially-regulated EPR programs dealing with plastics and printed paper. The amount was pay per household in relatively modest for the level of solid waste service we receive, but with increases averaging 10 percent over the next 5 years, we may want to have another conversation about waste reduction and diversion education, and perhaps enforcement, to reduce tipping costs.
Now on to the tough one. I am not currently willing to support increasing our electrical fees above what is charged by BC Hydro to customers across the borders in Burnaby and Coquitlam. The electrical utility provides a dividend to taxpayers in this City, which is one of (not the only) benefits of having an electrical utility. However, it is much harder to argue that we should continue to offset property taxes by expecting electrical customers to pay *more* than the market rate for electricity. I think that represents a change in practice (if not policy) that requires more discussion around Council.
In the end, we moved to approve in principle the other utility rate increases (staff will now draft the appropriate Bylaws, so we can still debate some of the details), but I asked that the Electrical Utility bring back more options for Council in regards to electrical rates, including an analysis of what it looks like if we peg our rates to BC Hydro rate increases.
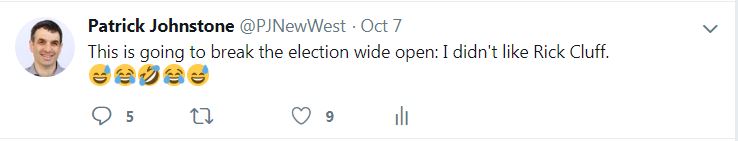
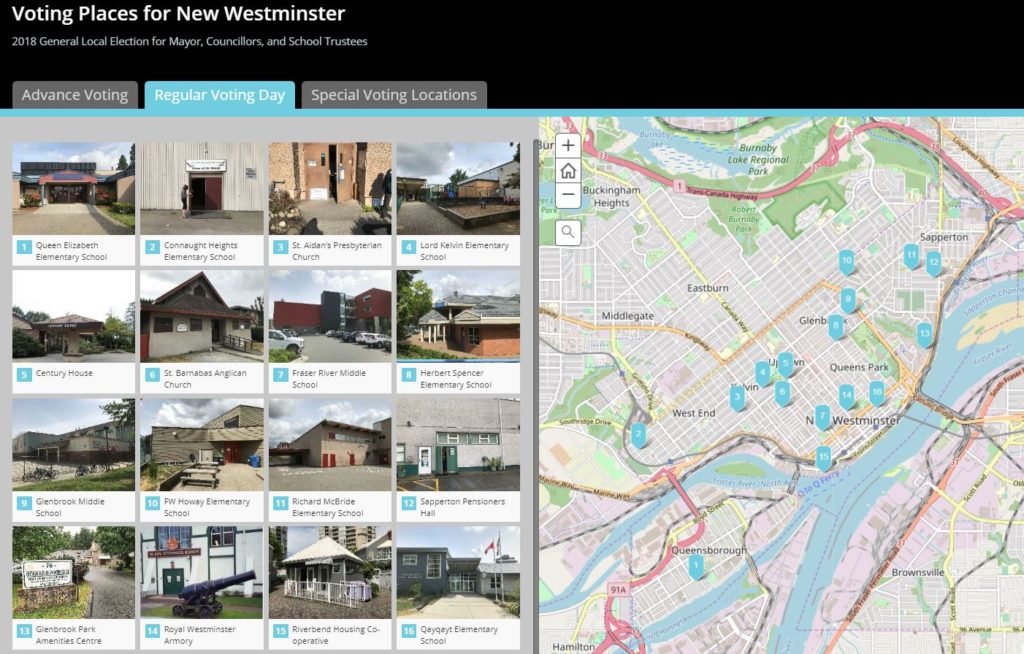
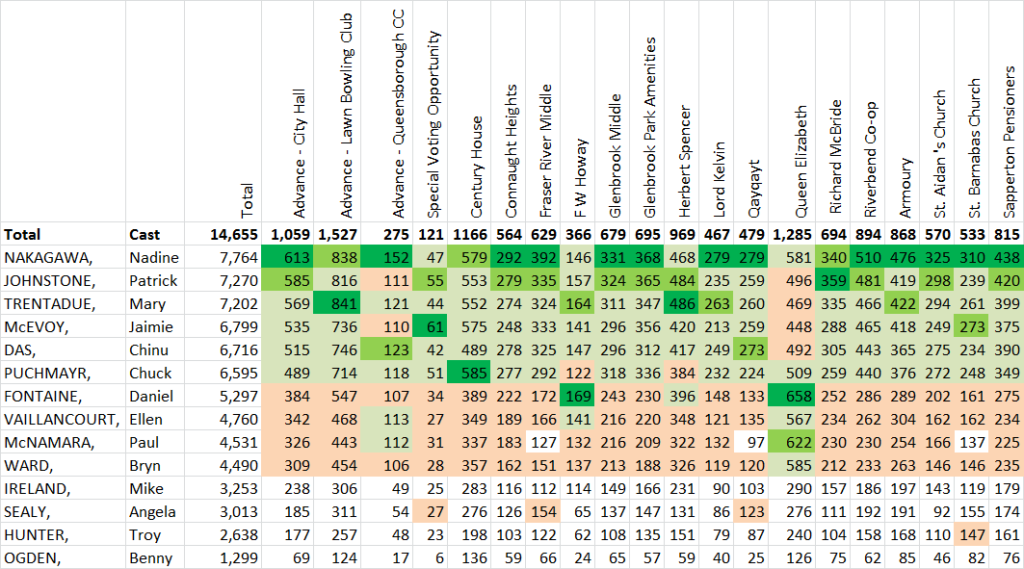
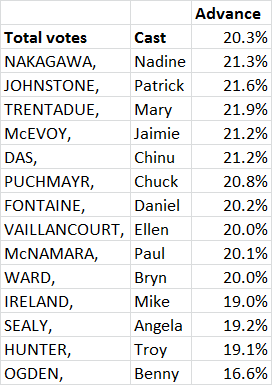
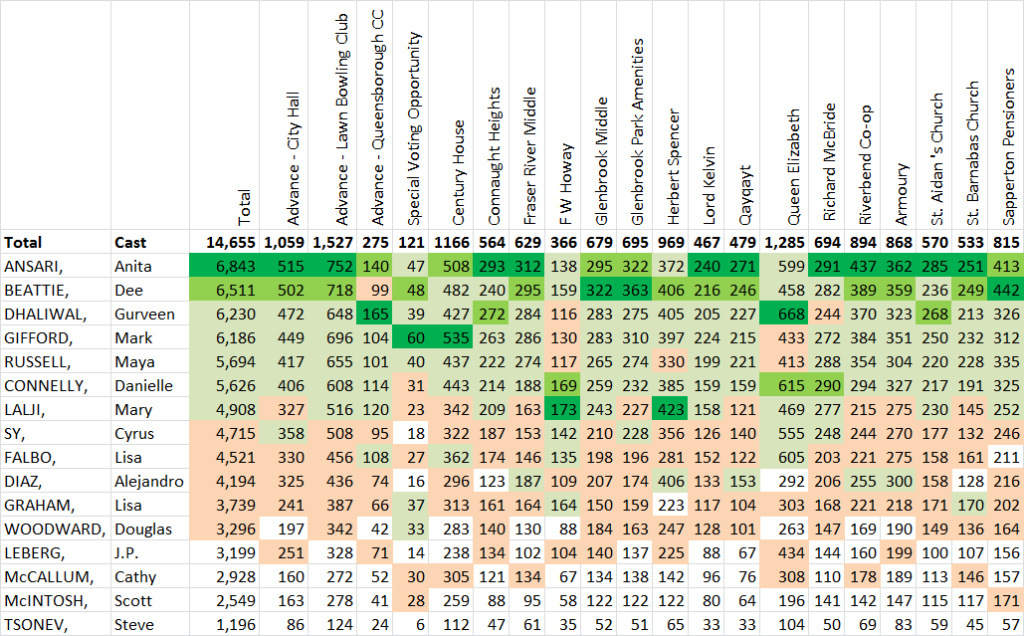
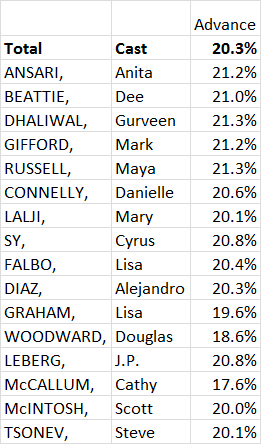
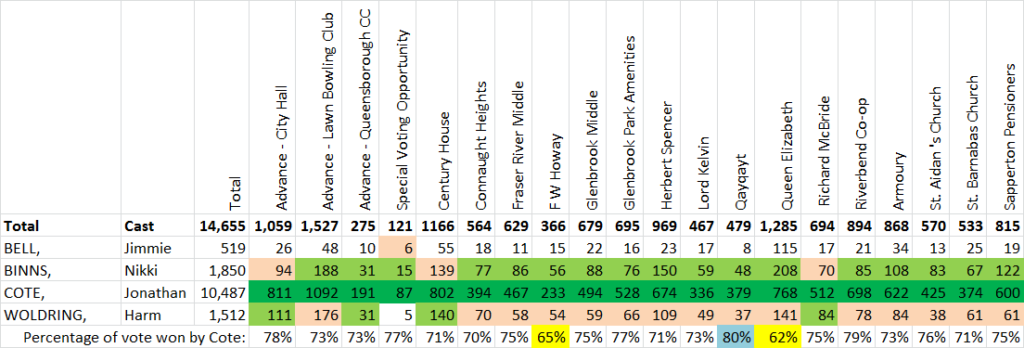
2018 General Local Election – Report of Election Results
This is the required-by-regulation report of final numbers for the election. The only new news here is that the turnout of registered voters was 29%, In the end, the turnout of registered voters was 29% turnout is slightly below the previous election but not anomalous. This report will be followed up in a later report with a more comprehensive review of how the election went and we can have a discussion then about voter engagement, poll issues, or budget needs for the next election.
420 Boyne Street (Animal Shelter): Consideration of Development Permit for Issuance
The City still plans to build a new Animal Care Facility and tow yard in Queensborough, and just like everyone else, we need to apply for a development permit to do so. Having Adopted the required Zoning Amendment back in October, and the building complying with that zoning, this shouldn’t be too complicated. The RA has no objections and the Design Panel supports the project with some minor adjustment of the cladding. I had a few questions about the pedestrian realm and roads around the new building, but as far as the DP itself, it’s ready to go!
41 Duncan Street (Child Care): Development Permit and Development Variance Permit – Consideration of Notice of Opportunity to be Heard
The development approved recently for 41 Duncan Street included a building that is intended to be a childcare facility. A DP and DVP are required to put that landuse there. Again, this stage reviews some of the form and character of the building and clarifies the amenities, parking facilities, and such things that will support the final building. This has been through the RA and design panel, and will go to a public Opportunity to be Heard on December 10, 2018. C’mon out and let us know what you think.
Front Street Sewer Upgrade (Metro Vancouver): Request for Extension of Construction Noise Bylaw Exemption
The sewer project that keeps on going is delayed a bit longer. Some of the work they need to do has to happen at night because that is when sewer flows are lower, so they are asking for a noise variance until the end of the year. I moved that we not give them an exemption from December 24th to December 31st. It’s Christmas, people are at home more and trying to enjoy time with their families. In the end Council moved to grant the variance until December 23, and if they need more time they can come back to us after January 1st.
Integration of the Regional Disaster Debris Management Guideline with the City of New Westminster Emergency Response Plan
This was a really interesting report for me (but perhaps not for everyone?) In the event of a major disaster, management of debris can be a huge logistical issue, and it is difficult to plan this kind of thing after the event when you have piles of debris everywhere. A little regional coordination and pre-planning will help a lot in the event of a seismic event, building collapse, tornado, or other derbis-inducing event. My concerns were mostly around liability and how our responsibilities under the Environmental Management Act are relinquished in the event of emergency action.
I might have geeked out a bit (sorry, staff), but am glad to see that this work is being done, and the region is being proactive planning for the certainty of a major incident.
Amendment to the Parks and Recreation Fees and Charges Bylaw
We are doing our annual review of fees. There were some election discussions at looking at making some changes to some Parks and Rec programs to make them more affordable, so Council asked staff to come back with a few adjustments of these proposed rate increases, especially around how the toonie program is supported.
There is also some good news in here about staff looking at a system where liability insurance can be provided at a very low cost to “unaffiliated” community group that may want to use Community rooms in our Rec centres and such. This is actually a significant barrier to some small users groups who lack meeting space, and I hope we can make something work here for them
We then had a couple of items Added to the Agenda:
Appointment of Chairs to 2019 Advisory Bodies of Council and Organizations
With a new Council Term comes new responsibilities. I am going to continue to chair the Access Ability Advisory Committee and ACTBiPed, am going to Chair the Intelligent City Advisory Committee, and join the Electrical Utility Commission. I will also continue on the Canada Games Pool Replacement Task Force and Transportation Task Force, and an joining the Riverfront and Public Realm Task Force. Outside of the City I am serving as the Chair of the Community Energy Association, and as second vice President of the Lower Mainland Local Government Association. So that should keep me busy.
Re-Appointment to the New Westminster Municipal Police board
Our Police force is regulated under the Police Act by a Police Board, the members of which are appointed by Order in Council by the Attorney General of BC, but City Council must nominate the appointee and send that recommendation to the AG. We are recommending the re-appointment of a current member.
Appointments to the New Westminster Library Board
Similar to the Police, the Library is regulated by a Provincial Act, but we are able to appoint the members to the Library board without asking the province for permission. We are appointing Councillor Trentadue and a community member to the board for two-year terms.
*I have decided this term to skip talking about all of the Bylaws we give various readings during these reports, its really not that exciting, gets long sometimes, and you can read the details in the Agenda. I will only report on the Bylaws when we adopt them, so you know when they become the Law of the Land and your compliance is expected.
We then Adopted some Bylaws:
Tree Protection and Regulation Bylaw Amendment Bylaw No. 8052, 2018; and
Development Services Fees and Rates Bylaw Amendment Bylaw No. 8053, 2018
These Bylaws that formalize the updates to the Tree Protection Bylaw that were given Third Reading back on October 1st were adopted by Council.
Development Services Fees and Rates Amendment Bylaw No. 8061, 2018;
Cultural Services Fees and Charges Amendment Bylaw No. 8060, 2018; and
Fees Amendment Bylaw No. 8059, 2018
These Bylaws that formalize the updates to our planning and engineering fees to keep up with inflation and changes in operational costs that were given Third Reading back on October 1st were adopted by Council.
Housing Agreement (813-823 Carnarvon) Amendment Bylaw No. 8056, 2018
This bylaws that secures affordable housing will be offered for the life of the recently-approved building in Downtown was adopted by Council.
And other than a few announcements and Public Delegations (that you will need to watch the video to learn about), we were done for the evening!
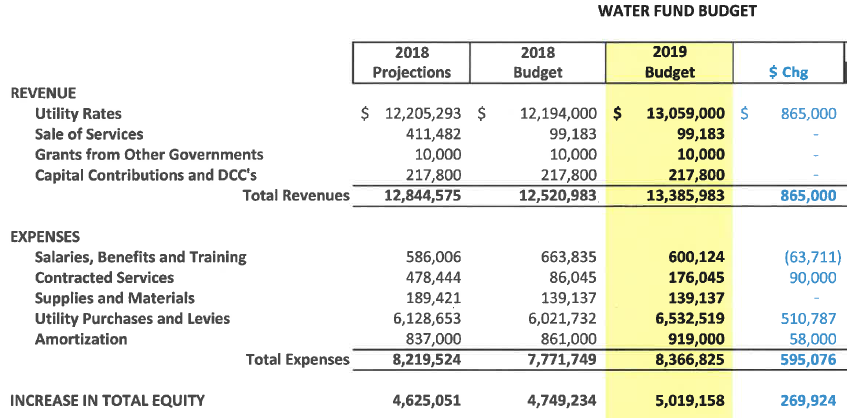
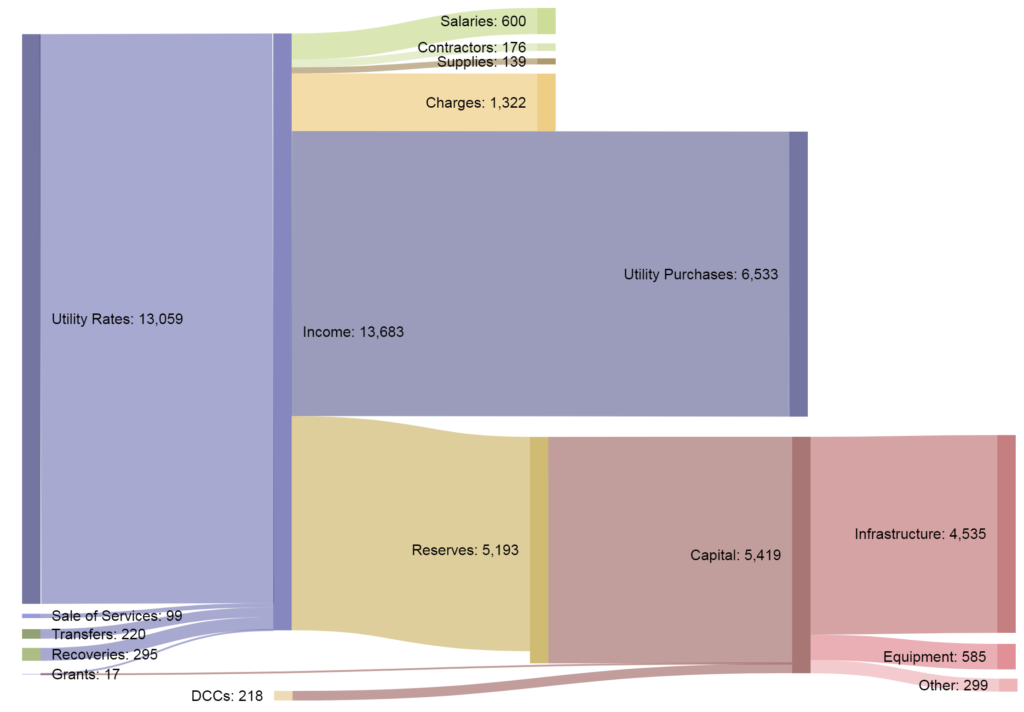
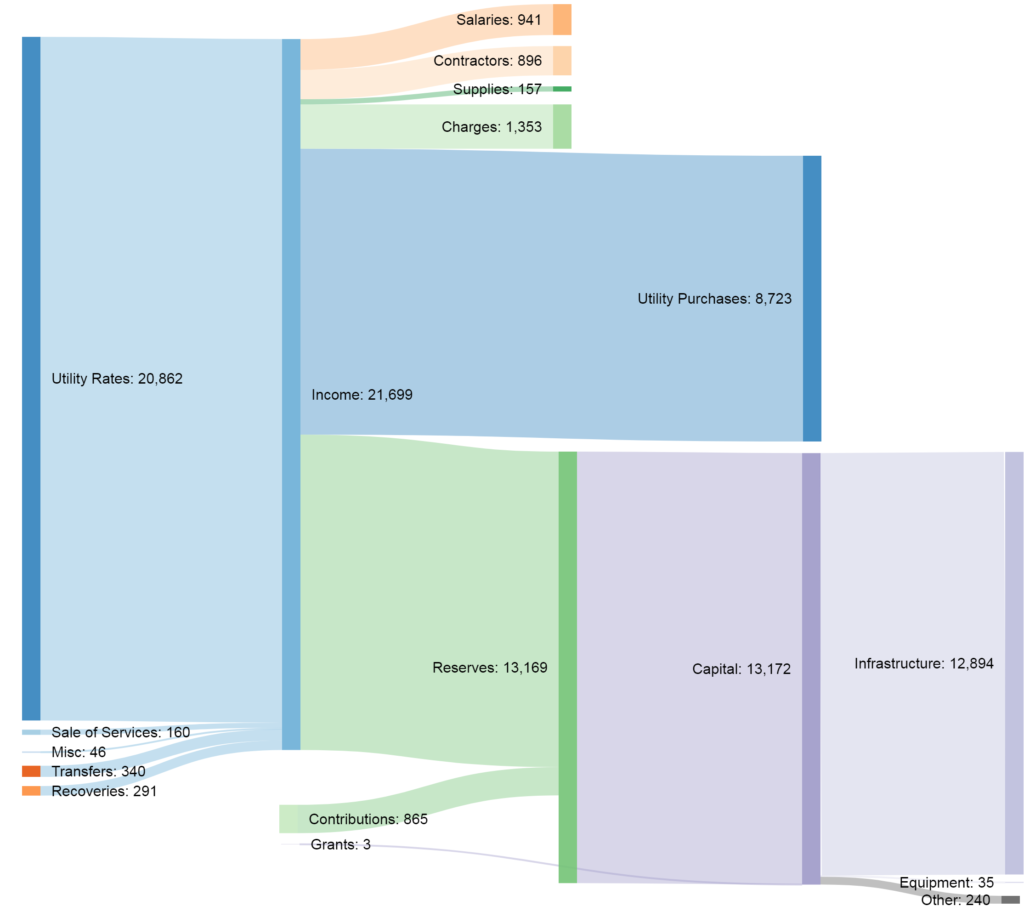 Immediately, you will notice we are spending much more money (proportionally) on infrastructure here than in the water utility. This is largely due to the ongoing sewer separation work that New Westminster has to deal with. You can see it is almost all spent on actual infrastructure ($13 Million!). You will note also that the gap between what we are putting into reserves and taking out is large – about $2.7 Million in 2019. We are also expected to receive another $865K in grants to help pay close that gap. Again, more on this later.
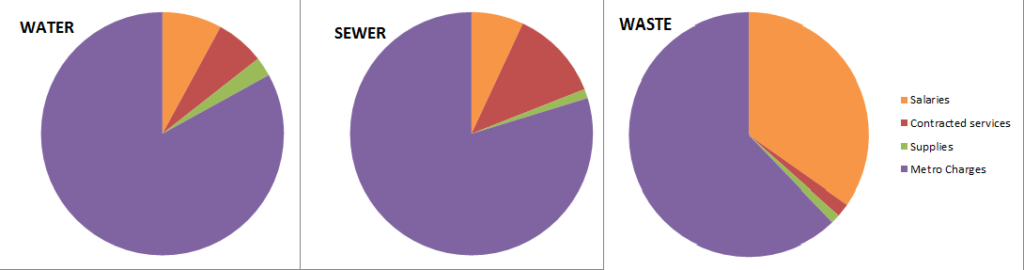
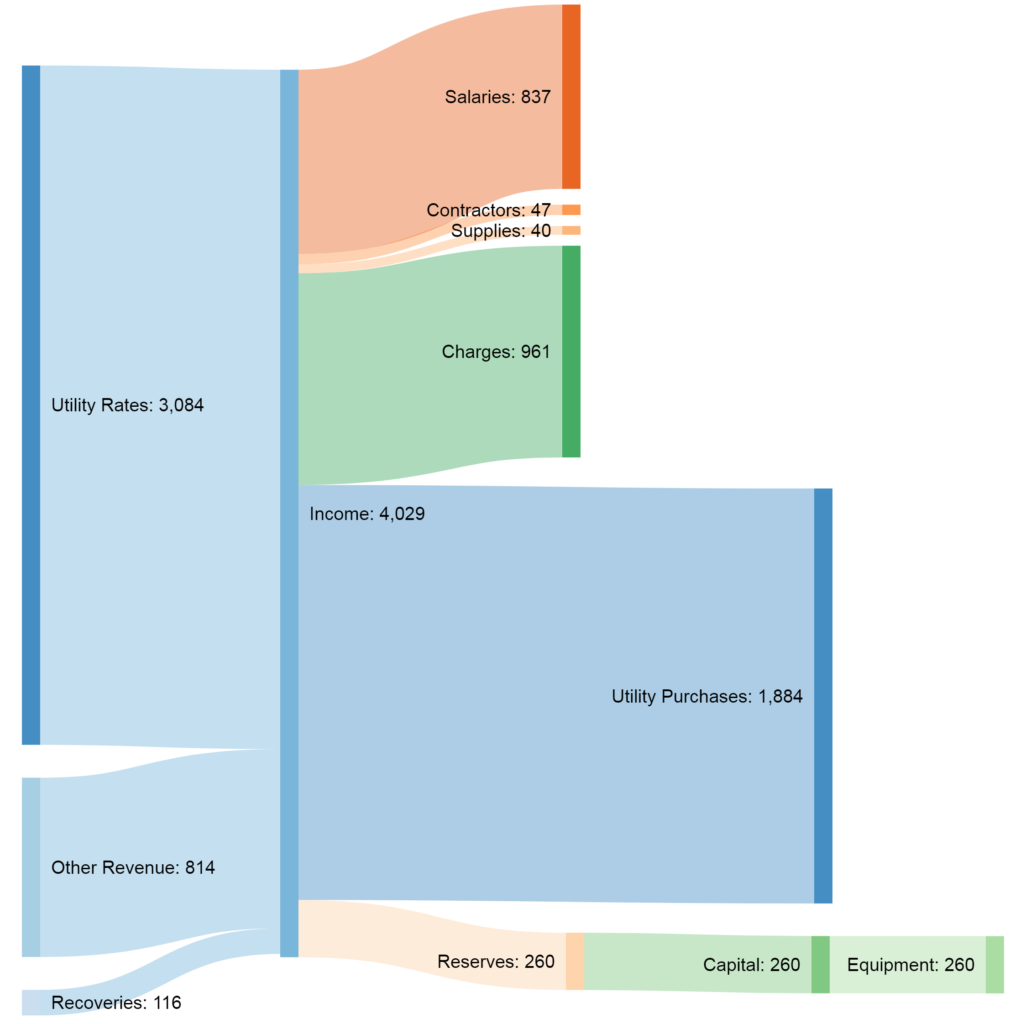 Two things stand out here: the capital budget is much smaller (it is all equipment), and both salaries and Charges is much bigger. This has to do with the nature of the work, collecting garbage requires people, and I suspect the largest “charges” expense is fuel to keep the garbage trucks rolling.
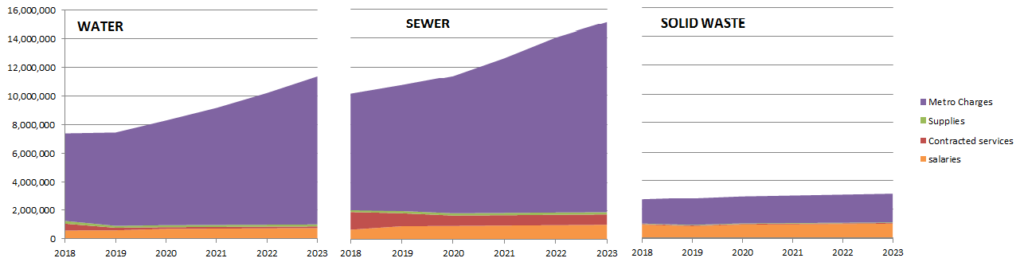
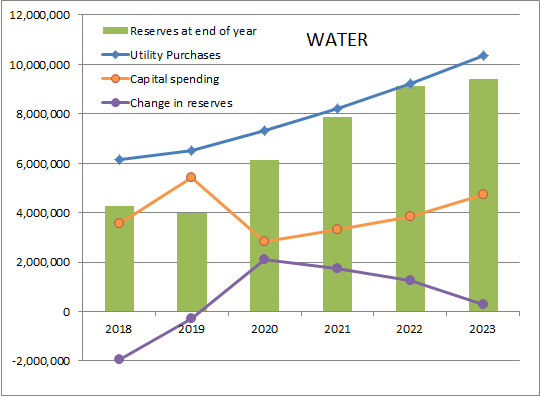 This graph shows how the main Water Utility cost drivers are going to change over the 5-year plan. The rates we pay to Metro for water going up steadily, capital spending increasing at a lower rate, and the trend for our reserves is moving from a small annual loss (remember the gap in the flow chart above) to an increase, then trending back to even. You can see by the green bars that our reserves are currently just over $4 Million, with the goal of them settling in at just under $10 million.
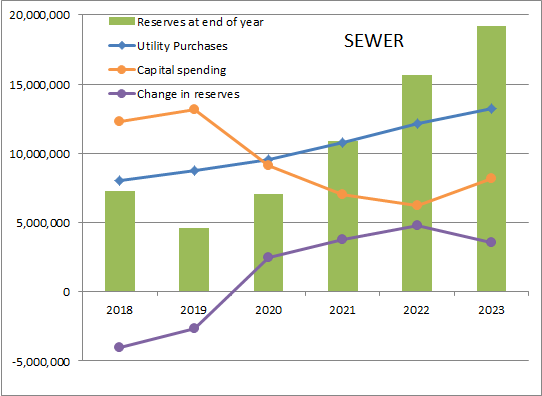 The same graph for the Sewer Utility shows Metro rates steadily increasing, capital spending going down, and our reserve contributions again going from negative to a more sustainable level.
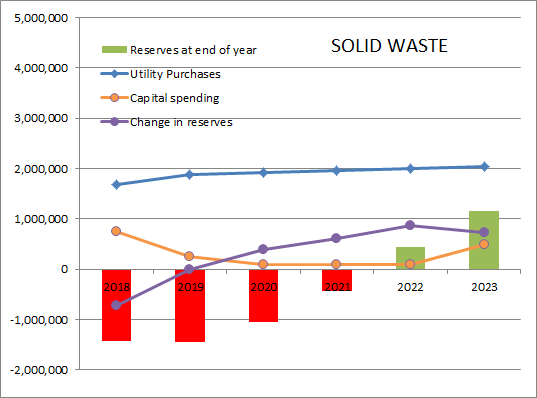 Finally, our Solid Waste accounts show Metro rates only increasing moderately, and our capital spending going down for a few years while the trend for reserves will hopefully go from a deficit position to a small positive reserve.