This year’s Union of BC Municipalities meeting was a crazy week for me, and I didn’t report out right away because I got behind on e-mail and council stuff and my other work and enough excuses I have a bit of time this weekend so here we go. Being a month and a half after actual event, I will try to keep this short, and if you want to hear longer details about what happens when a couple of thousand local government types get together and talk policy, you will have to buy me a beer, I guess.
The annual UBCM conference has several different elements for most participants, but I am going to skip past the AGM and appointment of executive stuff that is pretty inside baseball. The big three elements, and the reason we are all there, are the resolutions, the workshops, and the meetings. With so much going on, it is impossible to attend them all, but here were my experiences this year:
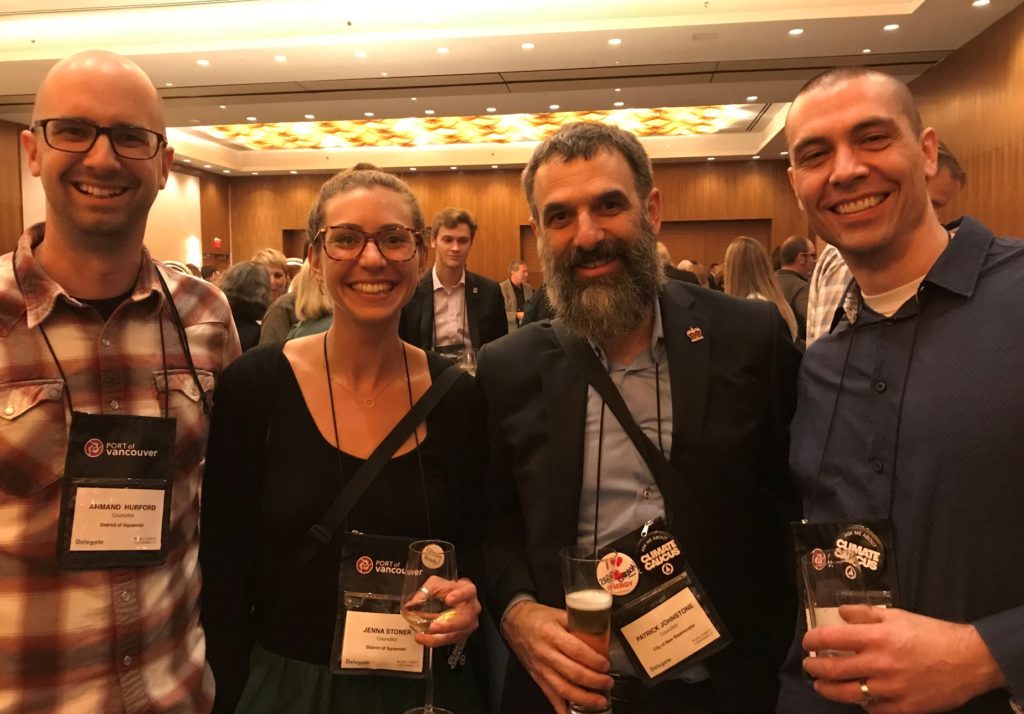
The Meetings: The City of New West had official meetings with several Ministers and senior provincial government staff to discuss specific issues. We share the load between my Council colleagues a bit on these meetings, so I was not able to attend them all. I did get to take part in the meeting with the Premier to discuss some aspects of our capital and strategic plans, and ways we thought the province could help us achieve them (and, of course, how us achieving them helps the provincial government meet some of their goals!). I’m not sure of the Premier deciding to put on his Victoria Shamrocks cap as he saw the New West contingent enter the meeting room was a good sign. New West Council also met with Ministers to discuss the future of the Massey Theatre site, the state of Indigenous Courts in New West, and the urgent need for support in building Child Care in New West.
I also serve a role on the executive of the Lower Mainland Local Government Association, which is kind of a professional association for local government elected officials and acts as a sort of local chapter of the UBCM serving the Greater Vancouver, Fraser Valley, and Sea to Sky areas. The Lower Mainland LGA has its own resolution sessions at our spring conference, and the Executive takes the highest-priority resolutions from the conference and requests meetings with the appropriate Ministers to lobby on the resolution topics.
Through this process, I was able to attend a meeting with senior officials in the Ministry of Environment, calling on them to match Local Governments’ commitment to climate action by declaring a Climate Emergency and consummate acceleration of their efforts to get BC in line with the emissions targets in the Paris Agreement. I took part in a meeting with the Attorney General asking for better support for the Indigenous Court System, with the Ministry of Transportation reiterating our need to make it easier for Local Governments to reduce speed limits within our jurisdictions, and with the Minister of Finance to discuss expansion of the vacancy tax and speculation tax programs. Finally, we had a meeting with the Minister of Indigenous Relations and Reconciliation where he and his staff outlined the Province’s intentions in introducing UNDRIP legislation.
The Resolutions:
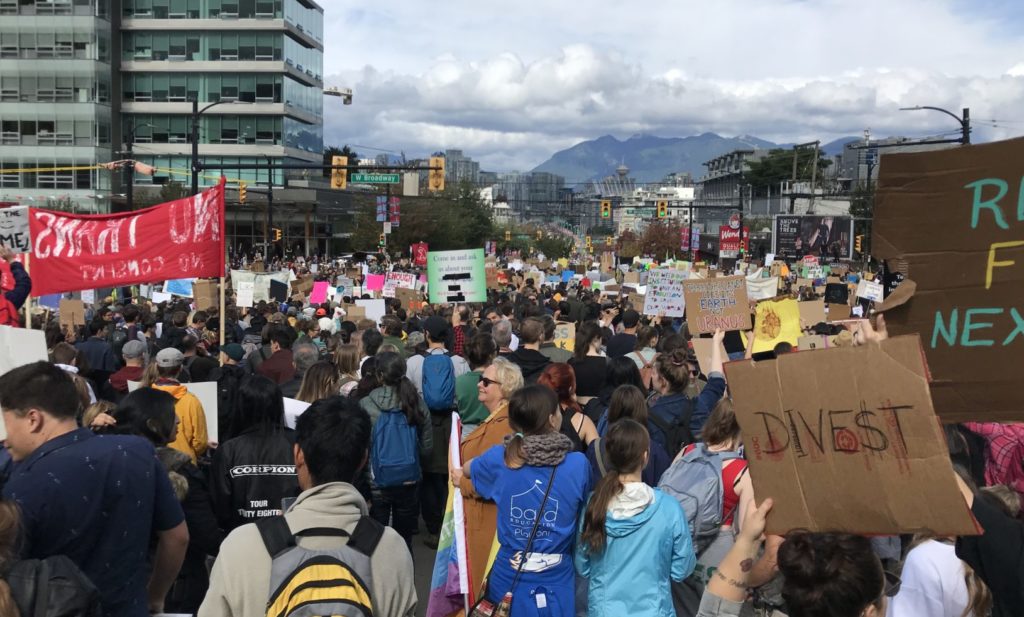
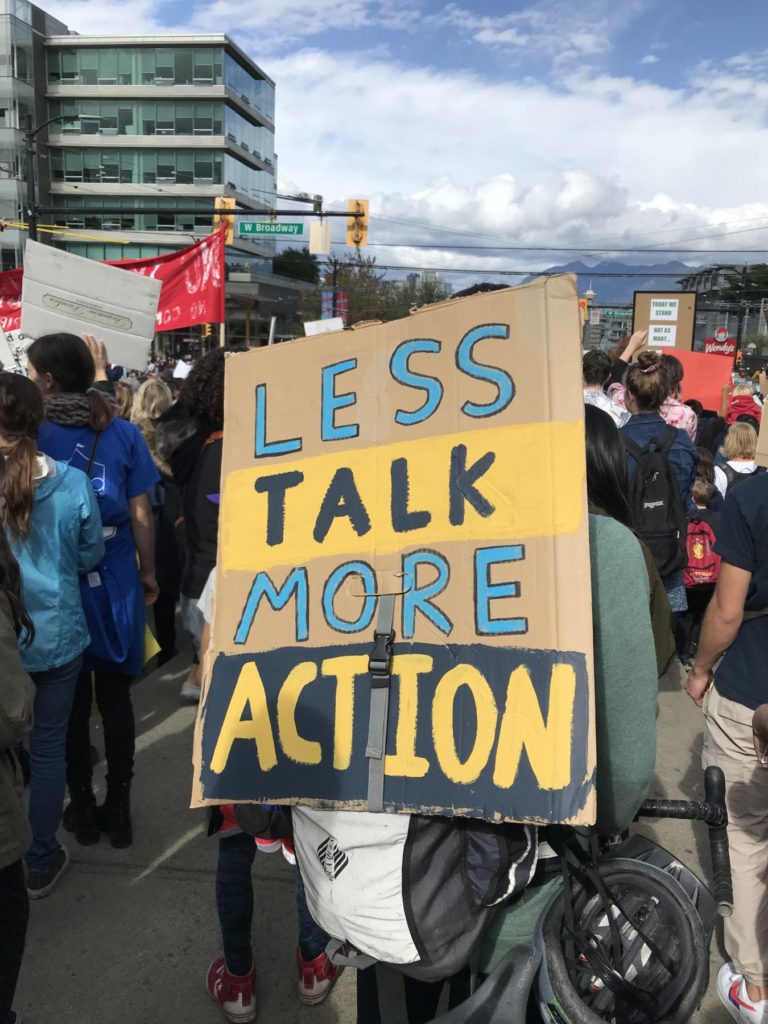
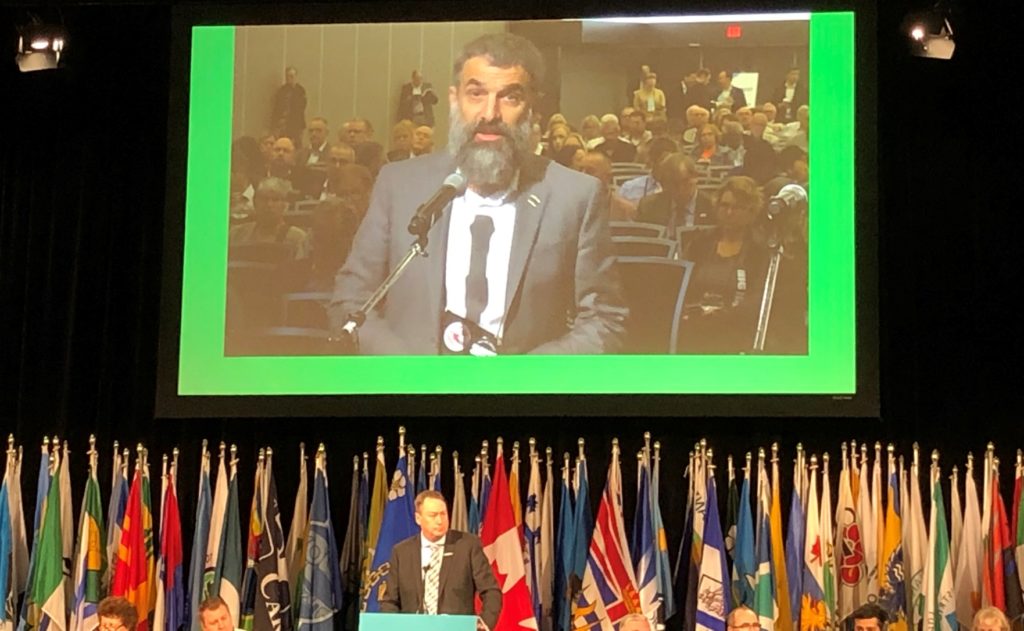
This is the part of UBCM where the group collectively calls on senior governments to change policy or provide funding. The UBCM resolutions session is a bit of a gong show, not in the least because there were more than 200 resolutions on the agenda this year. As the meeting has a fixed schedule, there was no chance we would get through them all. Some are moved through a “consent” block, but some others take a long time to work through as amendments and debate are inevitable, especially when talking about potentially divisive topics like whether we are killing the planet and maybe should do something about that.
New Westminster had seven (7!) resolutions, but only 6 were being considered:
B80: Declaration of Employee Compensation as Part of Annual SOFI Reporting was endorsed by the Membership. This was covered a bit here, and I was happy to hear that the members of UBCM supported this move to reduce harassment in our workplaces, especially for our public-facing workers.
B109: Fresh Voices #LostVotes Campaign call to open up voting in local elections to Permanent Residents was endorsed by the membership after a hearty debate lead by Councillor Nakagawa, and framed brilliantly by Councillor Sharmarke Dubow of Victoria.
B174: Investments in Local Government and Not-For-Profit Seniors’ Services and Supports;
B184: Creation of the Office of the Renters Advocate;
B194: School Bus Safety; and
B207: Support of Indigenous Court System.
None of these resolutions made it to the floor for debate. Simply put, the resolution session ran out of time, before these items got to the floor. We had about 220 resolutions (plus more than 60 “C” category resolution, see below), and only got through the first 168. These resolutions are “referred back to the Executive”, which means for the most part, they will disappear into a black hole. Some we may try to bring back next year.
C14: #AllOnBoardCampaign. This was the City of New West joining the call on the Province to make transit more equitable by removing fares for those under 18 years of age and to address the punitive structure of fare evasion fines for youth and those with low or no incomes. As a “C” category resolution, it was put aside in favour of another resolution that was thought to materially address the same topic. In this case, the UBCM resolutions committee saw Resolutions B113 and B114 by Burnaby (which addressed youth and restorative justice in fines, and increasing the low-income transportation subsidy, respectively) as being a more comprehensive approach to the issue, which is, in the technical term, bullshit. So we will have to go again next on this one with a better-structured resolution.
Alas, the resolutions session at UBCM is both exciting and frustrating. I can’t help but feel there needs to be a refresh of how resolutions are prioritized, and how the session is managed, as letting half of the resolutions die on the floor for lack of time is unsatisfactory to everyone. There is also a strange dichotomy of debate on the floor. I pledge next year to do a “slippery slope count” for how many times that phrase is used in an argument to not make change because it implies some sort of endorsement of much larger change. Not only is the “slippery slope” a logical fallacy – indeed I think it is the only logical fallacy we actually name while we make it – I think it is too often used to defend a status quo that even the delegate admits is not functional. Ah, governance.
Workshops:
This is the most typical “conference” part of the conference, where there are workshops and forums that let local government types find out what is happening around the province, what legislation is changing, what we could do better or stop doing badly so we can be better at our jobs.
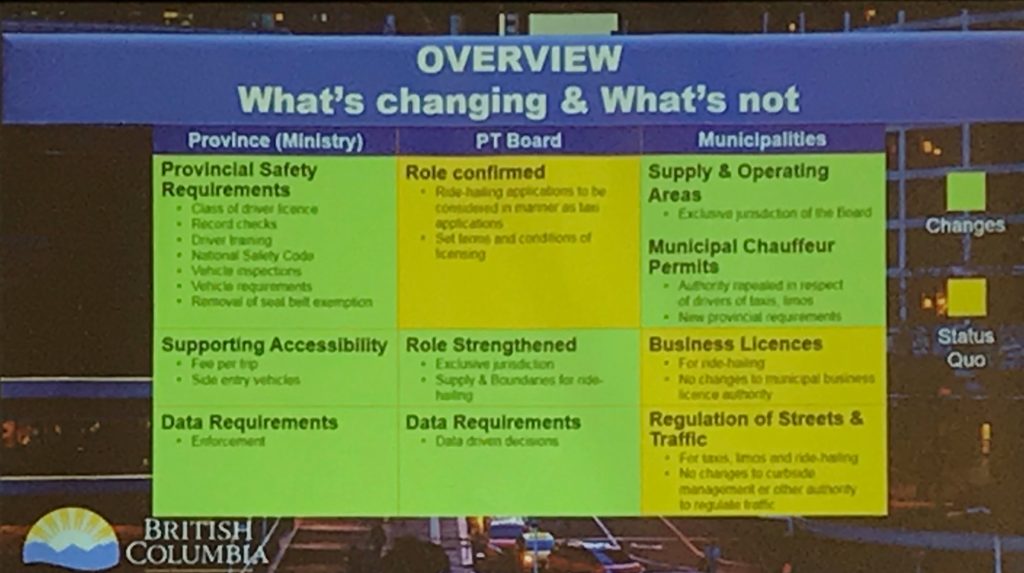
I attended a Policy Session on Ride Hailing “Passenger Directed Vehicle Services” legislation that was a bit of a hot mess, as it is clear that the provincial government is trying to responsibly regulate an industry whose business model is based on lack of regulatory oversight, and the audience’s essential message was “I want” despite the regulatory hurdles – which is a weird piece of cognitive dissonance for elected officials. I attended a Plenary on BC’s Energy Futures where the need to take immediate and meaningful action on climate was moderated against not asking a few “resource dependent” communities to change.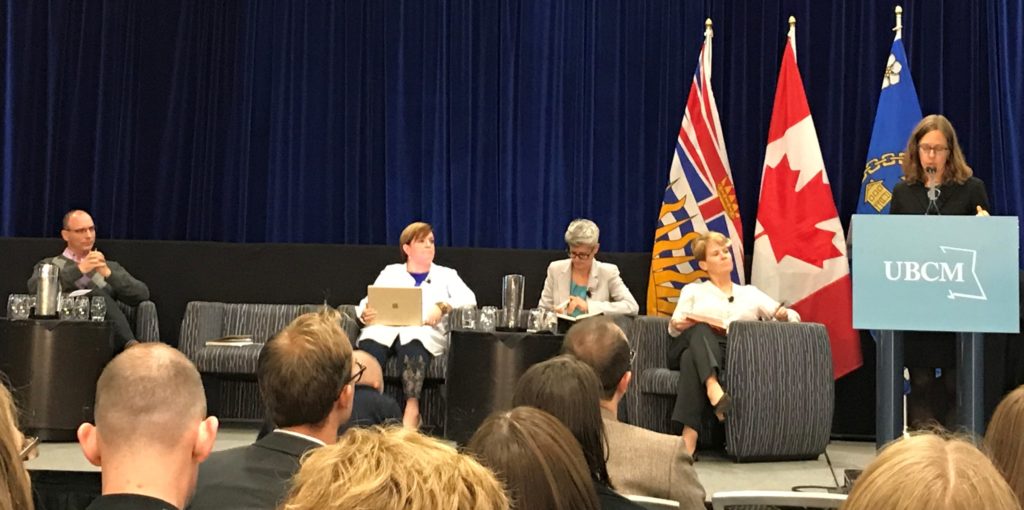 Yes, this is a Panel on Energy Policy in local government featuring some powerful and intelligent local leaders, and some guy from Langley who was there for undefined reasons.
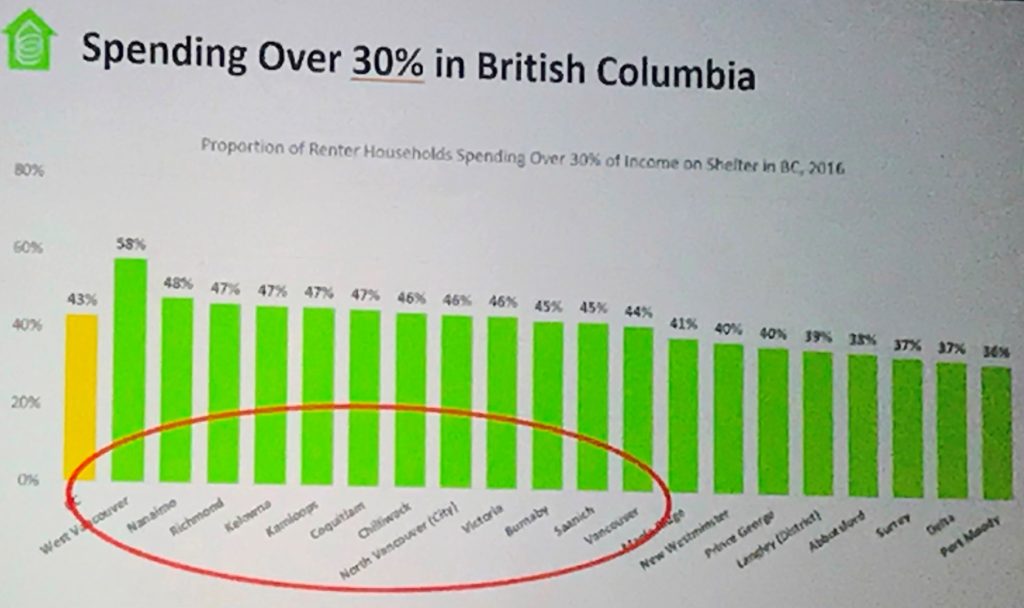
I was at the Large Cities Forum, where the dominant topic of conversation was clearly the housing crisis and the housing affordability crisis. I attended a workshop in the changing face of waste management and recycling as this area is shifting fast as the amount of waste we are generating is starting to increase again at the same time as global markets for recycling products is shrinking, and what that means for the targets we have set. I also attended a Cabinet Town Hall on Infrastructure investment.
We heard addresses by the Premier (well done, funny at times, nothing ground-breaking, and clearly more directed towards the more rural communities present), the Leader of the Official Opposition and the Leader of the Green Party. The star of the room, however, was Selena Robinson, who as Minister of Municipal Affairs and Housing is clearly getting a lot done and is building a lot of respect across party lines for the work she is doing.
I took part in the BC Municipal Climate Leadership breakfast with members of the Council and representatives from all three Provincial parties to discuss the alignment of local and provincial goals towards climate action. I am also the Chair of the Community Energy Association, so I was tasked with a bit of Awards Ceremony MCing, as the Minister of Energy and Mines handed out Climate and Energy Action Awards to local government across the province that have done exceptional work or are breaking new ground on reducing energy use and GHG emissions in their community.
So, yeah, looking back, it was a busy three days.
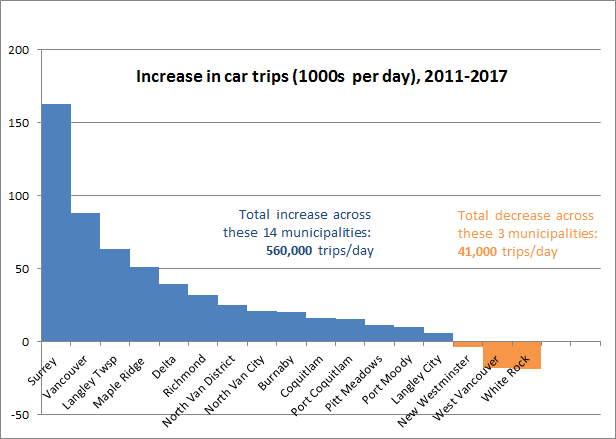
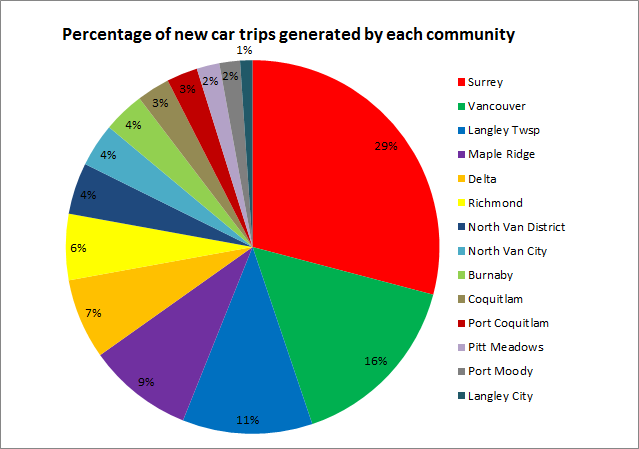
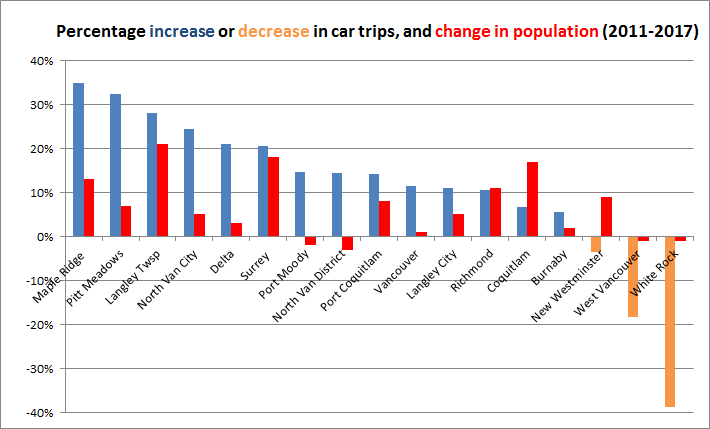
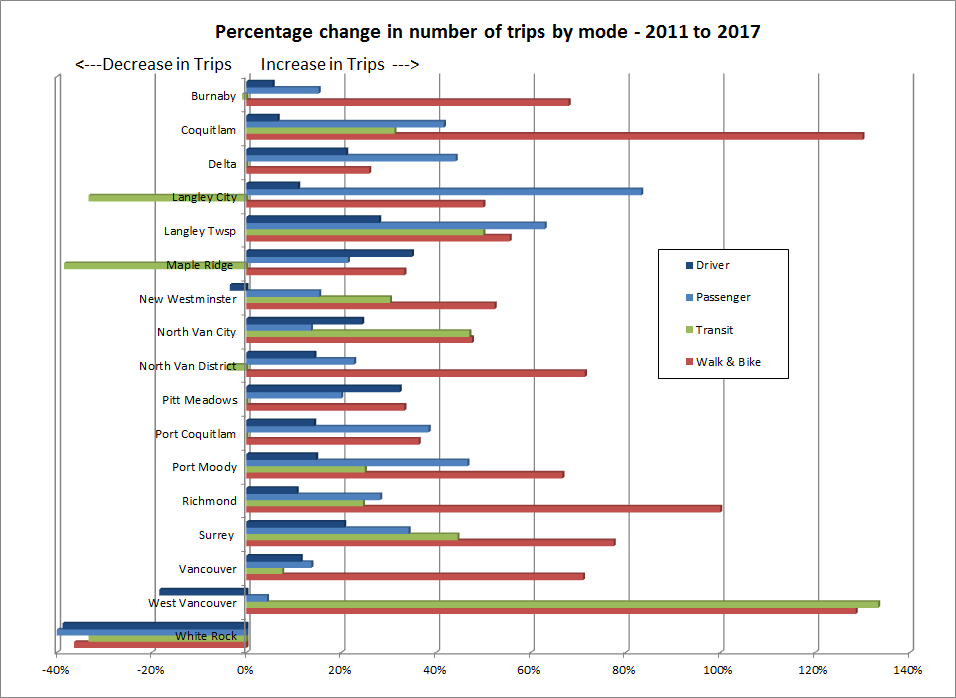
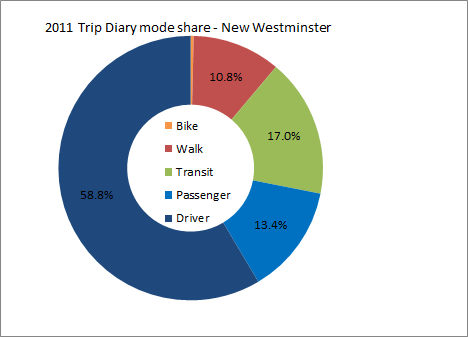
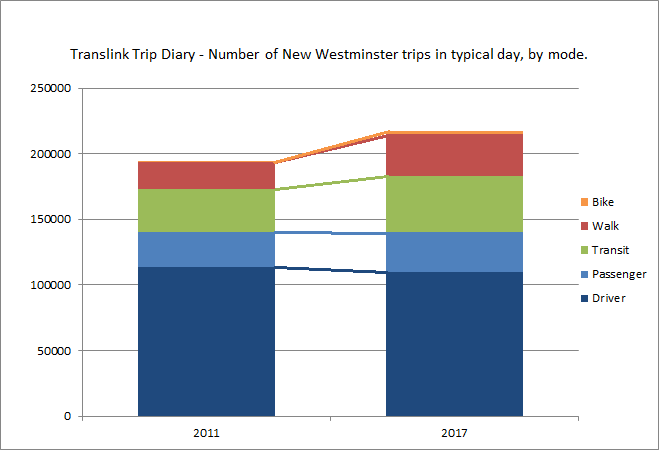
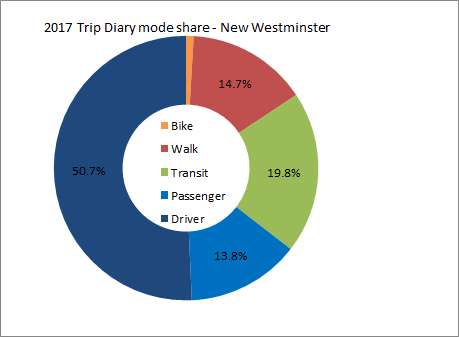 As you can see, the shift is subtle, but in a positive direction if you hate traffic. Our transit rode share went up to 20% and is now the highest in the region (Vancouver’s dropped a bit to 18%) New Westminster is now the City in BC with the highest transit mode share! Our walk share went up to 15% and is still 4th in the region, and our bike mode share doubled from dismal to still pretty bad. Or car mode share, however, dropped from 72% of all trips to 64.5%, and “passengers” went up a little bit in share, suggesting that single occupancy vehicle trips went down. Going from 59% to 51% of driving trips in 6 years is (a 14% decrease) is a really positive sign for the livability of our community.