This story picked up some regional media, and I was asked to comment. As is common and necessary, my lengthy thoughts were edited for a short TV news bit, so I wanted to expand on the discussion publicly, as there are a lot of details in this story that are relevant to how we do public engagement and discourse in the City. I wantto talk aobut the difference between community engagement, and the “white noise” of this astroturf anti-housing group.
I had never heard of “Lets Vote” or their colleagues at “We Vote Canada” until the BC Housing announcement of HEART and HEARTH funding and a Tiny Homes Village model for transitional housing in New Westminster. As BC Housing began its work of community consultation, there was clearly some community concern raised, which is not surprising or different than community concern raised when Mazarine Lodge, Moytel Lalem, or the upcoming housing at Sixth and Agnes were addressed at Council.
But there is something different this time.
There were suddenly small groups of people leafleting the neighbourhood, then at elementary schools across the City during student pick-up times. “Literally forcing pamphlets into parents’ hands” is how it was reported to me by a concerned parent. When one of these pamphlets was circulated to me, I scanned the QR code, and found an invite to join a WhatsApp group, which I briefly did to see what it was about before I was removed, presumably because the organizers recognized my name and their model of public engagement didn’t include engaging with decision makers.
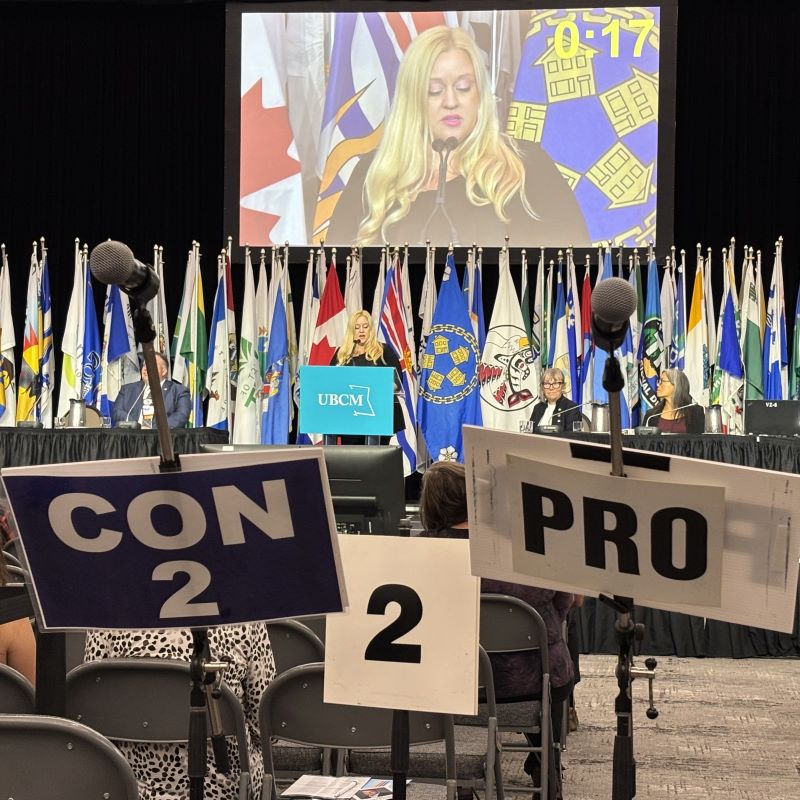
Then a planned protest showed up at one of the BC Housing open houses. A small group with pre-printed signs and a “LetsVote” banner, along with a PA system to provide opportunities to speak for several members of the BC Conservative Party from Richmond and Abbotsford. At this point, some colleagues from around the region contacted me and let me know that this appeared to be the same group of people who protested supportive housing and shelter projects in Burnaby, non-market housing in Semiahmoo Village in South Surrey, and against the very idea of “supportive housing” being included in White Rock’s Official Community Plan update. Same people, same signs, same anti-drug rhetoric used to oppose four (now 5) very different housing proposals in four different cities: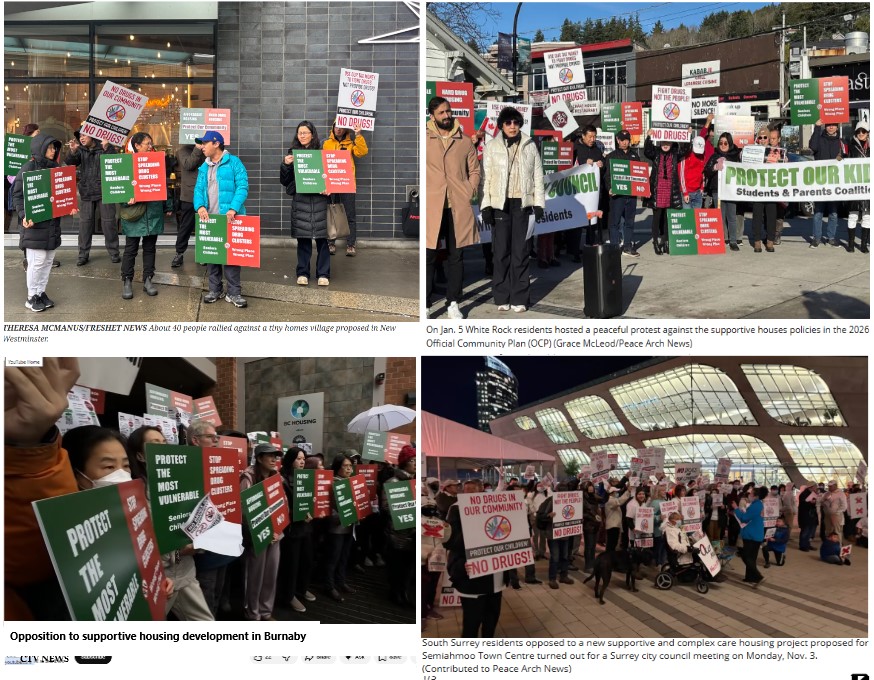
The same members (carrying the same signs) then showed up at New Westminster City Hall to protest before a Council meeting when the Tiny Homes Village was not even on the agenda. A New Westminster resident sent me a note of concern, as they has also received the pamphlet at the elementary school and had been following along with the “protest movement” out of curiosity, and sent me this image of the agenda for this protest:
![]()
Again, it was courteous of them to leave space at the end of the program for “New Westminster Locals”, but I am going to suggest that the purpose of this protest at New Westminster City Hall was not to relate the concerns of New Westminster residents to members of Council or staff at the City or BC Housing, but to put up their banners and platform an organization that is using misinformation and fearmongering to drive membership for the BC Conservative Party, predominantly in the ethnic Chinese community.
Part of me thinks this is all fine and good. Folks can organize politically and use their messaging skills to drive engagement, and the public can decide if they like or don’t like that message, and react accordingly. That’s democracy.
The other part of me is disappointed that this “white noise” is drowning out an important conversation the community needs to have. As we in the City engage with community and BC Housing around the delivery of transitional housing (and all housing, for that matter) it is important that we hear from community members and have an opportunity to share information and address legitimate concerns. We had a delegate at the same Council meeting as the protest, a resident from the Riverview area, express heartfelt concerns with questions about the impact of this project on his community. You can believe or not believe his concerns are legitimate based on the scope of the project, but it is our job to hear them, and address them the best we can. Having people with a political agenda and partisan bone to pick shouting mistruths and fearmongering is not conducive to that respectful dialogue. I also should note there were several locals from New Westminster at the protest, and I’m not sure if they had microphone time, but many of them came to Council Chambers afterward even though the housing was not on the the Agenda, and Council had no decision-making to do regarding the project at that time.
I have received a lot of correspondence on this file, both raising concerns and expressing support. The overwhelming response is “we need to do something about homelessness”. Some would like us to do it somewhere else other than here (though the notion of “where” is somewhat fuzzy), some would like us to do it in a different way, but very few are telling us to do nothing. Though most unhoused people in New West – those who will be prioritized for housing at the Tiny Homes Village – do not have active addictions to illegal drugs, some of them might. Just as some of the people in the apartment building where you live, perhaps in your very home, may have addictions. Telling a person that they cannot have a safe place to sleep because they have an addiction – be that to alcohol or cigarettes or opioids – is not a solution, it is exacerbating the problem. A safe place to live while they work though their addictions, their trauma, their mental health challenge, and find support to deal with those issues is not only the right thing to do morally, it is the proven path to a healthier community.
I find it a bit ironic that much of the correspondence from outside of New Westminster is concentrating on the need for drug-free housing options, suggesting the City should instead support drug-free / sober living and the recovery community. These folks are apparently unaware New Westminster is considered a national leader by the recovery community, and does more than most cities in Canada to support the recovery community in words and action, including having more sober living beds per capita than any other City in the Lower Mainland. There is nothing in the Tiny Homes Village that takes way from those efforts, or directs funds from those efforts. The simple reality is that we need every resource we can get our hands on to address homelessness – which is a very different set of tools than needed to address addiction, because they are not interchangeable crises. There is definitely some overlap between them, and where they overlap we need a range of tools because people in addiction are not a monoculture. We need complex care beds for some, we need detox and recovery for some, we need stability and access to counselling for some, we need medication for some, and for most we probably need some combination of those things.
The Tiny Homes Village is a work in progress. As a City, we have engaged with the railways and industrial neighbours, and are connecting them with BC Housing to determine what measures can be put into the Operations Plan to manage existing security and safety issues around their operations, and to assure the transitional housing reduces these concerns. I say existing, because there is already a history of informal encampments near this site that have been challenging for the Province and City to respond to, and this project provides us an opportunity to bring new and different tools to that challenge.
We are also looking forward to the results of the BC Housing engagement process, and the City will be using that information to inform not just the Operations Plan, but the Neighbourhood Inclusion process we are setting up with BC Housing to provide proactive management of issues around the village once it is set up in the fall. We are taking guidance from other jurisdictions where this model has been successful in similar settings, and learning from the example of others where there were issues that needed addressing. And the conversation with the community continues.